Denver, a bustling city well known for its outdoor recreational opportunities, and Southwest Arapahoe, a quieter suburb in Colorado, offer diverging experiences to both residents and tourists. A thoughtful exploration of their crime rates, weather, cost of living, educational opportunities and more will clear a path to understanding their unique offerings and distinctions.
Denver has a crime rate higher than the national average, influencing the perception of the city's safety. It's predominantly affected by property theft, though violent crimes also occur. In contrast, Southwest Arapahoe is generally safer, with crime rates significantly below national averages. Both communities have dedicated law enforcement agencies ensuring the safety of residents and tourists alike.
Cost of Living
Living in Denver is comparatively more expensive than residing in Southwest Arapahoe. This is largely due to higher housing costs in Denver, which also extend to utilities and transportation. On the other hand, Southwest Arapahoe offers a slightly lower cost of living, which is attractive to many individuals considering relocation.
Income Tax
For both locations, Colorado imposes a flat income tax rate of 4.63%. This rate applies uniformly across all income levels, making Colorado one of just a few states with a flat tax system.
Property Tax
Property taxes in Denver are relatively low, compared to the national average. Southwest Arapahoe also enjoys low property tax rates. The exact amount, however, depends on the assessed value of the property.
Sales Tax
Both Denver and Southwest Arapahoe have sales taxes higher than the US average. Denver has a combined city and state sales tax rate of 8.31%. In Southwest Arapahoe, the combined sales tax rate is 6.5%.
Income
Type
Denver
Southwest Arapahoe
Estimated median household income
$81,630
$94,400
Estimated per capita income
$52,690
$57,187
Cost of living index (U.S. average is 100)
111.3
113.3
If you make $50,000 in Denver, you will have to make $50,898 in Southwest Arapahoe to maintain the same standard of living.
Geographical Conditions
Denver and Southwest Arapahoe both lie near the foothills of the Rocky Mountains. This geography brings outdoor recreational opportunities, from hiking to skiing, but also comes with the challenges of variable weather conditions and altitude.
Geographical information
Type
Denver
Southwest Arapahoe
Land area
153.4 sq. miles
69.4 sq. miles
Population density
4,639.5 people per sq. mile
2,907.1 people per sq. mile
Relative area comparison
Denver, CO Southwest Arapahoe, CO
Education
Denver is home to numerous public and private schools, along with postsecondary institutions like the University of Colorado Denver. Southwest Arapahoe has access to the Arapahoe School District, which boasts decent schools and student-teacher ratios. There are also private school options, while universities and colleges are a short commute away.
Denver's economy is robust, with desirable employment opportunities in industries like aerospace, healthcare, and IT. Southwest Arapahoe, being less urbanized, has a more limited, local economy. Many residents commute to Denver or other nearby cities for work, benefiting from the larger job market.
Biggest Employers
Denver boasts big-name employers like Denver Health, Denver Public Schools, and Lockheed Martin. Southwest Arapahoe, being part of Arapahoe County, has its largest employers in retail and service businesses within Greater Denver, like King Soopers and Hilton Worldwide.
In Denver (Denver County), 73.9% voted for Democrats and 24.3% for Republicans in 2012 Presidential Election. In Southwest Arapahoe (Arapahoe County), 54.4% voted for Democrats and 44.4% for Republicans.
Elections
Type
Democrats
Republicans
Other
Year
Denver
Southwest Arapahoe
Denver
Southwest Arapahoe
Denver
Southwest Arapahoe
2020
80.1%
61.3%
18.3%
36.6%
1.6%
2.1%
2016
74.2%
53.1%
19.0%
38.9%
6.8%
8.1%
2012
73.9%
54.4%
24.3%
44.4%
1.7%
1.3%
2008
75.8%
56.0%
23.2%
43.0%
1.0%
1.0%
2004
69.7%
47.6%
29.3%
51.6%
0.9%
0.8%
2000
62.0%
43.6%
30.9%
51.6%
7.0%
4.8%
1996
61.8%
41.9%
30.0%
50.8%
8.2%
7.3%
Breakdown of population affiliated with a religious congregation
Type
Adherents
Congregations
Religion
Denver
Southwest Arapahoe
Denver
Southwest Arapahoe
CATHOLIC CHURCH
26.6%
12.1%
8.7%
4.3%
AMERICAN BAPTIST CHURCHES IN THE USA
2.1%
0.1%
4.3%
1.7%
EPISCOPAL CHURCH
1.1%
0.4%
3.2%
1.7%
SALVATION ARMY
1.1%
0.0%
0.7%
0.7%
SOUTHERN BAPTIST CONVENTION
0.9%
1.6%
6.8%
9.9%
SEVENTH DAY ADVENTIST CHURCH
0.7%
0.2%
3.0%
2.6%
MUSLIM ESTIMATE
0.5%
1.9%
0.9%
1.0%
EVANGELICAL LUTHERAN CHURCH IN AMERICA
0.4%
2.0%
2.7%
4.3%
LUTHERAN CHURCH
0.3%
1.0%
2.3%
2.6%
EVANGELICAL PRESBYTERIAN CHURCH
0.0%
0.6%
0.2%
2.6%
VINEYARD USA
0.0%
0.5%
0.2%
0.3%
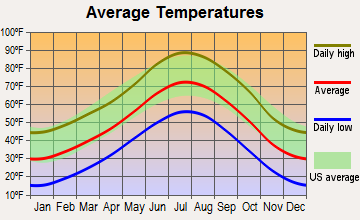
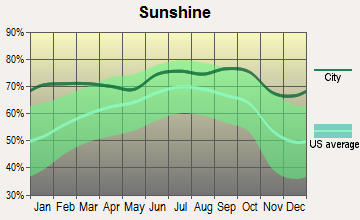
Weather
Denver is famously known for its 300 days of sunshine a year, with a semi-arid climate offering hot summers and cold, snowy winters. Southwest Arapahoe experiences very similar weather patterns. Both locations are high-altitude areas, which can affect health and athletic performance, particularly for newcomers and tourists.
Weather and climate
Type
Denver
Southwest Arapahoe
Temperature - Average
49.5°F
50°F
Humidity - Average morning or afternoon humidity
50.6%
50.6%
Humidity - Differences between morning and afternoon humidity
20%
20%
Humidity - Maximum monthly morning or afternoon humidity
55%
55%
Humidity - Minimum monthly morning or afternoon humidity
35%
35%
Precipitation - Yearly average
17 in
17.5 in
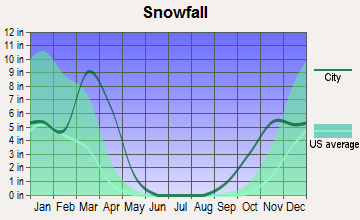
Snowfall - Yearly average
114 in
113.9 in
Clouds - Number of days clear of clouds
19.2%
19.2%
Sunshine amount - Average
75.6%
75.6%
Sunshine amount - Differences during a year
10%
10%
Sunshine amount - Maximum monthly
74%
74%
Sunshine amount - Minimum monthly
64%
64%
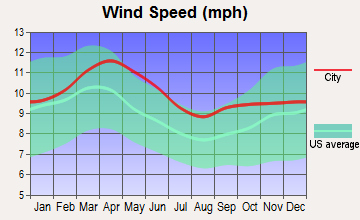
Wind speed - Average
8.6 mph
8.6 mph
Average climate in Denver, Colorado
Average climate in Southwest Arapahoe, Colorado
Air pollution
Type
AQI
CO
NO2
OZONE
PB
PM10
PM25
SO2
Year
Denver
Southwest Arapahoe
Denver
Southwest Arapahoe
Denver
Southwest Arapahoe
Denver
Southwest Arapahoe
Denver
Southwest Arapahoe
Denver
Southwest Arapahoe
Denver
Southwest Arapahoe
Denver
Southwest Arapahoe
2018
100
100
0.50
0.40
25.4
22.3
27.9
32.3
N/A
N/A
29.2
29.2
8.6
8.2
0.7
0.7
2017
95
95
0.49
0.40
25.9
22.6
27.6
32.6
N/A
N/A
22.0
22.0
8.4
8.2
0.8
0.8
2016
90
90
0.53
0.45
27.7
24.5
27.2
32.2
N/A
N/A
22.6
22.6
8.7
7.9
1.0
1.0
2015
101
101
0.53
0.46
27.8
24.2
25.2
30.7
N/A
N/A
21.0
20.8
10.4
9.6
1.0
1.0
2014
94
94
0.53
0.45
25.4
23.2
24.6
30.6
N/A
N/A
25.1
23.8
10.1
10.1
1.3
1.3
2013
85
85
0.45
0.41
21.9
20.7
24.0
31.2
N/A
N/A
24.4
23.1
N/A
N/A
1.5
1.4
2012
91
91
0.33
0.34
18.9
18.9
26.2
31.3
N/A
N/A
24.9
24.7
N/A
N/A
1.4
1.3
2011
91
91
0.34
0.33
18.1
18.1
25.8
30.4
N/A
N/A
23.7
23.8
N/A
N/A
1.6
1.6
2010
82
82
0.43
0.42
16.3
16.3
23.6
28.0
N/A
N/A
26.4
26.4
N/A
N/A
1.0
1.0
2009
79
79
0.41
0.37
14.1
14.1
23.1
26.9
0.005
0.005
22.2
22.4
N/A
N/A
1.3
1.3
2008
85
85
0.43
0.42
17.3
17.3
26.0
30.1
0.008
0.008
25.2
25.4
N/A
N/A
1.6
1.6
2007
96
96
0.37
0.40
20.6
20.6
21.9
27.6
0.007
0.007
30.2
29.4
N/A
N/A
1.2
1.2
2006
89
89
0.51
0.50
19.0
19.0
22.1
27.1
0.008
0.018
28.0
28.0
N/A
N/A
1.4
1.4
2005
86
86
0.57
0.57
21.3
21.3
20.9
23.6
0.068
0.090
30.9
29.8
N/A
N/A
1.5
1.5
2004
82
82
0.60
0.60
21.2
21.2
19.2
22.7
0.012
0.024
28.6
28.6
N/A
N/A
1.8
1.8
2003
106
106
0.60
0.59
21.2
21.2
20.8
24.5
0.015
0.027
32.6
32.6
N/A
N/A
1.9
1.9
2002
86
86
0.65
0.64
19.2
19.2
20.4
24.1
0.014
0.021
35.7
35.7
N/A
N/A
2.5
2.5
2001
95
95
0.86
0.80
23.6
22.2
18.6
22.2
0.012
0.021
32.6
32.6
N/A
N/A
2.6
2.6
2000
93
93
0.81
0.78
13.4
12.5
19.2
23.1
0.013
0.023
12.2
12.2
N/A
N/A
2.1
2.1
Natural disasters
Type
Denver
Southwest Arapahoe
Tornado activity compared to U.S. average
129.5%
125.3%
Earthquake activity compared to U.S. average
811.7%
815.2%
Natural disasters compared to U.S. average
10%
10%
Transportation
Denver has an efficient, extensive public transit system, including buses, light rail, and bike lanes. The city also offers multiple commuting options, including the popular Denver B-cycle program. Southwest Arapahoe utilizes regional connectivity to Denver and other towns and is dependent on private vehicles for commuting.
Transport
Type
Denver
Southwest Arapahoe
Amtrak stations
2
0
Amtrak stations nearby
2
1
FAA registered aircraft
602
0
FAA registered aircraft manufacturers and dealers
28
0
Means of transportation to work
Type
Denver
Southwest Arapahoe
Bicycle
1.5%
0.4%
Bus
2.6%
2.6%
Carpooled
8.8%
8.7%
Car alone
81.1%
79.5%
Railroad
1.2%
0%
Streetcar
0.2%
0.1%
Taxicab
0.1%
0%
Walked
2.8%
1.9%
Average travel time to work
Type
Denver
Southwest Arapahoe
Average
29.4 min
23.6 min
Real Estate
The real-estate market in Denver has been experiencing a surge, leading to higher housing prices. Southwest Arapahoe's real-estate market is more affordable but less dynamic. Both regions offer different styles of housing to cater to diverse requirements.
Neighborhoods
Denver's neighborhoods, such as Lower Downtown, Capitol Hill, and Cherry Creek, offer varied vibes and amenities. Southwest Arapahoe is less urbanized, with family-friendly neighborhoods and a slower pace of life. Each area displays distinctive characteristics attracting a broad demographic.
Houses and residents
Type
Denver
Southwest Arapahoe
Houses
351,829
74,676
Average household size (people)
2.2
2.3
Houses occupied
326,634 (92.8%)
72,320 (96.8%)
Houses occupied by owners
164,429 (50.3%)
51,515 (71.2%)
Houses occupied by renters
162,205 (49.7%)
20,805 (28.8%)
Median rent asked for vacant for-rent units
$1,674
$1,892
Median price asked for vacant for-sale houses and condos
$970,375
$836,561
Estimated median house or condo value
$541,500
$580,701
Median number of rooms in apartments
3.5
3.9
Median number of rooms in houses and condos
6.4
8.4
Renting percentage
50%
33.4%
Housing density (houses/condos per square mile)
2,294.3
1,076.2
Household income disparities
44%
39.5%
Housing units without a mortgage
2,112 (1.7%)
10,129 (21.9%)
Housing units with both a second mortgage and home equity loan
9,615 (7.6%)
188 (0.4%)
Housing units with a mortgage
123,690 (98.3%)
36,226 (78.1%)
Housing units with a home equity loan
273 (0.2%)
4,073 (8.8%)
Housing units with a second mortgage
12,819 (10.2%)
5,648 (12.2%)
Housing units lacking complete kitchen facilities
1.3%
0.6%
Housing units lacking complete plumbing facilities
Self-employed workers in own not incorporated business
24,661
8,094
State government workers
15,204
2,412
Unpaid family workers
763
266
Industries and Occupations
Denver offers diverse industries, with the government, education, tourism, and healthcare sectors being dominant. Southwest Arapahoe primarily lends itself to the service, retail, and education sectors. While there are job opportunities in both areas, Denver definitely provides more diversity.
Denver is home to several reputed health care providers like the Denver Health Medical Center and UCHealth University of Colorado Hospital. Southwest Arapahoe benefits from proximity to these health institutions, as well as local health facilities.
Health (county statistics)
Type
Denver
Southwest Arapahoe
General health status score of residents in this county from 1 (poor) to 5 (excellent)
Denver boasts comprehensive infrastructure, including efficient public transportation, parks, and recreational facilities. It's home to Denver International Airport, providing both international and domestic travel options. Southwest Arapahoe is less developed, but enjoys well-kept roads and connectivity to other parts of the state.
Infrastructure
Type
Denver
Southwest Arapahoe
TV stations
17
16
Culture and Food
Denver boasts an exciting culinary scene, vibrant nightlife, and rich cultural offerings, including a range of museums and diverse music venues. Southwest Arapahoe has a quieter culture, with local eateries serving cuisine reflecting the suburban community’s character.
Sports Teams
Denver is a sports haven, home to four major sports teams: Denver Broncos (NFL), Colorado Rockies (MLB), Denver Nuggets (NBA), and Colorado Avalanche (NHL). Southwest Arapahoe doesn't host any major sports teams but residents are just a short commute away from Denver's sports action.
 Denver, CO
 Southwest Arapahoe, CO