Overview
Detroit, Michigan, and Akron, Ohio are two cities with distinctive characteristics and unique rhythms. From crime rates to cost of living, and from sports teams to job opportunities, these cities differ significantly in various aspects. This comprehensive comparison between Detroit and Akron provides a full understanding of what each city has to offer for both residents and tourists.
Distance between
Detroit, MI and
Akron, OH : 122.1 miles
Detroit's population is larger by 234%. Its population has decreased by 318,806 people (33.5%) since 2000. The population of Akron has decreased by 27,727 people (12.8%) during that time.
Unfortunately, Detroit consistently ranks among the US cities with the highest crime rates. While there are safer neighborhoods and the city has implemented efforts to curb crime, it remains a considerable concern for both residents and visitors. On the other hand, Akron has a lower crime rate than Detroit, although it is slightly above the national average. Both cities are striving to improve these statistics for a safer environment.
City-data.com crime index counts serious crimes and violent crime more heavily. It adjusts for the number of visitors and daily workers commuting into cities. (higher means more crime, U.S. average = 301.1)
City-data.com crime index counts serious crimes and violent crime more heavily. It adjusts for the number of visitors and daily workers commuting into cities. (higher means more crime, U.S. average = 301.1)
Sex Offenders
According to our data, there are 3,447 registered sex offenders living in Detroit and 907 registered sex offenders living in . The ratio of residents to sex offenders in Detroit is 195 to 1; the ratio in Akron is 218 to 1. The number of registered sex offenders compared to the number of residents in Detroit is near to than in Akron.
Cost of Living
The cost of living in Detroit is generally lower than the national average, making it an attractive option for those seeking affordable urban living. This especially applies to housing, which is significantly less expensive than in many other American cities. By comparison, Akron has an even lower cost of living, with housing being particularly affordable.
Income Tax
Both cities impose a city income tax in addition to the state income tax. In Detroit, it's 2.4% for residents and 1.2% for non-residents; in Akron, it's 2.5% across the board.
Property Tax
Detroit's property taxes are among the highest in the country, while Akron's property taxes are more in line with the national average. For both cities, rates can vary depending on the neighborhood and the value of the property.
Sales Tax
Both Detroit and Akron have sales tax rates that align with their respective state rates. Michigan's state sales tax is 6%, while Ohio's is 5.75%.
Income
Type
Detroit
Akron
Estimated median household income
$36,140
$41,628
Estimated per capita income
$22,122
$25,307
Cost of living index (U.S. average is 100)
94.1
95.7
If you make $50,000 in Detroit, you will have to make $50,850 in Akron to maintain the same standard of living.
Geographical Conditions
Located in southeastern Michigan, Detroit is characterized by flat land and is known for its proximity to the Great Lakes. Meanwhile, Akron is in northeastern Ohio, in a region with more hilly terrain and fewer bodies of water.
Detroit's schools have struggled with performance and funding issues. However, it also hosts Wayne State University, a well-regarded research institution. Akron's school system includes some rated highly, and the University of Akron attracts students from all over the country.
After grappling with significant economic challenges, Detroit is recovering, with industries like technology and healthcare joining its traditional automotive industry. Conversely, Akron, known as the rubber capital of the world, leans towards manufacturing and healthcare.
Biggest Employers
Detroit's biggest employers include the Detroit Medical Center, Ford Motor Co., and General Motors. In Akron, major employers include the Cleveland Clinic Akron General, Summa Health System, and The Goodyear Tire & Rubber Co.
There were 10 building permits issued in Detroit in 2012 (8 less than in 2011) compared to 33 building permits issued in Akron in 2012.
In Detroit (Wayne County), 73.1% voted for Democrats and 26.2% for Republicans in 2012 Presidential Election. In Akron (Summit County), 57.3% voted for Democrats and 41.6% for Republicans.
Elections
Type
Democrats
Republicans
Other
Year
Detroit
Akron
Detroit
Akron
Detroit
Akron
2020
68.6%
53.9%
30.4%
44.4%
1.0%
1.7%
2016
66.6%
51.7%
29.4%
43.2%
4.0%
5.1%
2012
73.1%
57.3%
26.2%
41.6%
0.6%
1.1%
2008
74.4%
57.9%
24.7%
40.8%
0.9%
1.3%
2004
69.7%
56.9%
29.9%
43.1%
0.4%
0.0%
2000
69.1%
53.4%
29.1%
43.1%
1.8%
3.5%
1996
69.0%
52.1%
24.0%
34.2%
7.0%
13.8%
Breakdown of population affiliated with a religious congregation
Type
Adherents
Congregations
Religion
Detroit
Akron
Detroit
Akron
CATHOLIC CHURCH
16.3%
21.6%
11.2%
6.8%
MUSLIM ESTIMATE
3.7%
0.3%
2.9%
0.4%
AMERICAN BAPTIST CHURCHES IN THE USA
1.5%
0.4%
2.4%
1.6%
LUTHERAN CHURCH
1.2%
0.9%
3.9%
2.5%
EVANGELICAL LUTHERAN CHURCH IN AMERICA
0.7%
0.9%
2.8%
2.9%
EPISCOPAL CHURCH
0.4%
0.9%
2.5%
2.1%
SEVENTH DAY ADVENTIST CHURCH
0.4%
0.2%
1.4%
1.0%
SOUTHERN BAPTIST CONVENTION
0.4%
0.3%
3.2%
3.3%
Weather
Both Detroit and Akron experience a typical Midwestern climate: hot summers and cold winters with heavy snowfall. However, Detroit, being closer to the Great Lakes, tends to have slightly milder summers and more snowy winters than Akron.
Weather and climate
Type
Detroit
Akron
Temperature - Average
50°F
49.2°F
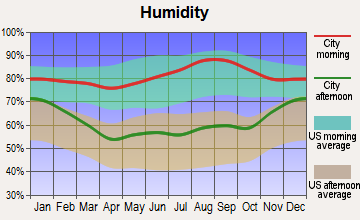
Humidity - Average morning or afternoon humidity
75.3%
76.7%
Humidity - Differences between morning and afternoon humidity
33%
32.8%
Humidity - Maximum monthly morning or afternoon humidity
86%
86.9%
Humidity - Minimum monthly morning or afternoon humidity
53%
54.1%
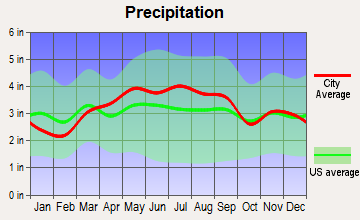
Precipitation - Yearly average
33.6 in
38.8 in
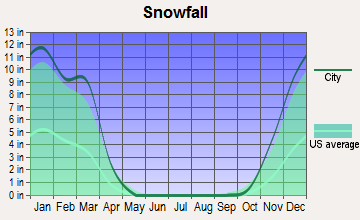
Snowfall - Yearly average
86.5 in
96.2 in
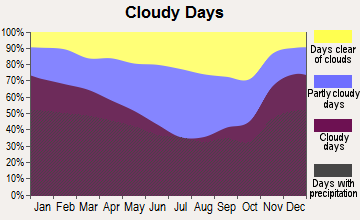
Clouds - Number of days clear of clouds
12.7%
11.2%
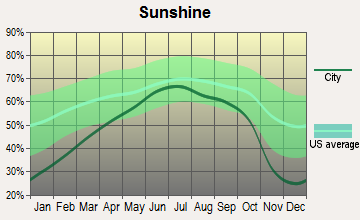
Sunshine amount - Average
56.8%
51.6%
Sunshine amount - Differences during a year
38%
43.6%
Sunshine amount - Maximum monthly
69%
65.7%
Sunshine amount - Minimum monthly
31%
22.1%
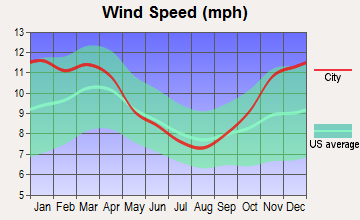
Wind speed - Average
10.2 mph
9.9 mph
Average climate in Detroit, Michigan
Average climate in Akron, Ohio
Air pollution
Type
AQI
CO
NO2
OZONE
PB
PM10
PM25
SO2
Year
Detroit
Akron
Detroit
Akron
Detroit
Detroit
Akron
Detroit
Akron
Detroit
Akron
Detroit
Akron
2018
90
78
0.44
0.18
12.9
N/A
25.8
29.5
N/A
N/A
N/A
N/A
10.1
9.0
1.1
0.1
2017
87
76
0.56
0.06
12.7
N/A
20.9
31.0
N/A
N/A
N/A
N/A
10.1
8.5
1.3
0.1
2016
86
80
0.47
0.10
13.2
N/A
22.0
27.1
N/A
N/A
N/A
N/A
10.9
10.3
0.8
0.3
2015
95
92
0.49
0.12
14.8
N/A
26.5
27.8
N/A
N/A
N/A
N/A
11.9
13.9
1.2
1.0
2014
95
59
0.48
0.13
14.2
N/A
24.2
26.2
N/A
N/A
N/A
N/A
12.0
7.4
1.7
2.2
2013
80
62
0.53
0.18
14.4
N/A
24.5
26.2
N/A
N/A
N/A
N/A
11.0
8.9
1.3
2.9
2012
99
90
0.49
0.13
14.6
N/A
25.7
30.4
N/A
N/A
N/A
N/A
6.6
12.9
1.7
2.7
2011
94
91
0.32
0.09
12.9
N/A
24.3
31.0
N/A
N/A
N/A
N/A
6.5
10.8
1.6
3.2
2010
96
112
0.28
0.16
11.8
N/A
24.7
32.0
0.006
N/A
N/A
N/A
12.1
15.3
1.6
2.5
2009
68
64
0.27
0.27
12.7
N/A
23.4
26.9
N/A
N/A
N/A
N/A
N/A
N/A
1.9
1.9
2008
67
71
0.27
0.31
12.8
N/A
N/A
33.6
N/A
N/A
N/A
N/A
N/A
N/A
2.0
2.8
2007
81
77
0.29
0.29
13.7
N/A
25.8
36.1
0.017
N/A
N/A
N/A
N/A
N/A
N/A
3.2
2006
63
64
0.31
0.42
14.0
N/A
19.8
30.9
0.022
N/A
N/A
N/A
N/A
N/A
3.2
4.2
2005
83
88
0.36
0.42
17.4
N/A
22.6
33.1
0.019
N/A
N/A
N/A
N/A
N/A
4.0
4.5
2004
70
74
0.43
0.41
15.0
N/A
N/A
27.1
0.014
N/A
20.4
N/A
N/A
N/A
3.7
4.7
2003
86
84
0.40
0.39
18.5
N/A
N/A
28.3
0.013
N/A
20.5
N/A
N/A
N/A
4.8
7.3
2002
88
91
0.36
0.47
18.3
N/A
N/A
32.0
0.019
N/A
20.9
N/A
N/A
N/A
4.3
8.4
2001
83
91
0.36
0.51
19.0
N/A
N/A
31.7
0.020
N/A
21.9
N/A
N/A
N/A
4.4
8.6
2000
71
78
0.35
0.59
18.2
N/A
N/A
29.7
0.027
N/A
21.5
N/A
N/A
N/A
5.2
8.0
Natural disasters
Type
Detroit
Akron
Tornado activity compared to U.S. average
128.5%
111.2%
Earthquake activity compared to U.S. average
53.2%
52.3%
Natural disasters compared to U.S. average
14%
11%
Transportation
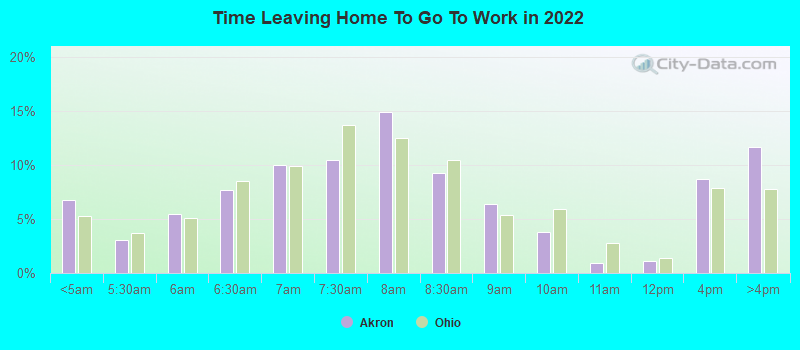
Detroit has a public transportation system consisting of buses and a light rail line, but many residents opt for driving. Akron also relies heavily on cars, with public transportation provided by the METRO RTA bus system.
Transport
Type
Detroit
Akron
Amtrak stations
1
1
Amtrak stations nearby
3
1
FAA registered aircraft
93
112
FAA registered aircraft manufacturers and dealers
3
10
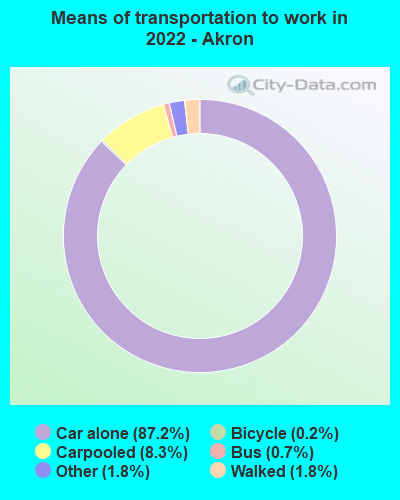
Means of transportation to work
Type
Detroit
Akron
Bicycle
0.5%
0.2%
Bus
4%
1.4%
Carpooled
7.5%
7.7%
Car alone
83.4%
87.7%
Railroad
0%
0.2%
Taxicab
0.5%
0.2%
Walked
2.7%
1.6%
Average travel time to work
Type
Detroit
Akron
Average
30.6 min
24.6 min
Other means
26 min
22 min
Public transportation
47.7 min
38 min
Private vehicle occupancy
Type
Detroit
Akron
Average
1.2
1.2
Drove alone
87.1%
85.4%
In 2 person carpool
10.5%
12.4%
In 3 person carpool
1%
0.9%
In 4 person carpool
1%
0.5%
In 5-6 person carpool
0.3%
0.6%
In 7+ person carpool
0.2%
0.2%
How many people usually rode to work in the car, truck or van.
Real Estate
Detroit's real estate market offers a broad range of prices and styles, from luxury condos downtown to historic single-family homes. Akron's real estate, meanwhile, is characterized by affordability, with a range of housing options to suit different lifestyles.
Neighborhoods
Detroit is known for its distinct neighborhoods like Greektown, Mexicantown, and Midtown, each offering unique cultures. Akron's neighborhoods like Highland Square, West Akron, and Chapel Hill are equally diverse and vibrant.
Houses and residents
Type
Detroit
Akron
Houses
322,906
93,546
Average household size (people)
2.6
2.3
Median year apartment built
1953
1960
Median year house/condo built
1946
1952
Length of stay in the house since moving in
16.7 years
15.6 years
Houses occupied
251,729 (78%)
84,914 (90.8%)
Houses occupied by owners
129,084 (51.3%)
42,714 (50.3%)
Houses occupied by renters
122,645 (48.7%)
42,200 (49.7%)
Median rent asked for vacant for-rent units
$798.06
$905.97
Median monthly housing costs
$755
$784
Median price asked for vacant for-sale houses and condos
$86,452
$81,314
Estimated median house or condo value
$69,300
$106,300
Median numbers of rooms
5.7
5.5
Median number of rooms in apartments
5
4.7
Median number of rooms in houses and condos
6.3
6.3
Median house price - detached houses
$96,752
$136,437
Median house price - in 2-unit structures
$72,631
$102,885
Median house price - in 3-to-4-unit structures
$183,952
$135,558
Median house price - in 5 or more unit structures
$242,851
$94,537
Median house price - mobile homes
$43,864
$44,110
Median house price - Townhouses or other attached units
$128,652
$181,576
Median house price - All housing units
$101,554
$137,428
Median house age
74
68
Renting percentage
48.9%
45.5%
Housing density (houses/condos per square mile)
2,326.9
1,507.1
House value disparities
48.4%
36.4%
Household income disparities
49.3%
45%
Median household income for houses/condes with a mortgage
$61,259
$71,904
Median household income for apartments without a mortgage
$38,901
$49,938
Housing units without a mortgage
2,599 (5.6%)
1,292 (4.8%)
Housing units with both a second mortgage and home equity loan
2,270 (4.9%)
2,419 (9%)
Housing units with a mortgage
43,675 (94.4%)
25,670 (95.2%)
Housing units with a home equity loan
357 (0.8%)
0 (0%)
Housing units with a second mortgage
3,466 (7.5%)
2,878 (10.7%)
House/condo owner moved in on average (years ago)
16
15
House/condo renter moved in on average (years ago)
4
3
Housing units lacking complete kitchen facilities
17.1%
3.6%
Housing units lacking complete plumbing facilities
13.6%
2.2%
Housing units in structures
Housing units in structures
Detroit
Akron
One, detached
66.0%
67.7%
One, attached
6.1%
3.0%
Two
6.5%
6.8%
3 or 4
2.7%
4.5%
5 to 9
2.2%
4.9%
10 to 19
2.7%
3.9%
20 to 49
3.9%
2.9%
50 or more
9.4%
6.1%
Mobile homes
0.5%
0.2%
Median real estate property taxes paid for housing units
Self-employed workers in own not incorporated business
11,725
3,686
State government workers
8,763
2,025
Unpaid family workers
441
196
Industries and Occupations
Detroit is synonymous with the automotive industry, but healthcare, technology, and renewable energy are growing sectors. Akron's economy revolves around manufacturing, education, healthcare, and the polymer industry.
Detroit's healthcare system is anchored by the Detroit Medical Center and several other large hospitals. Akron has several well-rated hospitals, such as the Cleveland Clinic Akron General and Akron Children's Hospital.
Health (county statistics)
Type
Detroit
Akron
General health status score of residents in this county from 1 (poor) to 5 (excellent)
HMDA - Conventional home purchase loans - Applications denied
Year
Detroit
Akron
1999
2,901
674
2000
4,079
857
2001
3,815
599
2002
3,247
414
2003
5,511
644
2004
9,068
816
2005
13,958
1,353
2006
16,654
1,286
2007
10,742
734
2008
2,823
280
2009
484
85
Culture and Food
Detroit boasts a rich cultural heritage, accentuated by institutions like the Detroit Institute of Arts and an eclectic food scene, reflecting its diverse community. Akron is known for its vibrant arts scene and food culture, famous for dishes like the Akron-style hamburger.
Sports Teams
Detroit is a major sports city, home to the Lions (NFL), Tigers (MLB), Pistons (NBA), and Red Wings (NHL). Akron doesn't have major league teams but is in proximity to Cleveland, home to the Browns (NFL), Cavaliers (NBA), and Indians (MLB).


 Detroit, MI
 Akron, OH