Detroit, Michigan, and Dayton, Ohio, are rustbelt cities with rich histories and distinct personalities. They both have strong industrial roots, however, their economy, infrastructure, and cultural scenes have diverged in recent years. While Detroit has witnessed a revival in tech and creative industries, Dayton has a diversified economy with manufacturing, health care, and retail taking the lead. This comparison will dig deeper into the aspects of crime/safety, weather, cost of living, education, work and economy, infrastructure, industries and occupations, biggest employers, real-estate, neighborhoods, transportation/public transit/commuting, taxing regime, culture/food, sports teams, geographical conditions, and health care in these cities to help perspective residents and tourists make an informed decision.
Distance between
Detroit, MI and
Dayton, OH : 190.1 miles
Detroit's population is larger by 360%. Its population has decreased by 318,806 people (33.5%) since 2000. The population of Dayton has decreased by 28,608 people (17.2%) during that time.
Crime rate is a concern in both cities. Detroit has been known for high crime rates, but the situation has been gradually improving over the years. The influx of new businesses and revitalization projects is pushing crime out of the city center. Dayton, on the other hand, has crime rates slightly lower than Detroit’s. Both cities are taking active steps to enhance security, though it would be wise for residents and tourists to stay informed and vigilant.
City-data.com crime index counts serious crimes and violent crime more heavily. It adjusts for the number of visitors and daily workers commuting into cities. (higher means more crime, U.S. average = 301.1)
City-data.com crime index counts serious crimes and violent crime more heavily. It adjusts for the number of visitors and daily workers commuting into cities. (higher means more crime, U.S. average = 301.1)
Sex Offenders
According to our data, there are 3,443 registered sex offenders living in Detroit and 987 registered sex offenders living in . The ratio of residents to sex offenders in Detroit is 195 to 1; the ratio in Dayton is 143 to 1. The number of registered sex offenders compared to the number of residents is a smaller in Detroit than in Dayton.
Cost of Living
The cost of living in both cities is below the national average. However, Dayton generally has a lower cost of living than Detroit. The major contributing factors to this include housing, food, and general consumer goods. It's therefore a good city for people looking to save on living costs.
Income Tax
Both cities impose a municipal income tax on residents, non-residents who work in the city, and businesses. Detroit has a 2.4% resident income tax rate and a non-resident rate of 1.2%. Dayton's resident income tax rate is 2.5%, and non-resident workers are taxed at the same rate.
Property Tax
Property tax rates in both cities are influenced by the local school district, county, and city tax levies. Detroit has one of the highest property tax rates in Michigan whereas Dayton's property tax rates are near the average for Ohio cities.
Sales Tax
Sales tax in Detroit is around 6%, while Dayton levies a slightly higher sales tax rate at approximately 7.5%.
Income
Type
Detroit
Dayton
Estimated median household income
$36,140
$39,315
Estimated per capita income
$22,122
$21,484
Cost of living index (U.S. average is 100)
94.1
93.4
If you make $50,000 in Dayton, you will have to make $50,375 in Detroit to maintain the same standard of living.
Geographical Conditions
Detroit is located on the Detroit River with access to the great lakes, making water-based recreation a unique advantage. Dayton is landlocked and located near several state parks offering opportunities for hiking and exploration.
Both cities have various educational opportunities. Major institutions in Detroit include Wayne State University and University of Detroit Mercy. Dayton is home to the University of Dayton and Sinclair Community College. Both cities have a mix of public, charter, and private schools for K-12 education.
The Detroit economy is primarily driven by manufacturing, technology, and health care with General Motors, Quicken Loans, and the Henry Ford Health System being significant employers. Dayton’s economy is a tad more diversified encompassing health care, education, and retail.
Biggest Employers
Detroit's largest employers are General Motors, the Henry Ford Health System, and Quicken Loans. On the other hand, Premier Health partners, Wright-Patterson Air Force Base, and Kettering Health Network are the major employers in Dayton.
There were 10 building permits issued in Detroit in 2012 (8 less than in 2011) compared to 14 building permits issued in Dayton in 2012 (76 less than in 2011).
In Detroit (Wayne County), 73.1% voted for Democrats and 26.2% for Republicans in 2012 Presidential Election. In Dayton (Montgomery County), 51.7% voted for Democrats and 47.1% for Republicans.
Elections
Type
Democrats
Republicans
Other
Year
Detroit
Dayton
Detroit
Dayton
Detroit
Dayton
2020
68.6%
50.3%
30.4%
48.1%
1.0%
1.6%
2016
66.6%
47.1%
29.4%
47.8%
4.0%
5.1%
2012
73.1%
51.7%
26.2%
47.1%
0.6%
1.3%
2008
74.4%
52.6%
24.7%
46.4%
0.9%
1.0%
2004
69.7%
50.8%
29.9%
49.2%
0.4%
0.0%
2000
69.1%
49.7%
29.1%
47.6%
1.8%
2.7%
1996
69.0%
50.0%
24.0%
41.3%
7.0%
8.7%
Breakdown of population affiliated with a religious congregation
Type
Adherents
Congregations
Religion
Detroit
Dayton
Detroit
Dayton
CATHOLIC CHURCH
16.3%
14.7%
11.2%
5.8%
MUSLIM ESTIMATE
3.7%
0.3%
2.9%
0.7%
AMERICAN BAPTIST CHURCHES IN THE USA
1.5%
2.0%
2.4%
2.4%
LUTHERAN CHURCH
1.2%
0.3%
3.9%
0.9%
EVANGELICAL LUTHERAN CHURCH IN AMERICA
0.7%
1.8%
2.8%
5.0%
EPISCOPAL CHURCH
0.4%
0.5%
2.5%
1.0%
SEVENTH DAY ADVENTIST CHURCH
0.4%
0.7%
1.4%
1.7%
SOUTHERN BAPTIST CONVENTION
0.4%
4.6%
3.2%
10.3%
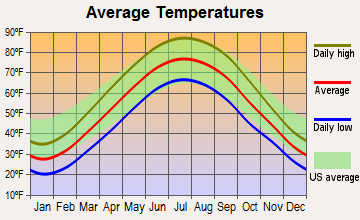
Weather
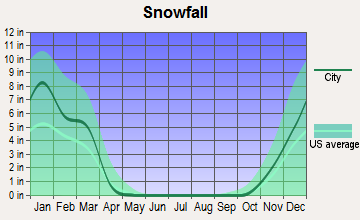
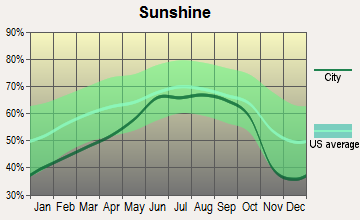
In terms of weather, both cities experience a typical Midwestern climate — hot summers, cold winters, and moderate fall and spring. Detroit, being on the border of Canada, can have colder and snowier winters compared to Dayton. Dayton tends to have more humid summers
Weather and climate
Type
Detroit
Dayton
Temperature - Average
50°F
53.5°F
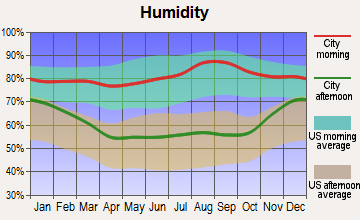
Humidity - Average morning or afternoon humidity
75.3%
76%
Humidity - Differences between morning and afternoon humidity
33%
32%
Humidity - Maximum monthly morning or afternoon humidity
86%
86%
Humidity - Minimum monthly morning or afternoon humidity
53%
54%
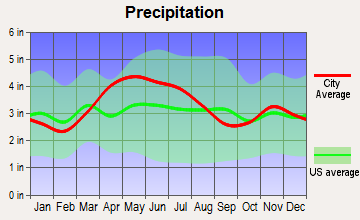
Precipitation - Yearly average
33.6 in
39.4 in
Snowfall - Yearly average
86.5 in
54.8 in
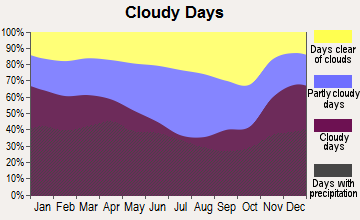
Clouds - Number of days clear of clouds
12.7%
12.7%
Sunshine amount - Average
56.8%
57.7%
Sunshine amount - Differences during a year
38%
35%
Sunshine amount - Maximum monthly
69%
68%
Sunshine amount - Minimum monthly
31%
33%
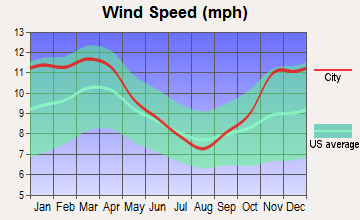
Wind speed - Average
10.2 mph
10.2 mph
Average climate in Detroit, Michigan
Average climate in Dayton, Ohio
Air pollution
Type
AQI
CO
NO2
OZONE
PB
PM25
SO2
Year
Detroit
Dayton
Detroit
Dayton
Detroit
Detroit
Dayton
Detroit
Detroit
Dayton
Detroit
Dayton
2018
90
86
0.44
N/A
12.9
N/A
25.8
31.7
N/A
N/A
10.1
9.0
1.1
0.1
2017
87
81
0.56
N/A
12.7
N/A
20.9
31.7
N/A
N/A
10.1
8.2
1.3
0.2
2016
86
85
0.47
N/A
13.2
N/A
22.0
31.7
N/A
N/A
10.9
8.0
0.8
0.2
2015
95
90
0.49
N/A
14.8
N/A
26.5
30.3
N/A
N/A
11.9
9.3
1.2
0.4
2014
95
90
0.48
N/A
14.2
N/A
24.2
31.0
N/A
N/A
12.0
11.8
1.7
0.7
2013
80
91
0.53
N/A
14.4
N/A
24.5
31.0
N/A
N/A
11.0
11.2
1.3
0.6
2012
99
96
0.49
N/A
14.6
N/A
25.7
35.0
N/A
N/A
6.6
11.3
1.7
2.3
2011
94
100
0.32
N/A
12.9
N/A
24.3
33.5
N/A
N/A
6.5
12.4
1.6
1.2
2010
96
104
0.28
0.30
11.8
N/A
24.7
34.5
0.006
N/A
12.1
12.7
1.6
1.4
2009
68
56
0.27
0.41
12.7
N/A
23.4
31.1
N/A
N/A
N/A
N/A
1.9
2.5
2008
67
68
0.27
0.28
12.8
N/A
N/A
33.4
N/A
N/A
N/A
N/A
2.0
2.1
2007
81
87
0.29
0.37
13.7
N/A
25.8
28.7
0.017
N/A
N/A
N/A
N/A
2.5
2006
63
69
0.31
0.33
14.0
N/A
19.8
25.7
0.022
N/A
N/A
N/A
3.2
2.9
2005
83
88
0.36
0.40
17.4
N/A
22.6
27.9
0.019
N/A
N/A
N/A
4.0
4.1
2004
70
73
0.43
0.40
15.0
N/A
N/A
24.0
0.014
N/A
N/A
N/A
3.7
4.8
2003
86
83
0.40
0.34
18.5
N/A
N/A
29.8
0.013
N/A
N/A
N/A
4.8
4.6
2002
88
94
0.36
0.36
18.3
N/A
N/A
30.7
0.019
N/A
N/A
N/A
4.3
5.1
2001
83
84
0.36
0.36
19.0
N/A
N/A
30.4
0.020
N/A
N/A
N/A
4.4
4.3
2000
71
79
0.35
0.38
18.2
N/A
N/A
28.4
0.027
N/A
N/A
N/A
5.2
4.8
Natural disasters
Type
Detroit
Dayton
Tornado activity compared to U.S. average
128.5%
159.3%
Earthquake activity compared to U.S. average
53.2%
126.1%
Natural disasters compared to U.S. average
14%
9%
Transportation
Detroit has made strides in public transportation with the introduction of the QLine Streetcar in addition to regular bus services. Dayton relies heavily on bus services operated by the Greater Dayton Regional Transit Authority. Both cities have extensive highway systems for commuters.
Transport
Type
Detroit
Dayton
Amtrak stations
1
0
Amtrak stations nearby
3
0
FAA registered aircraft
93
219
FAA registered aircraft manufacturers and dealers
3
2
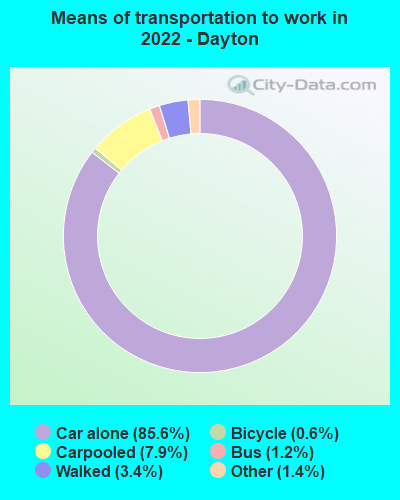
Means of transportation to work
Type
Detroit
Dayton
Bicycle
0.5%
0.3%
Bus
4%
2%
Carpooled
7.5%
7.8%
Car alone
83.4%
85%
Taxicab
0.5%
0.1%
Walked
2.7%
4.2%
Average travel time to work
Type
Detroit
Dayton
Average
30.6 min
24.6 min
Other means
26 min
20.3 min
Public transportation
47.7 min
39.6 min
Private vehicle occupancy
Type
Detroit
Dayton
Average
1.2
1.2
Drove alone
87.1%
87.7%
In 2 person carpool
10.5%
9.1%
In 3 person carpool
1%
2.2%
In 4 person carpool
1%
0.4%
In 5-6 person carpool
0.3%
0.1%
In 7+ person carpool
0.2%
0.1%
How many people usually rode to work in the car, truck or van.
Real Estate
Real estate in Detroit is diverse, offering everything from iconic Art Deco apartments downtown to classic suburban homes. Real estate in Dayton tends to be more affordable, particularly for buyers interested in historic homes, given its focus on historical preservation.
Neighborhoods
Each city boasts a variety of neighborhoods to suit differing lifestyles. Detroit's revitalized downtown and hipster-friendly Midtown areas are growing in popularity. Dayton's Oregon District offers a historic charm, while Beavercreek is appreciated for its suburban peace.
Houses and residents
Type
Detroit
Dayton
Houses
322,906
68,591
Average household size (people)
2.6
2.3
Median year apartment built
1953
1961
Median year house/condo built
1946
1948
Length of stay in the house since moving in
16.7 years
14.9 years
Houses occupied
251,729 (78%)
55,114 (80.4%)
Houses occupied by owners
129,084 (51.3%)
27,278 (49.5%)
Houses occupied by renters
122,645 (48.7%)
27,836 (50.5%)
Median rent asked for vacant for-rent units
$798.06
$788.54
Median monthly housing costs
$755
$767
Median price asked for vacant for-sale houses and condos
$86,452
$98,251
Estimated median house or condo value
$69,300
$85,000
Median numbers of rooms
5.7
5.4
Median number of rooms in apartments
5
4.5
Median number of rooms in houses and condos
6.3
6.1
Median house price - detached houses
$96,752
$107,391
Median house price - in 2-unit structures
$72,631
$159,715
Median house price - in 3-to-4-unit structures
$183,952
$125,606
Median house price - in 5 or more unit structures
$242,851
$173,031
Median house price - mobile homes
$43,864
$16,958
Median house price - Townhouses or other attached units
$128,652
$144,941
Median house price - All housing units
$101,554
$108,592
Median house age
74
69
Renting percentage
48.9%
50.1%
Housing density (houses/condos per square mile)
2,326.9
1,229.7
House value disparities
48.4%
36.9%
Household income disparities
49.3%
45.2%
Median household income for houses/condes with a mortgage
$61,259
$61,739
Median household income for apartments without a mortgage
$38,901
$43,720
Housing units without a mortgage
2,599 (5.6%)
788 (4.7%)
Housing units with both a second mortgage and home equity loan
2,270 (4.9%)
655 (3.9%)
Housing units with a mortgage
43,675 (94.4%)
15,851 (95.3%)
Housing units with a home equity loan
357 (0.8%)
0 (0%)
Housing units with a second mortgage
3,466 (7.5%)
1,194 (7.2%)
House/condo owner moved in on average (years ago)
16
14
House/condo renter moved in on average (years ago)
4
3
Housing units lacking complete kitchen facilities
17.1%
7.6%
Housing units lacking complete plumbing facilities
13.6%
9.1%
Housing units in structures
Housing units in structures
Detroit
Dayton
One, detached
66.0%
63.7%
One, attached
6.1%
6.2%
Two
6.5%
4.0%
3 or 4
2.7%
5.2%
5 to 9
2.2%
5.1%
10 to 19
2.7%
4.2%
20 to 49
3.9%
3.3%
50 or more
9.4%
6.7%
Mobile homes
0.5%
1.3%
Boats, RVs, vans, etc.
0.0%
0.2%
Median real estate property taxes paid for housing units
Self-employed workers in own not incorporated business
11,725
1,462
State government workers
8,763
516
Unpaid family workers
441
20
Industries and Occupations
In Detroit, the dominant industries are automotive, health care, and technology, providing numerous high-skilled jobs. In Dayton, health care, education, and retail industries take the lead, offering both skilled and unskilled jobs.
Detroit is home to big health care providers like the Henry Ford Health System and the Detroit Medical Center. Dayton has Premier Health, Kettering Health Network, and multiple VA medical centers—implying both cities have well-established health care systems.
Health (county statistics)
Type
Detroit
Dayton
General health status score of residents in this county from 1 (poor) to 5 (excellent)
Detroit's infrastructure has seen significant improvements in the last decade due to revitalization efforts. New apartments, office buildings, and an upgraded public transit system featuring the QLine Streetcar mark the cityscape now. In contrast, Dayton's infrastructure has remained relatively consistent with an emphasis on preserving historical architecture.
Infrastructure
Type
Detroit
Dayton
Hospitals
41
13
TV stations
16
13
Arenas or stadiums
4
2
Bank branches located here
98
76
Bank institutions located here
12
14
Main business address for public companies
11
12
Drinking water stations with no reported violations in the past
5
1
Drinking water stations with reported violations in the past
HMDA - Conventional home purchase loans - Applications denied
Year
Detroit
Dayton
1999
2,901
699
2000
4,079
874
2001
3,815
746
2002
3,247
569
2003
5,511
711
2004
9,068
774
2005
13,958
958
2006
16,654
966
2007
10,742
628
2008
2,823
180
2009
484
53
Culture and Food
Detroit boasts a rich cultural scene with the Detroit Institute of Arts and Motown Museum. In contrast, Dayton is known for Aviation history with the National Museum of the US Air Force. Both cities have diverse food scenes reflective of their multicultural populations.
Sports Teams
Detroit is a coveted city for sports fans, being home to the Detroit Red Wings, Lions, Tigers, and Pistons. Dayton, while not having any major league teams, is a center for Minor league and college sports.


 Detroit, MI
 Dayton, OH