East San Gabriel Valley, CA, and Henderson, NV, offer unique advantages with potential for high-quality living. Given their close locations to major cities, both provide ample opportunities for tourism, work, and lifestyle choices. To provide a comprehensive comparison, we will delve into specific aspects of life such as crime and safety, weather, cost of living, and many others, thus allowing for informed decisions for those considering relocation or casual tourism.
East San Gabriel Valley, relative to other California cities, has a somewhat higher crime rate. However, it is crucial to note that it is mostly property crime, with violent crimes being less frequent. On the other hand, Henderson, NV, has a much lower crime rate, priding itself on being one of the safest cities in the US.
Cost of Living
Living in East San Gabriel Valley is significantly more expensive compared to Henderson. Housing and everyday expenses are generally higher due to California's generally high cost of living. In comparison, Henderson's cost of living is lower and more affordable for families and retirees.
Income Tax
A significant difference comes in the state income taxes. California does levy a state income tax, while Nevada does not have a state income tax, which can be a crucial deciding factor.
Property Tax
Property taxes in Henderson, NV, are generally lower than in East San Gabriel Valley. However, it is important to note that California does have a homeowner's exemption that can provide some property tax relief.
Sales Tax
California’s statewide sales tax is 7.25%, with additional local taxes pushing the total sales tax rate in East San Gabriel Valley to around 9–10%. Nevada has a statewide sales tax of 4.6%, and with local surtaxes, the total sales tax rate in Henderson is around 8.38%.
Income
Type
East San Gabriel Valley
Henderson
Estimated median household income
$95,242
$77,924
Estimated per capita income
$34,474
$41,771
Cost of living index (U.S. average is 100)
150.2
99.2
If you make $50,000 in Henderson, you will have to make $75,706 in East San Gabriel Valley to maintain the same standard of living.
Geographical Conditions
Geographically, East San Gabriel Valley is characterized by a coastal and mountainous terrain while Henderson is situated in the Mojave Desert, surrounded by mountain ranges.
Geographical information
Type
East San Gabriel Valley
Henderson
Land area
212.6 sq. miles
79.7 sq. miles
Population density
4,478.5 people per sq. mile
4,043 people per sq. mile
Relative area comparison
East San Gabriel Valley, CA Henderson, NV
Education
Both regions offer an excellent education system, with East San Gabriel Valley being home to renowned institutions like the University of California. Henderson, too, offers excellent education options, with institutions like Nevada State College offering quality education.
East San Gabriel Valley hosts a robust economy with job opportunities mostly in healthcare and education. Henderson's work and economy landscape is dominated by the gaming, leisure, and hospitality industries due to its proximity to Las Vegas.
Biggest Employers
The biggest employers in East San Gabriel Valley are schools, colleges, and healthcare facilities. In contrast, Henderson's economy is heavily influenced by the gaming industry, with large casinos and resorts being significant employers.
In East San Gabriel Valley (Los Angeles County), 69.7% voted for Democrats and 27.8% for Republicans in 2012 Presidential Election. In Henderson (Clark County), 56.4% voted for Democrats and 41.8% for Republicans.
Elections
Type
Democrats
Republicans
Other
Year
East San Gabriel Valley
Henderson
East San Gabriel Valley
Henderson
East San Gabriel Valley
Henderson
2020
71.0%
53.7%
26.9%
44.3%
2.1%
2.0%
2016
72.0%
52.4%
22.5%
41.7%
5.5%
5.8%
2012
69.7%
56.4%
27.8%
41.8%
2.4%
1.8%
2008
69.2%
58.5%
28.8%
39.5%
1.9%
2.0%
2004
63.3%
51.8%
35.7%
46.9%
1.0%
1.3%
2000
63.6%
51.4%
32.4%
44.8%
4.0%
3.8%
1996
59.3%
75.5%
31.0%
18.8%
9.7%
5.7%
Breakdown of population affiliated with a religious congregation
Type
Adherents
Congregations
Religion
East San Gabriel Valley
Henderson
East San Gabriel Valley
Henderson
CATHOLIC CHURCH
36.1%
18.1%
4.7%
4.0%
SOUTHERN BAPTIST CONVENTION
1.0%
1.6%
9.0%
11.2%
MUSLIM ESTIMATE
0.7%
0.1%
1.0%
0.6%
AMERICAN BAPTIST CHURCHES IN THE USA
0.5%
0.2%
3.1%
1.4%
SEVENTH DAY ADVENTIST CHURCH
0.5%
0.2%
2.4%
1.6%
EPISCOPAL CHURCH
0.4%
0.1%
1.4%
1.1%
EVANGELICAL LUTHERAN CHURCH IN AMERICA
0.2%
0.4%
1.9%
1.6%
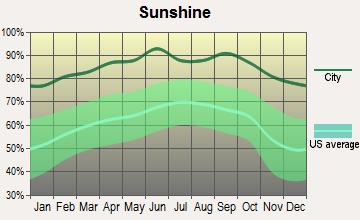
Weather
East San Gabriel Valley experiences moderate weather, with warm summers and mild winters typical of Southern California. Henderson, on the contrary, is characterized by a desert climate, leading to very hot summers and mild to cool winters.
Weather and climate
Type
East San Gabriel Valley
Henderson
Temperature - Average
62.7°F
67.8°F
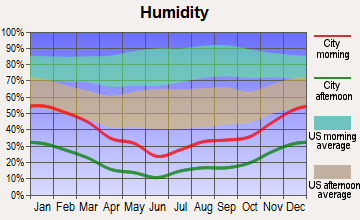
Humidity - Average morning or afternoon humidity
64.7%
30.7%
Humidity - Differences between morning and afternoon humidity
19.6%
42%
Humidity - Maximum monthly morning or afternoon humidity
70.7%
52%
Humidity - Minimum monthly morning or afternoon humidity
51%
10%
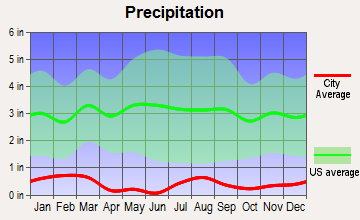
Precipitation - Yearly average
19.1 in
5.1 in
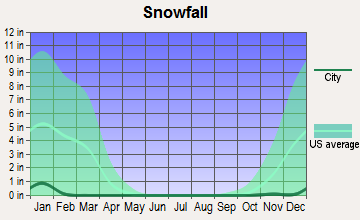
Snowfall - Yearly average
0 in
1.6 in
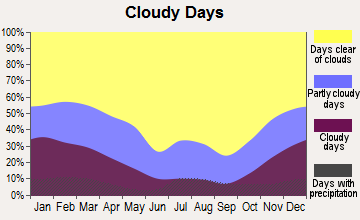
Clouds - Number of days clear of clouds
28.3%
35.1%
Sunshine amount - Average
78.4%
91.8%
Sunshine amount - Differences during a year
22%
16%
Sunshine amount - Maximum monthly
85%
92%
Sunshine amount - Minimum monthly
63%
76%
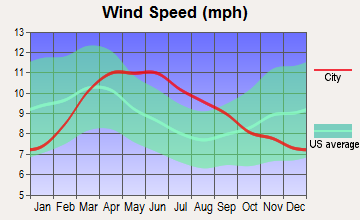
Wind speed - Average
3.7 mph
9.2 mph
Average climate in East San Gabriel Valley, California
Average climate in Henderson, Nevada
Air pollution
Type
AQI
CO
NO2
OZONE
PB
PM10
PM25
SO2
Year
East San Gabriel Valley
Henderson
East San Gabriel Valley
Henderson
East San Gabriel Valley
Henderson
East San Gabriel Valley
Henderson
East San Gabriel Valley
East San Gabriel Valley
Henderson
East San Gabriel Valley
Henderson
East San Gabriel Valley
Henderson
2018
143
99
0.36
0.42
14.1
15.3
29.2
35.1
0.007
N/A
29.6
27.9
13.4
6.1
0.3
0.7
2017
150
89
0.35
0.34
14.8
15.5
30.5
33.9
0.007
N/A
32.7
22.1
12.6
6.7
0.3
0.8
2016
141
91
0.31
0.39
15.5
13.4
29.3
32.3
0.007
N/A
30.3
22.5
12.0
7.5
0.3
0.8
2015
145
87
0.30
0.39
15.2
14.2
30.4
32.5
0.007
N/A
30.0
20.4
14.6
7.8
0.2
1.2
2014
142
88
0.32
0.43
16.8
12.4
29.7
31.3
0.008
N/A
33.6
23.1
11.7
8.2
0.3
1.4
2013
147
95
0.33
0.43
17.0
12.1
27.7
32.0
0.007
N/A
31.5
22.8
11.5
6.7
0.4
1.5
2012
149
96
0.39
0.47
18.3
6.4
27.5
36.0
0.005
N/A
30.9
23.8
15.6
7.0
0.6
1.4
2011
149
84
0.40
0.45
18.6
5.3
26.7
34.8
0.008
N/A
30.3
17.8
17.3
6.2
0.5
1.2
2010
139
81
0.44
0.50
19.3
5.7
26.8
32.9
N/A
N/A
26.6
16.2
14.8
5.6
0.4
N/A
2009
156
83
0.40
0.58
21.0
6.0
28.0
31.5
0.010
N/A
26.0
21.2
16.5
6.6
0.6
N/A
2008
156
81
0.48
0.64
22.7
8.2
27.7
31.6
0.012
N/A
27.0
N/A
15.1
6.4
1.0
N/A
2007
135
96
0.52
0.54
25.3
15.2
24.8
32.7
0.014
N/A
N/A
N/A
N/A
5.6
1.3
0.1
2006
128
102
0.55
0.71
25.1
17.0
24.0
31.8
0.009
N/A
N/A
N/A
N/A
6.2
1.9
0.8
2005
127
99
0.59
0.69
25.7
18.2
22.8
30.0
0.014
N/A
N/A
N/A
N/A
6.3
1.9
5.3
2004
132
86
0.68
0.67
25.4
18.1
24.6
31.9
0.016
N/A
N/A
N/A
N/A
N/A
1.7
1.6
2003
137
98
0.80
0.51
29.9
17.3
24.7
30.2
0.021
N/A
N/A
N/A
N/A
N/A
1.4
0.9
2002
134
92
0.83
0.16
31.4
14.5
23.1
31.0
0.021
N/A
N/A
N/A
N/A
N/A
2.0
0.5
2001
141
94
1.00
0.22
31.8
15.0
21.4
30.5
0.029
N/A
N/A
N/A
N/A
N/A
2.1
0.9
2000
150
94
1.05
0.22
34.7
15.1
20.7
29.9
0.027
N/A
N/A
N/A
N/A
N/A
2.0
0.4
Natural disasters
Type
East San Gabriel Valley
Henderson
Tornado activity compared to U.S. average
18.5%
2.4%
Earthquake activity compared to U.S. average
7,292.4%
5,903.3%
Natural disasters compared to U.S. average
57%
12%
Transportation
East San Gabriel Valley's public transit system is substantial, with buses and light rail serving most areas. Conversely, public transportation in Henderson isn't as optimized as East San Gabriel Valley. This factor accentuates the importance of personal vehicles for commuting in Henderson.
Transport
Type
East San Gabriel Valley
Henderson
Amtrak stations nearby
3
1
FAA registered aircraft
0
469
FAA registered aircraft manufacturers and dealers
0
31
Means of transportation to work
Type
East San Gabriel Valley
Henderson
Bicycle
0.6%
0.1%
Bus
2.9%
1%
Carpooled
17.1%
12.1%
Car alone
73.3%
82.2%
Motorcycle
0.2%
0.3%
Railroad
0.6%
0%
Walked
2.2%
1.3%
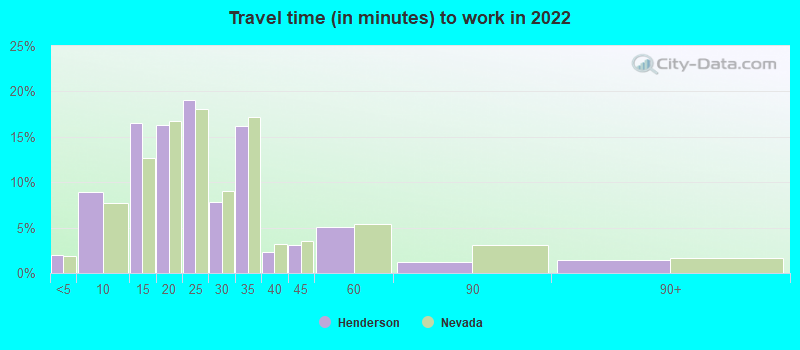
Average travel time to work
Type
East San Gabriel Valley
Henderson
Average
32.3 min
24.1 min
Real Estate
Real estate prices in East San Gabriel Valley are notoriously high, compared to Henderson's market where homes are relatively affordable with several new developments.
Neighborhoods
Neighborhoods in both regions offer unique charm and appeal. East San Gabriel Valley is known for its diverse, family-friendly neighborhoods. Henderson’s neighborhoods are recognized for their safety, with many gated communities and plush golf course areas.
Houses and residents
Type
East San Gabriel Valley
Henderson
Houses
270,240
132,088
Average household size (people)
3.5
2.5
Houses occupied
263,338 (97.4%)
124,470 (94.2%)
Houses occupied by owners
180,683 (68.6%)
80,562 (64.7%)
Houses occupied by renters
82,655 (31.4%)
43,908 (35.3%)
Median rent asked for vacant for-rent units
$1,935
$1,561
Median price asked for vacant for-sale houses and condos
$1,138,428
$213,031
Estimated median house or condo value
$643,048
$421,300
Median number of rooms in apartments
3.7
4.3
Median number of rooms in houses and condos
5.9
6.2
Renting percentage
32.3%
34.2%
Housing density (houses/condos per square mile)
1,270.8
1,657.6
Household income disparities
40.3%
42.4%
Housing units without a mortgage
26,635 (16.4%)
682 (1.2%)
Housing units with both a second mortgage and home equity loan
515 (0.3%)
2,162 (3.8%)
Housing units with a mortgage
136,243 (83.6%)
55,593 (98.8%)
Housing units with a home equity loan
11,429 (7%)
74 (0.1%)
Housing units with a second mortgage
21,150 (13%)
3,197 (5.7%)
Housing units lacking complete kitchen facilities
1%
1.6%
Housing units lacking complete plumbing facilities
Self-employed workers in own not incorporated business
25,753
9,395
State government workers
13,845
3,866
Unpaid family workers
1,494
217
Industries and Occupations
A variety of industries thrive in East San Gabriel Valley, with the education, health services, and social assistance sectors taking the lead. Conversely, in Henderson, the dominant industries are tourism, gaming, and leisure, although there's a developing tech industry too.
Both regions have excellent healthcare systems. East San Gabriel Valley is home to several highly ranked hospitals, while Henderson boasts state-of-the-art healthcare facilities, especially for senior care.
Health (county statistics)
Type
East San Gabriel Valley
Henderson
General health status score of residents in this county from 1 (poor) to 5 (excellent)
Both regions offer well-developed infrastructure, but with different focus points. In East San Gabriel Valley, there is a concentration on educational and health facilities. Henderson focuses more on developing hospitality and entertainment infrastructure.
Infrastructure
Type
East San Gabriel Valley
Henderson
TV stations
24
20
Culture and Food
East San Gabriel Valley offers a rich cultural scene with its significant Asian influence, which is evident in the food and festivals. Henderson, close to the entertainment capital, Las Vegas, offers a vibrant mix of cultures, restaurants and world-class entertainment.
Sports Teams
While East San Gabriel Valley doesn’t have its own sports teams, Los Angeles teams are just a short drive away. Henderson is home to the Las Vegas Raiders practice facility and headquarters and is adjacent to Las Vegas, which hosts numerous sports events.
 East San Gabriel Valley, CA
 Henderson, NV