East San Gabriel Valley, CA vs North Las Vegas, NV
Comparing the East San Gabriel Valley in California and North Las Vegas, Nevada, involves considering various aspects of life. These two regions, while in relatively close proximity, offer diverse experiences with their unique crime rates, weather patterns, cost of living, education systems, economies, and more. This expansive comparison sheds light on the crucial factors to consider when deciding to move or visit either of these vibrant areas.
In terms of safety, both areas have their challenges. East San Gabriel Valley generally has lower crime rates than North Las Vegas. However, certain neighborhoods, particularly in larger cities like Pomona, have higher crime rates. North Las Vegas, by comparison, has relatively high crime rates, especially violent crimes. However, some neighborhoods are safer than others, and the city is investing heavily in policing and community safety initiatives.
Cost of Living
The cost of living in East San Gabriel Valley is considerably higher than North Las Vegas. This is partly due to California's high housing costs, taxes, and general living expenses. North Las Vegas, part of Nevada, has a lower cost of living which includes cheaper housing costs and lower taxes.
Income Tax
Another important distinction between these two locations is income tax. California has a progressive income tax, which can be high for larger incomes, while Nevada has no state income tax, which appeals to many seeking to relocate.
Property Tax
Although property values are higher in East San Gabriel Valley, California's property tax rates are generally lower than Nevada's, somewhat offsetting the cost. The property tax rate in North Las Vegas, however, is higher.
Sales Tax
California's state sales tax is higher than Nevada's, impacting the cost of goods in East San Gabriel Valley. North Las Vegas residents benefit from a lower state sales tax.
Income
Type
East San Gabriel Valley
North Las Vegas
Estimated median household income
$95,242
$67,035
Estimated per capita income
$34,474
$26,498
Cost of living index (U.S. average is 100)
150.2
98.3
If you make $50,000 in North Las Vegas, you will have to make $76,399 in East San Gabriel Valley to maintain the same standard of living.
Geographical Conditions
Geographically, East San Gabriel Valley is located in a terrain marked by plains and nearby mountains. In comparison, North Las Vegas is situated in a desert valley surrounded by mountains.
Geographical information
Type
East San Gabriel Valley
North Las Vegas
Land area
212.6 sq. miles
78.5 sq. miles
Population density
4,478.5 people per sq. mile
3,491.7 people per sq. mile
Relative area comparison
East San Gabriel Valley, CA North Las Vegas, NV
Education
In terms of education, both areas offer a variety of schools. East San Gabriel Valley is known for its high-achieving schools, especially in cities like Walnut and Diamond Bar. North Las Vegas also has good schools, but the Clark County School District, which includes North Las Vegas, struggles with overcrowded classrooms and below-average test scores.
The economies of East San Gabriel Valley and North Las Vegas are fundamentally different. The East San Gabriel Valley has a diverse economy, with strong sectors in healthcare, education, and retail. North Las Vegas, meanwhile, relies heavily on the entertainment and hospitality industries, though it also has a growing technology sector.
Biggest Employers
In the East San Gabriel Valley, some of the largest employers are healthcare providers like Kaiser Permanente and Citrus Valley Health Partners. In North Las Vegas, the biggest employers are typically in the hospitality and gaming industries, such as the Las Vegas Sands Corporation and MGM International.
In East San Gabriel Valley (Los Angeles County), 69.7% voted for Democrats and 27.8% for Republicans in 2012 Presidential Election. In North Las Vegas (Clark County), 56.4% voted for Democrats and 41.8% for Republicans.
Elections
Type
Democrats
Republicans
Other
Year
East San Gabriel Valley
North Las Vegas
East San Gabriel Valley
North Las Vegas
East San Gabriel Valley
North Las Vegas
2020
71.0%
53.7%
26.9%
44.3%
2.1%
2.0%
2016
72.0%
52.4%
22.5%
41.7%
5.5%
5.8%
2012
69.7%
56.4%
27.8%
41.8%
2.4%
1.8%
2008
69.2%
58.5%
28.8%
39.5%
1.9%
2.0%
2004
63.3%
51.8%
35.7%
46.9%
1.0%
1.3%
2000
63.6%
51.4%
32.4%
44.8%
4.0%
3.8%
1996
59.3%
75.5%
31.0%
18.8%
9.7%
5.7%
Breakdown of population affiliated with a religious congregation
Type
Adherents
Congregations
Religion
East San Gabriel Valley
North Las Vegas
East San Gabriel Valley
North Las Vegas
CATHOLIC CHURCH
36.1%
18.1%
4.7%
4.0%
SOUTHERN BAPTIST CONVENTION
1.0%
1.6%
9.0%
11.2%
MUSLIM ESTIMATE
0.7%
0.1%
1.0%
0.6%
AMERICAN BAPTIST CHURCHES IN THE USA
0.5%
0.2%
3.1%
1.4%
SEVENTH DAY ADVENTIST CHURCH
0.5%
0.2%
2.4%
1.6%
EPISCOPAL CHURCH
0.4%
0.1%
1.4%
1.1%
EVANGELICAL LUTHERAN CHURCH IN AMERICA
0.2%
0.4%
1.9%
1.6%
Weather
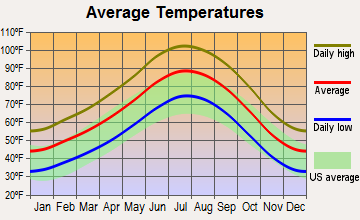
The weather varies significantly between the two areas. East San Gabriel Valley has a Mediterranean climate with mild, wet winters and hot, dry summers. On the other hand, North Las Vegas experiences a desert climate, marked by hot summers and mild winters. This makes for good year-round weather for outdoor activities in North Las Vegas, while East San Gabriel Valley can be more comfortable in the cooler months.
Weather and climate
Type
East San Gabriel Valley
North Las Vegas
Temperature - Average
62.7°F
65.8°F
Humidity - Average morning or afternoon humidity
64.7%
30.7%
Humidity - Differences between morning and afternoon humidity
19.6%
42%
Humidity - Maximum monthly morning or afternoon humidity
70.7%
52%
Humidity - Minimum monthly morning or afternoon humidity
51%
10%
Precipitation - Yearly average
19.1 in
5.4 in
Snowfall - Yearly average
0 in
1.6 in
Clouds - Number of days clear of clouds
28.3%
35.1%
Sunshine amount - Average
78.4%
91.8%
Sunshine amount - Differences during a year
22%
16%
Sunshine amount - Maximum monthly
85%
92%
Sunshine amount - Minimum monthly
63%
76%
Wind speed - Average
3.7 mph
9.2 mph
Average climate in East San Gabriel Valley, California
Average climate in North Las Vegas, Nevada
Air pollution
Type
AQI
CO
NO2
OZONE
PB
PM10
PM25
SO2
Year
East San Gabriel Valley
North Las Vegas
East San Gabriel Valley
North Las Vegas
East San Gabriel Valley
North Las Vegas
East San Gabriel Valley
North Las Vegas
East San Gabriel Valley
East San Gabriel Valley
North Las Vegas
East San Gabriel Valley
North Las Vegas
East San Gabriel Valley
North Las Vegas
2018
143
100
0.36
0.42
14.1
14.2
29.2
35.4
0.007
N/A
29.6
27.7
13.4
7.2
0.3
0.7
2017
150
101
0.35
0.26
14.8
14.2
30.5
29.9
0.007
N/A
32.7
22.2
12.6
8.6
0.3
0.8
2016
141
93
0.31
0.37
15.5
11.9
29.3
28.4
0.007
N/A
30.3
22.8
12.0
10.2
0.3
0.8
2015
145
92
0.30
0.34
15.2
13.0
30.4
28.2
0.007
N/A
30.0
21.2
14.6
9.3
0.2
1.2
2014
142
91
0.32
0.37
16.8
11.3
29.7
27.8
0.008
N/A
33.6
23.8
11.7
10.1
0.3
1.4
2013
147
103
0.33
0.48
17.0
10.4
27.7
28.4
0.007
N/A
31.5
24.4
11.5
9.5
0.4
1.5
2012
149
96
0.39
0.52
18.3
6.0
27.5
29.5
0.005
N/A
30.9
24.8
15.6
8.8
0.6
1.4
2011
149
85
0.40
0.36
18.6
5.3
26.7
29.2
0.008
N/A
30.3
20.4
17.3
8.0
0.5
1.2
2010
139
81
0.44
0.51
19.3
5.7
26.8
28.6
N/A
N/A
26.6
18.2
14.8
7.2
0.4
N/A
2009
156
87
0.40
0.55
21.0
6.0
28.0
27.6
0.010
N/A
26.0
24.3
16.5
8.3
0.6
N/A
2008
156
82
0.48
0.66
22.7
8.2
27.7
26.3
0.012
N/A
27.0
N/A
15.1
9.5
1.0
N/A
2007
135
97
0.52
0.48
25.3
12.5
24.8
26.3
0.014
N/A
N/A
N/A
N/A
9.3
1.3
0.1
2006
128
102
0.55
0.67
25.1
14.6
24.0
26.3
0.009
N/A
N/A
N/A
N/A
9.7
1.9
0.8
2005
127
100
0.59
0.71
25.7
16.3
22.8
25.1
0.014
N/A
N/A
N/A
N/A
9.7
1.9
5.3
2004
132
86
0.68
0.63
25.4
17.4
24.6
25.5
0.016
N/A
N/A
N/A
N/A
N/A
1.7
1.6
2003
137
99
0.80
0.62
29.9
18.0
24.7
25.1
0.021
N/A
N/A
N/A
N/A
N/A
1.4
0.9
2002
134
94
0.83
0.35
31.4
17.7
23.1
24.1
0.021
N/A
N/A
N/A
N/A
N/A
2.0
0.6
2001
141
95
1.00
0.32
31.8
16.7
21.4
24.1
0.029
N/A
N/A
N/A
N/A
N/A
2.1
0.9
2000
150
95
1.05
0.34
34.7
16.2
20.7
24.0
0.027
N/A
N/A
N/A
N/A
N/A
2.0
0.4
Natural disasters
Type
East San Gabriel Valley
North Las Vegas
Tornado activity compared to U.S. average
18.5%
2.1%
Earthquake activity compared to U.S. average
7,292.4%
6,003.8%
Natural disasters compared to U.S. average
57%
12%
Transportation
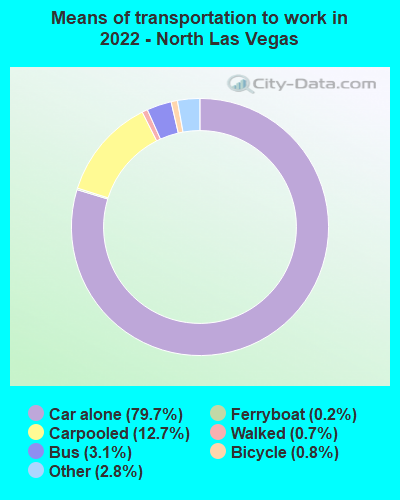
The public transportation system in East San Gabriel Valley is extensive, featuring bus and rail systems, including the LA Metro. In North Las Vegas, public transit is less prevalent, with most residents commuting by car.
Transport
Type
East San Gabriel Valley
North Las Vegas
Amtrak stations nearby
3
1
FAA registered aircraft
0
123
FAA registered aircraft manufacturers and dealers
0
16
Means of transportation to work
Type
East San Gabriel Valley
North Las Vegas
Bicycle
0.6%
0.4%
Bus
2.9%
1.6%
Carpooled
17.1%
13.4%
Car alone
73.3%
80.7%
Motorcycle
0.2%
0.4%
Railroad
0.6%
0%
Walked
2.2%
0.7%
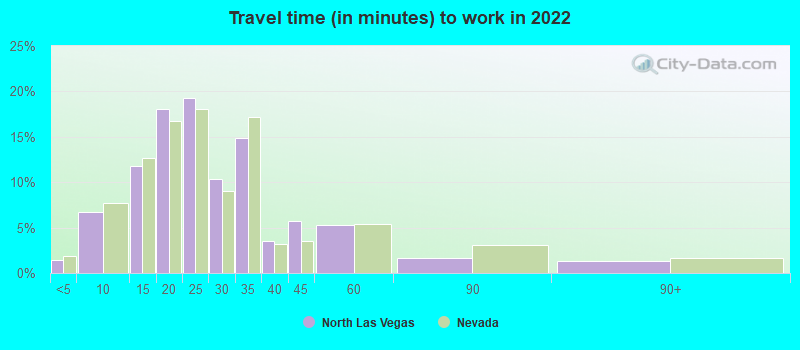
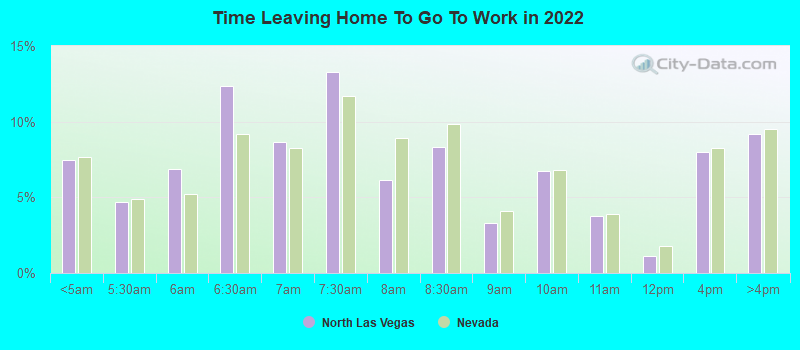
Average travel time to work
Type
East San Gabriel Valley
North Las Vegas
Average
32.3 min
25.8 min
Real Estate
Real estate in East San Gabriel Valley is more expensive compared to North Las Vegas. Property values in East San Gabriel Valley tend to be high due to demand, location, and the quality of local schools. North Las Vegas offers more affordable housing options, although prices have been increasing recently due to growing demand.
Neighborhoods
East San Gabriel Valley contains a diverse range of neighborhoods, from upscale areas like San Marino to more modest ones like El Monte. North Las Vegas also offers a range of neighborhoods, but with fewer high-end options.
Houses and residents
Type
East San Gabriel Valley
North Las Vegas
Houses
270,240
91,034
Average household size (people)
3.5
3.2
Houses occupied
263,338 (97.4%)
85,966 (94.4%)
Houses occupied by owners
180,683 (68.6%)
51,443 (59.8%)
Houses occupied by renters
82,655 (31.4%)
34,523 (40.2%)
Median rent asked for vacant for-rent units
$1,935
$1,592
Median price asked for vacant for-sale houses and condos
$1,138,428
$288,164
Estimated median house or condo value
$643,048
$335,200
Median number of rooms in apartments
3.7
4.6
Median number of rooms in houses and condos
5.9
6.3
Renting percentage
32.3%
37.6%
Housing density (houses/condos per square mile)
1,270.8
1,159.5
Household income disparities
40.3%
40.2%
Housing units without a mortgage
26,635 (16.4%)
317 (0.8%)
Housing units with both a second mortgage and home equity loan
515 (0.3%)
1,013 (2.6%)
Housing units with a mortgage
136,243 (83.6%)
39,101 (99.2%)
Housing units with a home equity loan
11,429 (7%)
0 (0%)
Housing units with a second mortgage
21,150 (13%)
1,247 (3.2%)
Housing units lacking complete kitchen facilities
1%
0.9%
Housing units lacking complete plumbing facilities
Self-employed workers in own not incorporated business
25,753
4,201
State government workers
13,845
2,853
Unpaid family workers
1,494
530
Industries and Occupations
In East San Gabriel Valley, the dominant industries include healthcare, education, and retail trade. In North Las Vegas, industries are centered around entertainment, accommodation, food services, and an increasing presence of tech and manufacturing companies.
Healthcare services are abundant in East San Gabriel Valley, with access to excellent hospitals and specialists. North Las Vegas also has good healthcare options, but access to specialists may require a trip into Las Vegas.
Health (county statistics)
Type
East San Gabriel Valley
North Las Vegas
General health status score of residents in this county from 1 (poor) to 5 (excellent)
East San Gabriel Valley has well-functioning infrastructure including public transit, roads, and utilities, but it also struggles with traffic congestion. North Las Vegas, on the other hand, has been rapidly developing its infrastructure to keep pace with its fast-growing population.
Infrastructure
Type
East San Gabriel Valley
North Las Vegas
TV stations
24
14
Culture and Food
In terms of culture and food, both regions have much to offer. East San Gabriel Valley is known for its eclectic food scene, especially in places like Monterey Park, labeled as the first suburban Chinatown. North Las Vegas, on the other hand, is a short drive away from the world-class dining and entertainment offered on the Las Vegas Strip.
Sports Teams
While East San Gabriel Valley residents might root for the Los Angeles-based sports teams, North Las Vegas has its own local teams in the Golden Knights (NHL) and the Raiders (NFL), both of which have a strong local following.
 East San Gabriel Valley, CA
 North Las Vegas, NV