Relative area comparison
 East San Gabriel Valley, CA
 Reno, NV
Comparing East San Gabriel Valley, California, to Reno, Nevada unveils interesting differences and similarities, which might affect your decision to relocate or visit. They both offer unique lifestyles delineated by factors like crime rates, cost of living, work opportunities, and cultural offerings. Let's delve into the specifics of living in both areas to give a comprehensive understanding of what it's like in each locale.
 East San Gabriel Valley, CA and
Reno, NV : 392.3 miles
East San Gabriel Valley, CA and
Reno, NV : 392.3 miles
East San Gabriel Valley's population is larger by 254%. The population of Reno has grown by 88,371 people (49.0%) during that time.
| Population | ||
| Type | East San Gabriel Valley | Reno |
|---|---|---|
| Population | 952,352 | 268,851 |
| Female / male percentage | 50.8% / 49.2%
|
49.7% / 50.3%
|
The crime rate is lower in East San Gabriel Valley than in Reno, providing a safer living environment. In Reno, there's a higher rate of violent crime, although police efforts are ongoing to minimize these crime rates. Given their larger population size, East San Gabriel Valley still deal with crime, but their rates are more favorable, making it safer, particularly for families.
The cost of living in East San Gabriel Valley is higher than in Reno, influenced mainly by real estate prices and California's generally high cost of living. Housing, in particular, is significantly more expensive in East San Gabriel Valley; however, salaries tend to also be higher in this Californian area, maintaining a balanced cost of living.
California has a progressive income tax, with maximum rates of 13.3%, while Nevada has no state income tax. This makes Reno a favorable location for people with high earnings looking to save on income tax.
While property values are higher in East San Gabriel Valley, California has a relatively low property tax rate of 0.77%. Nevada has a slightly higher property tax rate, averaging around 0.92%, but the lower property costs in Reno might offset the tax rate.
California has a higher state sales tax rate at 7.25% compared to Nevada's 4.6%. However, Nevada cities, including Reno, implement a higher local sales tax, resulting in an overall sales tax of 8.27% in Reno.
| Income | ||
| Type | East San Gabriel Valley | Reno |
|---|---|---|
| Estimated median household income | $95,242 | $67,478 |
| Estimated per capita income | $34,474 | $37,989 |
| Cost of living index (U.S. average is 100) | 150.2 | 99.5 |
If you make $50,000 in Reno, you will have to make $75,477 in East San Gabriel Valley to maintain the same standard of living.
East San Gabriel Valley is characterized by picturesque rolling hills and proximity to the San Gabriel Mountains. Reno is found in the high desert at the foot of the Sierra Nevada, offering its unique natural beauty, including desert landscapes and close access to Lake Tahoe.
| Geographical information | ||
| Type | East San Gabriel Valley | Reno |
|---|---|---|
| Land area | 212.6 sq. miles | 69.1 sq. miles |
| Population density | 4,478.5 people per sq. mile | 3,890 people per sq. mile |
East San Gabriel Valley, CA
Reno, NV
Both regions host a variety of academic institutions; however, East San Gabriel Valley, being closer to Los Angeles, offers more opportunities due to the presence of prestigious universities such as UCLA and USC. Reno, despite having fewer educational institutions, is home to the University of Nevada, which is well-esteemed, particularly for its strong programs in mining and engineering.
| Education level (25-year-olds and older) | ||
| Type | East San Gabriel Valley | Reno |
|---|---|---|
| Bachelor's degree or higher | 22.5% | 35.9% |
| Graduate or professional degree | 7.4% | 15.2% |
| High school or higher | 72% | 86.9% |
The economy in East San Gabriel Valley is diverse, with thriving sectors including healthcare, manufacturing, retail, and education. Reno's economy is distinctly less diverse, with a primary focus on the gaming and tourism industries, although there's growing diversification with technology and logistics companies setting up shop.
In East San Gabriel Valley, some of the biggest employers include large school districts and medical centers. In Reno, the top employers are related to the gaming and tourism industry with the Peppermill Resort Spa Casino and Atlantis Casino Resort Spa being among the biggest.
In East San Gabriel Valley (Los Angeles County), 69.7% voted for Democrats and 27.8% for Republicans in 2012 Presidential Election. In Reno (Washoe County), 50.8% voted for Democrats and 47.1% for Republicans.
East San Gabriel Valley features a Mediterranean climate, with hot, dry summers and cool, wet winters. On the other hand, Reno has a semi-arid climate, characterized by hot summers and cold winters. The snowy season in Reno lasts longer, which could be an attraction for those who enjoy winter sports.
| Weather and climate | ||
| Type | East San Gabriel Valley | Reno |
|---|---|---|
| Temperature - Average | 62.7°F | 51.1°F |
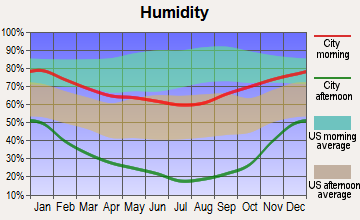
| Humidity - Average morning or afternoon humidity | 64.7% | 51.3% |
| Humidity - Differences between morning and afternoon humidity | 19.6% | 57% |
| Humidity - Maximum monthly morning or afternoon humidity | 70.7% | 75% |
| Humidity - Minimum monthly morning or afternoon humidity | 51% | 18% |
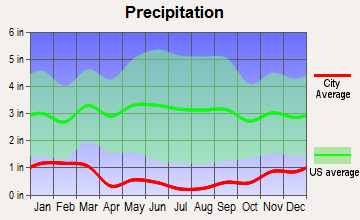
| Precipitation - Yearly average | 19.1 in | 8.1 in |
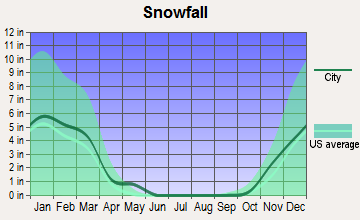
| Snowfall - Yearly average | 0 in | 45 in |
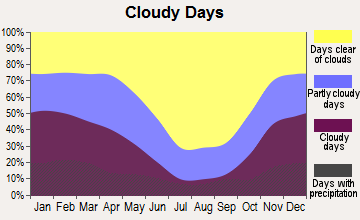
| Clouds - Number of days clear of clouds | 28.3% | 26.3% |
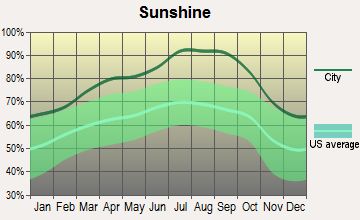
| Sunshine amount - Average | 78.4% | 88.3% |
| Sunshine amount - Differences during a year | 22% | 30% |
| Sunshine amount - Maximum monthly | 85% | 95% |
| Sunshine amount - Minimum monthly | 63% | 65% |
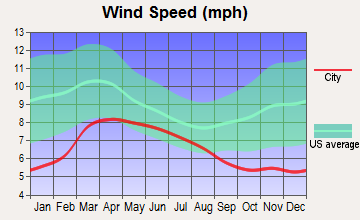
| Wind speed - Average | 3.7 mph | 6.9 mph |
| Natural disasters | ||
| Type | East San Gabriel Valley | Reno |
|---|---|---|
| Tornado activity compared to U.S. average | 18.5% | 2.4% |
| Earthquake activity compared to U.S. average | 7,292.4% | 6,879.2% |
| Natural disasters compared to U.S. average | 57% | 28% |
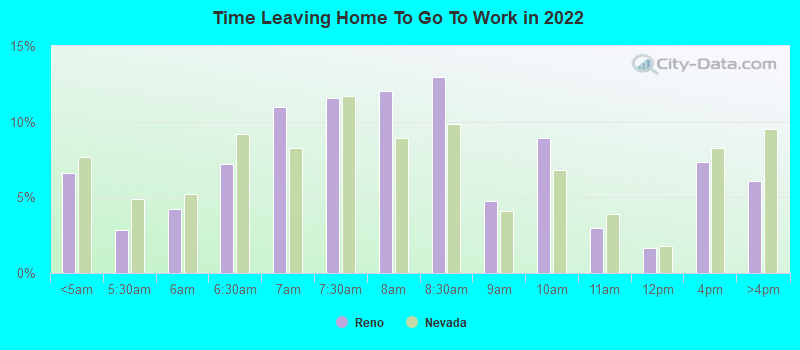
Public transportation is more readily available and extensive in East San Gabriel Valley due to its proximity to the Los Angeles metropolitan area. Reno's public transportation is more limited; however, as a smaller city, commuting is less of a concern, and most places are easily accessible by car.
| Transport | ||
| Type | East San Gabriel Valley | Reno |
|---|---|---|
| Amtrak stations | 0 | 1 |
| Amtrak stations nearby | 3 | 2 |
| FAA registered aircraft | 0 | 758 |
| FAA registered aircraft manufacturers and dealers | 0 | 16 |
| Means of transportation to work | ||
| Type | East San Gabriel Valley | Reno |
|---|---|---|
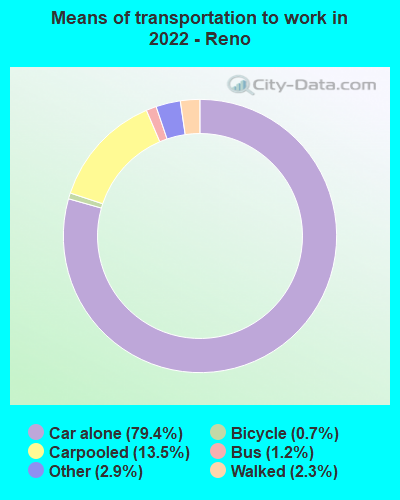
| Bicycle | 0.6% | 0.1% |
| Bus | 2.9% | 1.8% |
| Carpooled | 17.1% | 10.2% |
| Car alone | 73.3% | 81.6% |
| Motorcycle | 0.2% | 0.2% |
| Railroad | 0.6% | 0% |
| Taxicab | 0% | 0.2% |
| Walked | 2.2% | 1.7% |
| Average travel time to work | ||
| Type | East San Gabriel Valley | Reno |
|---|---|---|
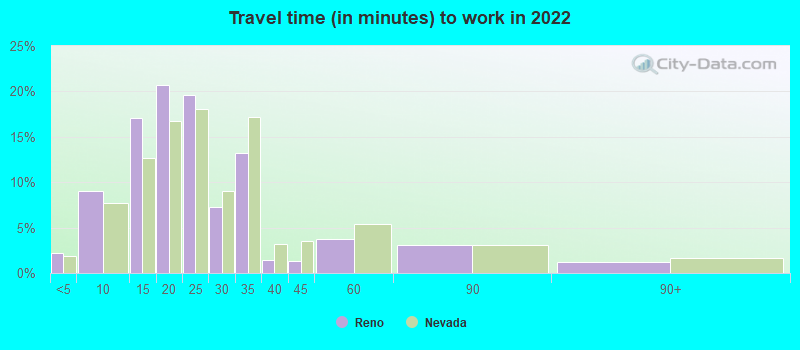
| Average | 32.3 min | 24.2 min |
Real estate prices are much higher in East San Gabriel Valley due to the desirability of the location and greater demand. The property market in Reno is significantly more affordable, making it a more attractive option for individuals with a tighter budget.
East San Gabriel Valley comprises many attractive neighborhoods such as Walnut and Diamond Bar, known for their affluent residents and upscale homes. Reno offers a range of neighborhood types, from bustling downtown areas to quieter suburban communities like South Meadows.
| Houses and residents | ||
| Type | East San Gabriel Valley | Reno |
|---|---|---|
| Houses | 270,240 | 116,918 |
| Average household size (people) | 3.5 | 2.4 |
| Houses occupied | 263,338 (97.4%) | 110,993 (94.9%) |
| Houses occupied by owners | 180,683 (68.6%) | 54,158 (48.8%) |
| Houses occupied by renters | 82,655 (31.4%) | 56,835 (51.2%) |
| Median rent asked for vacant for-rent units | $1,935 | $1,306 |
| Median price asked for vacant for-sale houses and condos | $1,138,428 | $797,037 |
| Estimated median house or condo value | $643,048 | $469,100 |
| Median number of rooms in apartments | 3.7 | 3.9 |
| Median number of rooms in houses and condos | 5.9 | 6.2 |
| Renting percentage | 32.3% | 52% |
| Housing density (houses/condos per square mile) | 1,270.8 | 1,691.7 |
| Household income disparities | 40.3% | 44.4% |
| Housing units without a mortgage | 26,635 (16.4%) | 616 (1.7%) |
| Housing units with both a second mortgage and home equity loan | 515 (0.3%) | 1,679 (4.6%) |
| Housing units with a mortgage | 136,243 (83.6%) | 35,814 (98.3%) |
| Housing units with a home equity loan | 11,429 (7%) | 129 (0.4%) |
| Housing units with a second mortgage | 21,150 (13%) | 1,980 (5.4%) |
| Housing units lacking complete kitchen facilities | 1% | 3.7% |
| Housing units lacking complete plumbing facilities | 0.8% | 2.3% |
In East San Gabriel Valley, the primary industries include healthcare, educational services, and retail trade. Reno has a strong tourism industry due to its casinos and nearby ski resorts, but its growing tech industry is gaining prominence with companies like Tesla opening up large operations centres.
East San Gabriel Valley offers numerous top-notch health facilities due to its greater population and proximity to Los Angeles. Reno also has some outstanding health facilities, but their number and diversity are somewhat more limited compared to East San Gabriel Valley.
| Health (county statistics) | ||
| Type | East San Gabriel Valley | Reno |
|---|---|---|
| General health status score of residents in this county from 1 (poor) to 5 (excellent) | 3.5 | 3.5 |
| Average weight of females (lbs) | 154.6 lbs | 157.1 lbs |
| Average weight of males (lbs) | 185 lbs | 193.5 lbs |
| Residents visited a dentist within the past year | 68.1% | 68.2% |
| Residents exercised in the past month | 74.7% | 77.9% |
| Adult residents drank alcohol in the past 30 days | 69.2% | 60.9% |
| Residents smoked 100+ cigarettes in their lives | 37.8% | 44.3% |
East San Gabriel Valley benefits from being in the Los Angeles metropolitan area, with an extensive road network, public transit system, and airports. Reno has a well-established infrastructure too, but it's more limited in comparison due to its smaller size.
| Infrastructure | ||
| Type | East San Gabriel Valley | Reno |
|---|---|---|
| TV stations | 24 | 15 |
Being in the Los Angeles area, East San Gabriel Valley is at the heart of cultural diversification with a food scene that covers cuisines globally. Reno also has a vibrant culture and food scene, heavily influenced by its tourism industry, offering a variety of dining and entertainment options.
East San Gabriel Valley residents have access to the numerous professional sports teams in the nearby Los Angeles area. Reno, while lacking major league sports teams, offers a robust minor league scene with teams like Reno Aces (baseball) and Reno 1868 FC (soccer).