East San Gabriel Valley, CA vs Southwest San Gabriel Valley, CA
People are significantly exploring living options between East and Southwest San Gabriel Valley, CA. As they both offer a unique living experience with varying factors like safety, cost of living, infrastructure, and more. While new residents may compare factors most relevant to a permanent move such as real-estate, schools, crime rate, and cost of living, tourists may be more interested in the culture, food, transportation systems, local attractions, and sports teams.
East San Gabriel Valley has a lower crime rate compared to Southwest San Gabriel Valley. The area is regarded as safe with crime indices continually dropping over the past years. Southwest San Gabriel Valley, however, has a slightly higher crime rate, though it is still quite safer than other high-crime cities in Los Angeles County.
Cost of Living
The cost of living in Southwest San Gabriel Valley is slightly higher than in East San Gabriel Valley. This difference is primarily due to the higher housing costs in the Southwest. However, as prices in California go, both are more affordable than areas like San Francisco or Los Angeles city center.
Income Tax
The state income tax for California applies to both East and Southwest San Gabriel Valley without a difference. As of now, California has a progressive income tax, which means the rate of taxation increases as the taxable amount increases.
Property Tax
Property tax rates vary slightly between the two regions. While the base rate in California is the same, local levies and bonds may make the effective rate slightly higher in some parts of Southwest San Gabriel Valley.
Sales Tax
Sales tax is the same across both regions, set by Los Angeles County and the State of California. Currently, the base sales tax rate in Los Angeles County is 9.5%.
Income
Type
East San Gabriel Valley
Southwest San Gabriel Valley
Estimated median household income
$95,242
$73,720
Estimated per capita income
$34,474
$29,945
Cost of living index (U.S. average is 100)
150.2
161.2
If you make $50,000 in East San Gabriel Valley, you will have to make $53,662 in Southwest San Gabriel Valley to maintain the same standard of living.
Geographical Conditions
Both parts of the San Gabriel Valley are set against the backdrop of the beautiful San Gabriel Mountains. The Southwest part is closer to Downtown LA, while the East part stretches into more suburban and rural areas. Both areas have multiple parks and natural areas for outdoor enthusiasts.
Geographical information
Type
East San Gabriel Valley
Southwest San Gabriel Valley
Land area
212.6 sq. miles
35.3 sq. miles
Population density
4,478.5 people per sq. mile
9,252.7 people per sq. mile
Relative area comparison
East San Gabriel Valley, CA Southwest San Gabriel Valley, CA
Education
Both regions have good public and private schools, boasting above-average test scores and high rates of college-bound graduates. However, East San Gabriel Valley has a few more high-performing school districts like Walnut Valley Unified School District.
The economic environment in both areas is quite robust with diverse job opportunities and low unemployment rates. The Southwest region, however, has more companies operating in the medical, technology, and entertainment sectors, providing higher-than-average salaries and opportunities for career advancement.
Biggest Employers
In East San Gabriel Valley, some of the largest employers include City of Hope Hospital and Mt. San Antonio College. In Southwest San Gabriel Valley, entertainment, healthcare and technology firms like Walt Disney Company, Kaiser Permanente, and JPL provide numerous job opportunities.
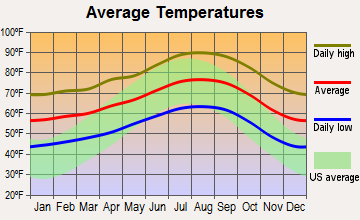
Weather
Weather is not significantly different between the two regions. Both Southwest and East San Gabriel Valley enjoy the Mediterranean climate characteristic of Southern California. These areas experience warm, dry summers and cool, wet winters, which makes them attractive to both residents and visitors.
Weather and climate
Type
East San Gabriel Valley
Southwest San Gabriel Valley
Temperature - Average
62.7°F
66.3°F
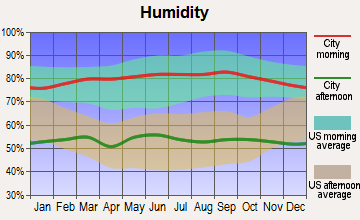
Humidity - Average morning or afternoon humidity
64.7%
61.4%
Humidity - Differences between morning and afternoon humidity
19.6%
16.5%
Humidity - Maximum monthly morning or afternoon humidity
70.7%
65.8%
Humidity - Minimum monthly morning or afternoon humidity
51%
49.3%
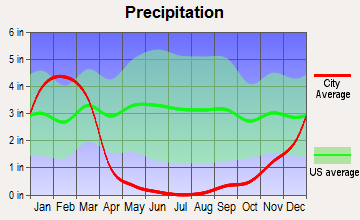
Precipitation - Yearly average
19.1 in
17.6 in
Snowfall - Yearly average
0 in
0 in
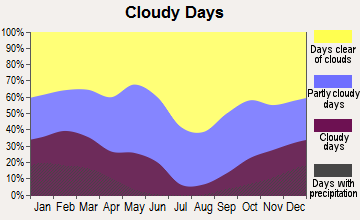
Clouds - Number of days clear of clouds
28.3%
30.1%
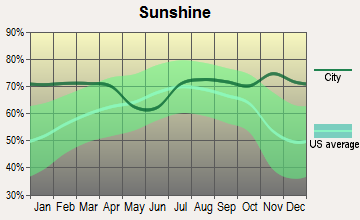
Sunshine amount - Average
78.4%
78.4%
Sunshine amount - Differences during a year
22%
22%
Sunshine amount - Maximum monthly
85%
85%
Sunshine amount - Minimum monthly
63%
63%
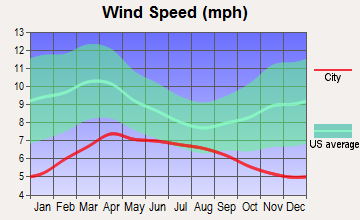
Wind speed - Average
3.7 mph
2.3 mph
Average climate in East San Gabriel Valley, California
Average climate in Southwest San Gabriel Valley, California
Air pollution
Type
AQI
CO
NO2
OZONE
PB
PM10
PM25
SO2
Year
East San Gabriel Valley
Southwest San Gabriel Valley
East San Gabriel Valley
Southwest San Gabriel Valley
East San Gabriel Valley
Southwest San Gabriel Valley
East San Gabriel Valley
Southwest San Gabriel Valley
East San Gabriel Valley
Southwest San Gabriel Valley
East San Gabriel Valley
Southwest San Gabriel Valley
East San Gabriel Valley
Southwest San Gabriel Valley
East San Gabriel Valley
Southwest San Gabriel Valley
2018
143
140
0.36
0.39
14.1
14.2
29.2
26.6
0.007
0.008
29.6
27.5
13.4
15.1
0.3
0.4
2017
150
142
0.35
0.38
14.8
15.1
30.5
27.8
0.007
0.007
32.7
30.2
12.6
15.3
0.3
0.5
2016
141
128
0.31
0.36
15.5
15.2
29.3
26.5
0.007
0.007
30.3
27.8
12.0
14.3
0.3
0.4
2015
145
137
0.30
0.36
15.2
15.3
30.4
26.7
0.007
0.006
30.0
27.6
14.6
16.4
0.2
0.3
2014
142
138
0.32
0.39
16.8
16.3
29.7
26.8
0.008
0.007
33.6
29.9
11.7
18.0
0.3
0.4
2013
147
140
0.33
0.44
17.0
17.5
27.7
25.2
0.007
0.007
31.5
28.3
11.5
17.0
0.4
0.4
2012
149
144
0.39
0.47
18.3
17.7
27.5
25.0
0.005
0.007
30.9
27.6
15.6
18.1
0.6
0.5
2011
149
142
0.40
0.50
18.6
19.3
26.7
23.6
0.008
0.008
30.3
29.8
17.3
17.6
0.5
0.4
2010
139
128
0.44
0.52
19.3
19.4
26.8
22.9
N/A
0.020
26.6
30.0
14.8
16.3
0.4
0.5
2009
156
150
0.40
0.43
21.0
21.5
28.0
23.5
0.010
0.011
26.0
40.0
16.5
18.0
0.6
0.5
2008
156
152
0.48
0.53
22.7
23.5
27.7
22.8
0.012
0.014
27.0
39.1
15.1
18.3
1.0
0.6
2007
135
128
0.52
0.58
25.3
24.2
24.8
21.8
0.014
0.017
N/A
N/A
N/A
N/A
1.3
1.1
2006
128
125
0.55
0.63
25.1
24.6
24.0
22.1
0.009
0.009
N/A
N/A
N/A
N/A
1.9
1.7
2005
127
123
0.59
0.66
25.7
25.6
22.8
20.5
0.014
0.015
N/A
N/A
N/A
N/A
1.9
2.1
2004
132
132
0.68
0.77
25.4
27.7
24.6
22.9
0.016
0.019
N/A
N/A
N/A
N/A
1.7
2.4
2003
137
143
0.80
0.98
29.9
31.8
24.7
22.0
0.021
0.027
N/A
N/A
N/A
N/A
1.4
1.8
2002
134
137
0.83
1.00
31.4
33.0
23.1
21.1
0.021
0.025
N/A
N/A
N/A
N/A
2.0
2.4
2001
141
143
1.00
1.11
31.8
34.2
21.4
18.9
0.029
0.039
N/A
N/A
N/A
N/A
2.1
2.4
2000
150
147
1.05
1.12
34.7
33.4
20.7
18.9
0.027
0.033
N/A
N/A
N/A
N/A
2.0
1.4
Natural disasters
Type
East San Gabriel Valley
Southwest San Gabriel Valley
Tornado activity compared to U.S. average
18.5%
18%
Earthquake activity compared to U.S. average
7,292.4%
7,182.3%
Natural disasters compared to U.S. average
57%
57%
Transportation
Both areas have an extensive public transit network, enabling easy commuting to downtown LA and other neighborhoods. East San Gabriel Valley has metro light rail lines and bus services, while Southwest San Gabriel Valley also has numerous transit options including buses and bike lanes.
Transport
Type
East San Gabriel Valley
Southwest San Gabriel Valley
Amtrak stations nearby
3
3
Means of transportation to work
Type
East San Gabriel Valley
Southwest San Gabriel Valley
Bicycle
0.6%
0.5%
Bus
2.9%
4.7%
Carpooled
17.1%
16.1%
Car alone
73.3%
73%
Motorcycle
0.2%
0.1%
Railroad
0.6%
0%
Walked
2.2%
2.5%
Average travel time to work
Type
East San Gabriel Valley
Southwest San Gabriel Valley
Average
32.3 min
29.1 min
Real Estate
Real estate prices are generally higher in Southwest San Gabriel Valley due to proximity to downtown Los Angeles and other upscale neighborhoods. Nonetheless, East San Gabriel Valley offers a better bang for your buck, with more affordable houses and larger plot sizes.
Neighborhoods
Neighborhoods in both regions have distinct characteristics. The Southwest region boasts more upscale, trendy areas with a rich history and diverse culture. East San Gabriel Valley, on the other hand, offers quiet suburban neighborhoods, perfect for families and retirees.
Houses and residents
Type
East San Gabriel Valley
Southwest San Gabriel Valley
Houses
270,240
102,656
Average household size (people)
3.5
3.1
Houses occupied
263,338 (97.4%)
99,543 (97%)
Houses occupied by owners
180,683 (68.6%)
47,333 (47.6%)
Houses occupied by renters
82,655 (31.4%)
52,210 (52.5%)
Median rent asked for vacant for-rent units
$1,935
$1,828
Median price asked for vacant for-sale houses and condos
$1,138,428
$1,138,428
Estimated median house or condo value
$643,048
$723,161
Median number of rooms in apartments
3.7
3.7
Median number of rooms in houses and condos
5.9
5.9
Renting percentage
32.3%
51.7%
Housing density (houses/condos per square mile)
1,270.8
2,909.6
Household income disparities
40.3%
44%
Housing units without a mortgage
26,635 (16.4%)
13,166 (31.1%)
Housing units with both a second mortgage and home equity loan
515 (0.3%)
88 (0.2%)
Housing units with a mortgage
136,243 (83.6%)
29,118 (68.9%)
Housing units with a home equity loan
11,429 (7%)
2,557 (6%)
Housing units with a second mortgage
21,150 (13%)
2,975 (7%)
Housing units lacking complete kitchen facilities
1%
1.5%
Housing units lacking complete plumbing facilities
0.8%
0.9%
Housing units in structures
Housing units in structures
East San Gabriel Valley
Southwest San Gabriel Valley
One, detached
68.5%
53.7%
One, attached
8.2%
10.1%
Two
1.0%
3.2%
3 or 4
3.9%
7.4%
5 to 9
3.0%
9.1%
10 to 19
2.4%
6.4%
20 to 49
2.8%
5.5%
50 or more
6.5%
3.8%
Mobile homes
3.6%
0.7%
Boats, RVs, vans, etc.
0.1%
0.1%
Median real estate property taxes paid for housing units
Self-employed workers in own not incorporated business
25,753
8,660
State government workers
13,845
4,158
Unpaid family workers
1,494
639
Industries and Occupations
A broad range of industries and occupations can be found in both regions. East San Gabriel Valley is known for its strong healthcare and education sectors, while Southwest San Gabriel Valley has a more diverse economic base, featuring industries such as entertainment, technology, and finance.
Health Care
Excellent health care facilities are present in both East and Southwest San Gabriel Valley, with world-class hospitals like City of Hope in the East and Methodist Hospital in the Southwest. Both areas have numerous clinics, specialty centers, and physicians, ensuring residents have access to high-quality medical care.
Infrastructure
East San Gabriel Valley has a slightly better infrastructure due to its comprehensive public transportation system and array of public parks and community centers. Conversely, Southwest San Gabriel Valley has been investing in infrastructure development with recent construction of new health care facilities, schools, and transportation services.
Infrastructure
Type
East San Gabriel Valley
Southwest San Gabriel Valley
TV stations
24
26
Culture and Food
Both regions have a diverse cultural scene and culinary offerings. The food scene is especially thriving, boasting everything from food trucks to gourmet restaurants. Southwest San Gabriel Valley, however, is more known for its vibrant arts scene and cultural festivals.
Sports Teams
The San Gabriel Valley doesn't have its own professional sports teams, but both areas are within close travel distance to LA's various teams, including the Lakers, Clippers, Dodgers, Kings, and Rams.
 East San Gabriel Valley, CA
 Southwest San Gabriel Valley, CA