If you are contemplating relocating or visiting either Houston, TX, or Colorado Springs, CO, there are several key differentials to consider while making your selection. These two cities offer distinct experiences in terms of crime rates, weather, cost of living, education, economy, infrastructure, and culture. Houston, the largest city in Texas, features a diverse, thriving economy and multicultural vibrant lifestyle. In contrast, Colorado Springs offers a more serene suburban lifestyle with easy access to outdoor exploration due to its close proximity to the Rocky Mountains.
Distance between
Houston, TX and
Colorado Springs, CO : 825.8 miles
Houston's population is larger by 373%. Its population has grown by 334,619 people (17.1%) since 2000. The population of Colorado Springs has grown by 123,066 people (34.1%) during that time.
When considering crime and safety, Houston has a higher crime rate compared to the national average, with violent and property crimes being more prevalent. However, it's important to remember that crime rates can vary depending on the neighborhood. Colorado Springs, on the other hand, has a lower crime rate overall. The city is generally considered safer, making it a more appealing choice for families or individuals concerned with safety.
City-data.com crime index counts serious crimes and violent crime more heavily. It adjusts for the number of visitors and daily workers commuting into cities. (higher means more crime, U.S. average = 301.1)
City-data.com crime index counts serious crimes and violent crime more heavily. It adjusts for the number of visitors and daily workers commuting into cities. (higher means more crime, U.S. average = 301.1)
Sex Offenders
According to our data, there are 7,864 registered sex offenders living in Houston and 1,681 registered sex offenders living in . The ratio of residents to sex offenders in Houston is 293 to 1; the ratio in Colorado Springs is 277 to 1. The number of registered sex offenders compared to the number of residents in Houston is near to than in Colorado Springs.
Cost of Living
The cost of living is generally lower in Houston compared to Colorado Springs. Although housing costs in both cities are above the national average, they are significantly lower in Houston, leading to an overall lower cost of living. On the other hand, Colorado Springs' cost of living is relatively high, particularly due to higher housing costs.
Income Tax
As mentioned before, Texas has no state income tax, beneficial for those with a higher income. Colorado, however, has a flat state income tax rate of 4.63%.
Property Tax
Houston has a relatively high property tax rate, highly dependent on the assessed home value and specific location. In contrast, Colorado Springs has a relatively low property tax rate, which can be a significant factor for property owners.
Sales Tax
Texas, including Houston, does not have a state income tax but does have a sales tax rate of 8.25%. Colorado Springs in Colorado has a comparatively lower state sales tax rate of 2.9%, but the overall sales tax can go up to around 8.2% when combined with city and county taxes.
Income
Type
Houston
Colorado Springs
Estimated median household income
$55,499
$74,579
Estimated per capita income
$36,265
$39,808
Cost of living index (U.S. average is 100)
97.2
99.6
If you make $50,000 in Houston, you will have to make $51,235 in Colorado Springs to maintain the same standard of living.
Geographical Conditions
Houston is a sprawling city located near the Gulf of Mexico, with a relatively flat terrain. It's prone to flooding due to its low elevation and hurricane activity in the area. Colorado Springs is situated near the base of the Rocky Mountains, providing plenty of opportunities for hiking and skiing, but it's also susceptible to cold-climate conditions, including snow and extremely low winter temperatures.
If you're relocating with your family, education is a significant factor to contemplate. Both cities have a good mix of public, private, and charter schools. Houston has more educational choices due to its size and diversity. However, Colorado Springs' smaller size allows for more specialized education programs and generally smaller class sizes.
Houston’s economy is strong and diverse, with major industries including oil and gas, aerospace, healthcare, and technology. Colorado Springs has a smaller economy, with a focus on military, high-tech industry, and tourism. While both cities boast low unemployment rates, Houston’s larger and more diverse economy may offer more job opportunities.
Biggest Employers
Houston's biggest employers are in the healthcare sector, particularly the Houston Methodist Hospital and the Texas Medical Center. In Colorado Springs, the largest employment sectors include defense and aerospace, with top employers including the United States Air Force Academy and Lockheed Martin.
In Houston (Harris County), 49.4% voted for Democrats and 49.3% for Republicans in 2012 Presidential Election. In Colorado Springs (El Paso County), 38.7% voted for Democrats and 59.2% for Republicans.
Elections
Type
Democrats
Republicans
Other
Year
Houston
Colorado Springs
Houston
Colorado Springs
Houston
Colorado Springs
2020
56.0%
43.0%
42.7%
53.9%
1.3%
3.1%
2016
54.0%
34.1%
41.6%
56.6%
4.4%
9.4%
2012
49.4%
38.7%
49.3%
59.2%
1.3%
2.0%
2008
50.5%
40.0%
48.9%
58.9%
0.6%
1.1%
2004
44.6%
32.2%
54.9%
66.9%
0.5%
0.9%
2000
43.0%
30.9%
54.4%
64.1%
2.6%
5.0%
1996
45.2%
32.2%
49.2%
59.0%
5.6%
8.8%
Breakdown of population affiliated with a religious congregation
Type
Adherents
Congregations
Religion
Houston
Colorado Springs
Houston
Colorado Springs
CATHOLIC CHURCH
18.1%
8.4%
3.6%
5.4%
SOUTHERN BAPTIST CONVENTION
14.2%
2.6%
26.8%
11.3%
MUSLIM ESTIMATE
2.9%
0.0%
1.6%
0.2%
EPISCOPAL CHURCH
1.0%
0.4%
1.4%
1.6%
LUTHERAN CHURCH
0.7%
0.7%
1.5%
1.9%
EVANGELICAL LUTHERAN CHURCH IN AMERICA
0.3%
1.0%
1.1%
2.3%
SEVENTH DAY ADVENTIST CHURCH
0.3%
0.2%
1.7%
1.2%
PRESBYTERIAN CHURCH IN AMERICA
0.1%
0.4%
0.5%
1.2%
AMERICAN BAPTIST CHURCHES IN THE USA
0.0%
0.3%
0.1%
1.2%
Weather
The weather in Houston and Colorado Springs is quite different. Houston has a humid subtropical climate. The summers are hot and humid, and winters are mild. On the other hand, Colorado Springs has a semi-arid climate, characterized by warm summers and cold, dry winters. The city also enjoys more sunny days than Houston. So, for those who enjoy sunshine and prefer a drier and cooler climate, Colorado Springs might be a better fit.
Weather and climate
Type
Houston
Colorado Springs
Temperature - Average
69.7°F
43.4°F
Humidity - Average morning or afternoon humidity
80.3%
53.3%
Humidity - Differences between morning and afternoon humidity
36.7%
30%
Humidity - Maximum monthly morning or afternoon humidity
92.8%
64%
Humidity - Minimum monthly morning or afternoon humidity
56.1%
34%
Precipitation - Yearly average
52.9 in
18.6 in
Snowfall - Yearly average
0.6 in
77 in
Clouds - Number of days clear of clouds
15%
21.2%
Sunshine amount - Average
60.4%
82.2%
Sunshine amount - Differences during a year
24%
10.5%
Sunshine amount - Maximum monthly
67%
79.7%
Sunshine amount - Minimum monthly
43%
69.2%
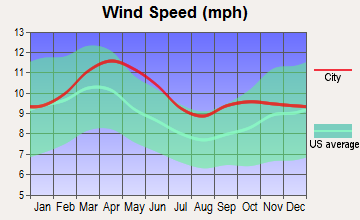
Wind speed - Average
8.2 mph
10.3 mph
Average climate in Houston, Texas
Average climate in Colorado Springs, Colorado
Air pollution
Type
AQI
CO
NO2
OZONE
PB
PM10
PM25
SO2
Year
Houston
Colorado Springs
Houston
Colorado Springs
Houston
Colorado Springs
Houston
Houston
Colorado Springs
Colorado Springs
Houston
Colorado Springs
Houston
Colorado Springs
2018
102
60
0.19
N/A
9.2
N/A
21.5
N/A
N/A
N/A
N/A
N/A
10.0
6.3
0.3
N/A
2017
96
58
0.16
N/A
9.4
N/A
23.1
N/A
N/A
N/A
N/A
N/A
9.1
6.1
0.3
N/A
2016
91
48
0.16
N/A
10.4
N/A
22.7
N/A
N/A
N/A
N/A
N/A
8.6
6.9
0.2
N/A
2015
109
N/A
0.15
N/A
10.1
N/A
21.7
N/A
N/A
N/A
N/A
N/A
9.9
N/A
0.2
N/A
2014
98
N/A
0.24
N/A
10.4
N/A
21.8
N/A
N/A
N/A
N/A
N/A
10.2
N/A
0.3
N/A
2013
106
N/A
0.25
N/A
11.1
N/A
23.0
N/A
N/A
N/A
N/A
N/A
10.6
N/A
0.4
N/A
2012
115
N/A
0.25
N/A
11.6
N/A
23.8
N/A
N/A
N/A
N/A
N/A
11.1
N/A
0.5
N/A
2011
118
N/A
0.27
N/A
10.8
N/A
24.6
N/A
N/A
N/A
N/A
N/A
11.5
N/A
0.8
N/A
2010
110
N/A
0.25
N/A
12.8
N/A
22.8
N/A
N/A
N/A
N/A
N/A
11.4
N/A
1.1
N/A
2009
115
N/A
0.21
N/A
10.5
N/A
22.1
N/A
N/A
N/A
N/A
N/A
11.4
N/A
1.0
N/A
2008
105
N/A
0.30
N/A
13.1
N/A
22.1
N/A
0.006
N/A
N/A
N/A
12.4
N/A
1.3
N/A
2007
119
N/A
0.31
N/A
15.2
N/A
20.5
N/A
0.006
N/A
N/A
N/A
13.5
N/A
1.9
N/A
2006
134
15
0.32
0.50
14.6
N/A
22.3
N/A
0.006
0.005
N/A
N/A
13.0
N/A
2.3
N/A
2005
126
17
0.42
0.55
16.3
N/A
22.8
N/A
0.005
0.027
N/A
N/A
13.9
N/A
3.5
N/A
2004
137
17
0.44
0.56
17.7
N/A
20.4
N/A
0.010
0.010
N/A
N/A
N/A
N/A
3.2
N/A
2003
146
19
0.62
0.59
17.0
N/A
20.9
N/A
0.009
0.011
N/A
N/A
N/A
N/A
3.2
N/A
2002
128
24
0.55
0.66
16.1
N/A
19.7
N/A
0.007
0.010
N/A
N/A
N/A
N/A
1.7
N/A
2001
147
51
0.44
0.63
18.4
16.7
19.6
N/A
0.008
0.005
21.3
N/A
N/A
N/A
2.5
1.9
2000
136
78
0.50
0.58
17.0
22.5
22.0
N/A
0.008
0.010
21.0
N/A
N/A
N/A
3.1
2.3
Natural disasters
Type
Houston
Colorado Springs
Tornado activity compared to U.S. average
187.3%
78.4%
Earthquake activity compared to U.S. average
63.9%
816.1%
Natural disasters compared to U.S. average
32%
17%
Transportation
Houston’s vast size necessitates reliance on cars for commuting, though the city does have a public METRO system. Colorado Springs also relies heavily on personal transportation, and while it does have a public transit service, it is less extensive than Houston's.
Transport
Type
Houston
Colorado Springs
Amtrak stations
1
1
Amtrak stations nearby
2
1
FAA registered aircraft
1
552
FAA registered aircraft manufacturers and dealers
44
44
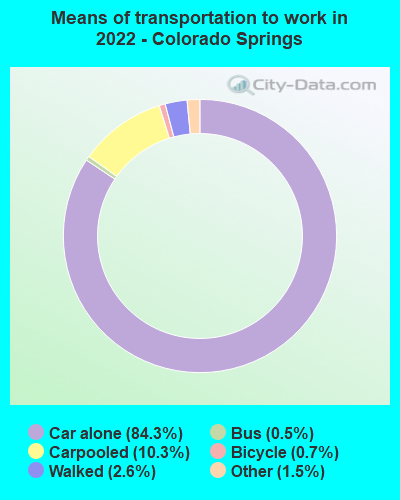
Means of transportation to work
Type
Houston
Colorado Springs
Bicycle
0.5%
0.3%
Bus
2.4%
0.4%
Carpooled
11.1%
9.2%
Car alone
81.2%
87%
Motorcycle
0.1%
0.1%
Railroad
0.1%
0%
Taxicab
0.1%
0.1%
Walked
1.6%
2.1%
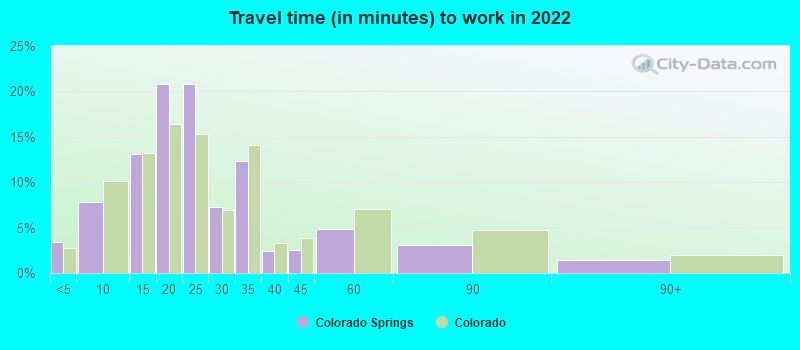
Average travel time to work
Type
Houston
Colorado Springs
Average
32 min
23.8 min
Other means
27.1 min
21.3 min
Public transportation
47.6 min
39 min
Private vehicle occupancy
Type
Houston
Colorado Springs
Average
1.2
1.1
Drove alone
86.4%
90%
In 2 person carpool
9.7%
7.5%
In 3 person carpool
2.4%
1.9%
In 4 person carpool
0.9%
0.2%
In 5-6 person carpool
0.4%
0.4%
In 7+ person carpool
0.3%
0.1%
How many people usually rode to work in the car, truck or van.
Real Estate
Real estate in Houston is typically less expensive than in Colorado Springs. However, both cities offer a variety of housing options, from urban apartments to suburban single-family homes. Both cities also have good investment potential, with steady home appreciation rates.
Neighborhoods
Both Houston and Colorado Springs have a plethora of unique neighborhoods. Houston is known for its vibrant and diverse neighborhoods like the historic Heights or upscale River Oaks. On the other hand, Colorado Springs offers neighborhoods such as the picturesque Broadmoor or the family-friendly Briargate.
Houses and residents
Type
Houston
Colorado Springs
Houses
1,028,763
205,380
Average household size (people)
2.6
2.4
Median year apartment built
1985
1984
Median year house/condo built
1976
1987
Length of stay in the house since moving in
14.4 years
10.6 years
Houses occupied
924,981 (89.9%)
197,542 (96.2%)
Houses occupied by owners
390,226 (42.2%)
123,398 (62.5%)
Houses occupied by renters
534,755 (57.8%)
74,144 (37.5%)
Median rent asked for vacant for-rent units
$1,323
$1,458
Median monthly housing costs
$1,134
$1,422
Median price asked for vacant for-sale houses and condos
$334,556
$595,239
Estimated median house or condo value
$236,700
$390,500
Median numbers of rooms
4.4
6
Median number of rooms in apartments
3.5
4.1
Median number of rooms in houses and condos
6.1
7.2
Median house price - detached houses
$348,048
$427,641
Median house price - in 2-unit structures
$232,228
$389,381
Median house price - in 3-to-4-unit structures
$205,330
$295,560
Median house price - in 5 or more unit structures
$297,061
$258,564
Median house price - mobile homes
$68,903
$30,081
Median house price - Townhouses or other attached units
$299,072
$308,944
Median house price - All housing units
$337,365
$403,675
Median house age
40
35
Renting percentage
54.6%
39.9%
Housing density (houses/condos per square mile)
1,775.5
1,105.7
House value disparities
40.9%
25.2%
Household income disparities
49%
41%
Median household income for houses/condes with a mortgage
$109,539
$99,037
Median household income for apartments without a mortgage
$65,707
$72,581
Housing units without a mortgage
4,386 (2.1%)
1,835 (2.1%)
Housing units with both a second mortgage and home equity loan
7,696 (3.6%)
6,564 (7.3%)
Housing units with a mortgage
207,809 (97.9%)
87,580 (97.9%)
Housing units with a home equity loan
421 (0.2%)
86 (0.1%)
Housing units with a second mortgage
11,969 (5.6%)
7,898 (8.8%)
House/condo owner moved in on average (years ago)
13
7
House/condo renter moved in on average (years ago)
1
1
Housing units lacking complete kitchen facilities
2.4%
0.6%
Housing units lacking complete plumbing facilities
1.5%
0.3%
Housing units in structures
Housing units in structures
Houston
Colorado Springs
One, detached
43.2%
62.3%
One, attached
4.8%
8.3%
Two
2.2%
1.4%
3 or 4
4.4%
4.7%
5 to 9
7.1%
4.9%
10 to 19
10.9%
6.7%
20 to 49
7.7%
6.1%
50 or more
18.6%
4.0%
Mobile homes
0.9%
1.7%
Boats, RVs, vans, etc.
0.1%
0.0%
Median real estate property taxes paid for housing units
Self-employed workers in own not incorporated business
75,956
13,110
State government workers
38,359
7,029
Unpaid family workers
2,429
735
Industries and Occupations
Houston’s primary industries include energy, aeronautics, and manufacturing with occupations ranging across various spectrums. Colorado Springs is known for its military installations and high-tech electronics industry, with major professions revolving around public service, IT, and healthcare.
Houston is internationally recognized for its healthcare, particularly the Texas Medical Center, the world’s largest medical complex. Colorado Springs also offers excellent healthcare services, with several highly-rated hospitals including the UCHealth Memorial Hospital Central.
Health (county statistics)
Type
Houston
Colorado Springs
General health status score of residents in this county from 1 (poor) to 5 (excellent)
As a larger city, Houston boasts a wide range of infrastructural amenities including multi-purpose sports arenas, comprehensive healthcare facilities, and a vast network of highways. Conversely, Colorado Springs is home to a less complex but certainly adequate infrastructure, anchored by its abundant outdoor recreational facilities.
Infrastructure
Type
Houston
Colorado Springs
Hospitals
156
10
TV stations
26
18
Arenas or stadiums
6
3
Bank branches located here
755
133
Bank institutions located here
81
33
Main business address for public companies
197
6
Drinking water stations with no reported violations in the past
49
6
Drinking water stations with reported violations in the past
HMDA - Conventional home purchase loans - Applications denied
Year
Houston
Colorado Springs
1999
9,163
1,957
2000
0
985
2001
0
756
2002
0
502
2003
8,173
1,131
2004
11,803
1,811
2005
15,127
2,631
2006
16,911
2,188
2007
10,643
1,246
2008
4,410
496
2009
2,279
233
Culture and Food
Houston is widely known for its diversity and multicultural vibe, reflected in its food, music, and art scenes. The city is a foodie paradise, with a mix of world cuisines available. Colorado Springs, while smaller in size, offers an array of cultural activities, especially for outdoors enthusiasts, and is home to a burgeoning food scene with a focus on locally sourced ingredients.
Sports Teams
Sports fans have plenty to cheer about in both cities. Houston is home to many professional sports teams including the Houston Texans in NFL, Astros in MLB, Rockets in NBA, and Dynamo in MLS. Colorado Springs doesn't have its own professional teams, but Denver's teams (Broncos-NFL, Nuggets-NBA, Avalanche-NHL, Rockies-MLB) are nearby.


 Houston, TX
 Colorado Springs, CO