Houston, Texas, and East Seattle, Washington, both have unique attractions and benefits for residents and visitors, but they also feature distinct differences in terms of safety, climate, cost of living, education, and more. The comparisons below highlight the features of each location, providing a comprehensive insight into each city's uniqueness, strength, opportunities, and challenges. The knowledge of these aspects can significantly support a decision to visit, live, or invest in these cities.
Houston has certain areas with higher crime rates but, like any major city, it also has safer neighborhoods, mostly in outer suburbs. Proactive policing strategies have been strategically deployed to curb crime rates. East Seattle, comparatively, has lower crime rates than Houston, making it a safer destination for both tourists and residents. There has been continued investment in community-focused policing to maintain these lower crime rates.
Cost of Living
The cost of living in Houston is significantly lower than in East Seattle. Housing, groceries, and other living essentials are generally less expensive in Houston. East Seattle, though pricier, offers a great quality of life. Its higher cost of living stems from the high demand for homes, driven largely by its booming tech industry.
Income Tax
Texas, and therefore Houston, does not impose an income tax. Washington state does not have a state income tax, which applies to East Seattle as well.
Property Tax
Houston's property tax rates are higher than the national average to compensate for the lack of income tax. In East Seattle, property taxes are also above the national average due to the high value of homes.
Sales Tax
Texas has a state sales tax rate of 6.25%, but Houston adds 2% for a total of 8.25%. Washington state's sales tax is 6.5%, but Seattle adds a 3.6% municipal tax, for a total of 10.1%.
Income
Type
Houston
East Seattle
Estimated median household income
$55,499
$135,835
Estimated per capita income
$36,265
$77,151
Cost of living index (U.S. average is 100)
97.2
128.6
If you make $50,000 in Houston, you will have to make $66,152 in East Seattle to maintain the same standard of living.
Geographical Conditions
Houston is mostly flat with bayous and is less than 50 miles from the Gulf of Mexico. East Seattle is geographically distinct with an abundance of beautiful lakes, waterfront properties, hills, and mountains in the surrounding areas.
Geographical information
Type
Houston
East Seattle
Land area
579.4 sq. miles
217.1 sq. miles
Population density
3,949.2 people per sq. mile
2,361.6 people per sq. mile
Relative area comparison
Houston, TX East Seattle, WA
Education
Both Houston and East Seattle have strong educational systems. While Houston is home to some of the best universities in Texas, East Seattle benefits from the wider Seattle area's high-quality schools and universities, including the University of Washington.
Houston's economy is diverse, with strong sectors in energy, aeronautics, and healthcare. East Seattle, while also diverse, leans more towards the technological sector, taking advantage of the larger Seattle area's status as a tech hub.
Biggest Employers
In Houston, the largest employers include Memorial Hermann Health System, Walmart, and H-E-B. In East Seattle, the presence of tech giants Microsoft and Amazon contributes to these firms being among the largest employers.
In Houston (Harris County), 49.4% voted for Democrats and 49.3% for Republicans in 2012 Presidential Election. In East Seattle (King County), 69.0% voted for Democrats and 28.5% for Republicans.
Elections
Type
Democrats
Republicans
Other
Year
Houston
East Seattle
Houston
East Seattle
Houston
East Seattle
2020
56.0%
75.1%
42.7%
22.3%
1.3%
2.6%
2016
54.0%
70.0%
41.6%
21.1%
4.4%
8.9%
2012
49.4%
69.0%
49.3%
28.5%
1.3%
2.5%
2008
50.5%
70.2%
48.9%
28.1%
0.6%
1.7%
2004
44.6%
65.1%
54.9%
33.8%
0.5%
1.1%
2000
43.0%
60.3%
54.4%
34.5%
2.6%
5.2%
1996
45.2%
56.4%
49.2%
31.4%
5.6%
12.2%
Breakdown of population affiliated with a religious congregation
Type
Adherents
Congregations
Religion
Houston
East Seattle
Houston
East Seattle
CATHOLIC CHURCH
18.1%
14.4%
3.6%
4.9%
SOUTHERN BAPTIST CONVENTION
14.2%
0.3%
26.8%
3.8%
MUSLIM ESTIMATE
2.9%
0.6%
1.6%
1.4%
EPISCOPAL CHURCH
1.0%
0.8%
1.4%
2.4%
LUTHERAN CHURCH
0.7%
0.5%
1.5%
2.0%
EVANGELICAL LUTHERAN CHURCH IN AMERICA
0.3%
1.3%
1.1%
4.7%
SEVENTH DAY ADVENTIST CHURCH
0.3%
0.6%
1.7%
2.3%
AMERICAN BAPTIST CHURCHES IN THE USA
0.0%
0.6%
0.1%
2.9%
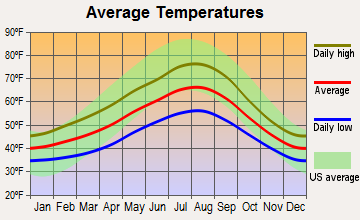
Weather
The weather in Houston is subtropical with hot, humid summers and mild winters, making it ideal for people who enjoy a warm climate. East Seattle, on the other hand, exhibits a temperate oceanic climate with cool, wet winters and mild, relatively dry summers. People who appreciate lush green landscapes and cooler temperatures might be drawn to East Seattle.
Weather and climate
Type
Houston
East Seattle
Temperature - Average
69.7°F
52.5°F
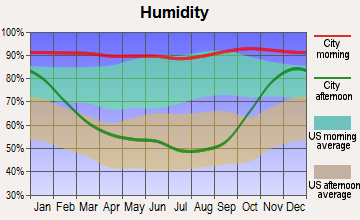
Humidity - Average morning or afternoon humidity
80.3%
78.5%
Humidity - Differences between morning and afternoon humidity
36.7%
38%
Humidity - Maximum monthly morning or afternoon humidity
92.8%
86%
Humidity - Minimum monthly morning or afternoon humidity
56.1%
48%
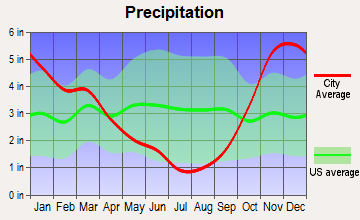
Precipitation - Yearly average
52.9 in
36.8 in
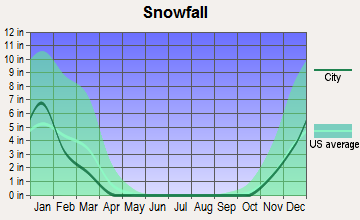
Snowfall - Yearly average
0.6 in
21.4 in
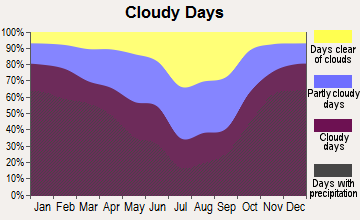
Clouds - Number of days clear of clouds
15%
11.7%
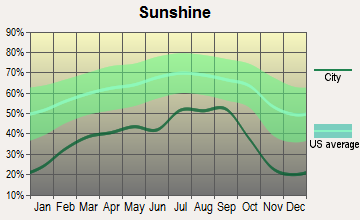
Sunshine amount - Average
60.4%
49.4%
Sunshine amount - Differences during a year
24%
44%
Sunshine amount - Maximum monthly
67%
64%
Sunshine amount - Minimum monthly
43%
20%
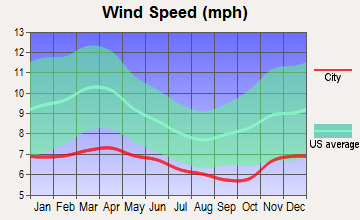
Wind speed - Average
8.2 mph
8.6 mph
Average climate in Houston, Texas
Average climate in East Seattle, Washington
Air pollution
Type
AQI
CO
NO2
OZONE
PB
PM10
PM25
SO2
Year
Houston
East Seattle
Houston
East Seattle
Houston
East Seattle
Houston
East Seattle
Houston
East Seattle
East Seattle
Houston
East Seattle
Houston
East Seattle
2018
102
85
0.19
0.21
9.2
10.6
21.5
21.0
N/A
N/A
N/A
N/A
10.0
5.1
0.3
0.7
2017
96
100
0.16
0.23
9.4
11.1
23.1
21.2
N/A
N/A
N/A
N/A
9.1
4.6
0.3
0.3
2016
91
67
0.16
0.22
10.4
11.9
22.7
20.2
N/A
N/A
N/A
N/A
8.6
3.8
0.2
0.6
2015
109
88
0.15
0.23
10.1
10.8
21.7
19.4
N/A
N/A
N/A
N/A
9.9
5.6
0.2
0.8
2014
98
75
0.24
0.24
10.4
11.5
21.8
19.5
N/A
N/A
N/A
N/A
10.2
5.7
0.3
N/A
2013
106
81
0.25
0.24
11.1
N/A
23.0
17.2
N/A
N/A
N/A
N/A
10.6
5.9
0.4
0.8
2012
115
83
0.25
0.23
11.6
N/A
23.8
19.3
N/A
N/A
N/A
N/A
11.1
5.2
0.5
1.0
2011
118
73
0.27
0.24
10.8
N/A
24.6
18.6
N/A
N/A
N/A
N/A
11.5
5.2
0.8
1.1
2010
110
73
0.25
0.24
12.8
N/A
22.8
18.0
N/A
N/A
N/A
N/A
11.4
4.4
1.1
1.1
2009
115
94
0.21
0.27
10.5
N/A
22.1
18.3
N/A
N/A
N/A
N/A
11.4
6.0
1.0
1.4
2008
105
80
0.30
0.30
13.1
N/A
22.1
17.8
0.006
N/A
N/A
N/A
12.4
5.4
1.3
1.3
2007
119
85
0.31
0.30
15.2
N/A
20.5
17.7
0.006
N/A
19.0
N/A
13.5
6.4
1.9
1.5
2006
134
102
0.32
N/A
14.6
N/A
22.3
18.4
0.006
N/A
21.1
N/A
13.0
7.2
2.3
N/A
2005
126
104
0.42
0.80
16.3
18.3
22.8
N/A
0.005
N/A
22.9
N/A
13.9
7.6
3.5
3.5
2004
137
110
0.44
0.81
17.7
17.9
20.4
N/A
0.010
N/A
N/A
N/A
N/A
8.3
3.2
3.0
2003
146
100
0.62
0.85
17.0
18.5
20.9
N/A
0.009
N/A
N/A
N/A
N/A
8.3
3.2
2.4
2002
128
90
0.55
1.07
16.1
19.3
19.7
N/A
0.007
N/A
N/A
N/A
N/A
10.7
1.7
2.7
2001
147
91
0.44
1.08
18.4
20.5
19.6
N/A
0.008
0.004
N/A
N/A
N/A
11.1
2.5
3.7
2000
136
99
0.50
1.21
17.0
20.9
22.0
N/A
0.008
N/A
N/A
N/A
N/A
12.1
3.1
3.2
Natural disasters
Type
Houston
East Seattle
Tornado activity compared to U.S. average
187.3%
5.5%
Earthquake activity compared to U.S. average
63.9%
1,403%
Natural disasters compared to U.S. average
32%
30%
Transportation
Houston offers METRO buses, a light rail system, and extensive highways. Traffic can be heavy in peak periods. East Seattle has public transit including buses and light rail, enhanced by bike lanes and foot-friendly infrastructure.
Transport
Type
Houston
East Seattle
Amtrak stations
1
0
Amtrak stations nearby
2
3
FAA registered aircraft
1
0
FAA registered aircraft manufacturers and dealers
44
0
Means of transportation to work
Type
Houston
East Seattle
Bicycle
0.5%
0.3%
Bus
2.4%
5%
Carpooled
11.1%
11%
Car alone
81.2%
76.3%
Motorcycle
0.1%
0.1%
Railroad
0.1%
0%
Taxicab
0.1%
0%
Walked
1.6%
1.7%
Average travel time to work
Type
Houston
East Seattle
Average
32 min
25 min
Real Estate
Real estate in Houston is more affordable than East Seattle. Housing prices in East Seattle are significantly higher, driven by the demand from high-tech workers in the region.
Neighborhoods
Houston's neighborhoods reflect its diverse population, from the eclectic Montrose to the upscale River Oaks. East Seattle boasts unique neighborhoods like Madison Park and Madrona, known for their beautiful waterfront homes and community feel.
Houses and residents
Type
Houston
East Seattle
Houses
1,028,763
199,933
Average household size (people)
2.6
2.5
Houses occupied
924,981 (89.9%)
191,630 (95.8%)
Houses occupied by owners
390,226 (42.2%)
128,209 (66.9%)
Houses occupied by renters
534,755 (57.8%)
63,421 (33.1%)
Median rent asked for vacant for-rent units
$1,323
$2,281
Median price asked for vacant for-sale houses and condos
$334,556
$820,468
Estimated median house or condo value
$236,700
$877,325
Median number of rooms in apartments
3.5
3.5
Median number of rooms in houses and condos
6.1
7.8
Housing density (houses/condos per square mile)
1,775.5
920.9
Household income disparities
49%
34.9%
Housing units without a mortgage
4,386 (2.1%)
22,582 (20.8%)
Housing units with both a second mortgage and home equity loan
7,696 (3.6%)
352 (0.3%)
Housing units with a mortgage
207,809 (97.9%)
85,751 (79.2%)
Housing units with a home equity loan
421 (0.2%)
11,674 (10.8%)
Housing units with a second mortgage
11,969 (5.6%)
9,796 (9%)
Housing units lacking complete kitchen facilities
2.4%
0.8%
Housing units lacking complete plumbing facilities
Self-employed workers in own not incorporated business
75,956
16,907
State government workers
38,359
10,270
Unpaid family workers
2,429
584
Industries and Occupations
Houston is renowned for its energy industry, particularly oil and natural gas. Additionally, biomedical research and aeronautics are significant. The primary occupations in East Seattle revolve around technology, professional services, and healthcare.
Both cities boast highly rated healthcare facilities. Houston is home to the Texas Medical Center, the world's largest medical complex, while East Seattle has access to top-notch healthcare facilities in the Seattle metropolitan area.
Health (county statistics)
Type
Houston
East Seattle
General health status score of residents in this county from 1 (poor) to 5 (excellent)
Both cities have developed infrastructures. Houston's size and economic relevance have led to extensive road and freeway networks maintaining logistical flow. East Seattle, smaller in land area, benefits from a more contained, less spread-out infrastructure, making for a more easily navigable city.
Infrastructure
Type
Houston
East Seattle
TV stations
26
16
Schools
School facilities
Type
Houston
East Seattle
Private elementary/middle schools
104
1
Private high schools
50
1
Public elementary/middle schools
546
2
Public high schools
167
2
Colleges/Universities
73
0
Culture and Food
Houston's culture is a blend of Southern charm and modern city life, reflected in its food. East Seattle, part of a bigger metropolitan area, also offers a diverse food culture, with seafood standing out due to its geographical location and access to fresh produce.
Sports Teams
Houston boasts professional teams in football (Texans), baseball (Astros), and basketball (Rockets). East Seattle supports Seattle's professional teams, including the Seahawks (NFL), Mariners (MLB), and Sounders (MLS).
 Houston, TX
 East Seattle, WA