Baton Rouge, Louisiana and Jacksonville, Florida are two vibrant Southeastern U.S. cities with distinct characteristics. Baton Rouge is known for its unique culture with a strong French influence, abundant food, festivals, and home to Louisiana State University, while Jacksonville is recognized for its unique geography, miles of beaches, and a slow-paced life. Comparing them head-to-head involves looking at several factors including their crime rates, weather, cost of living, education, and many others, which will be discussed in detail below.
Distance between
Jacksonville, FL and
Baton Rouge, LA : 564.9 miles
Jacksonville's population is larger by 330%. Its population has grown by 218,997 people (29.8%) since 2000. The population of Baton Rouge has decreased by 5,633 people (2.5%) during that time.
Statistically, Jacksonville has a higher crime rate compared to Baton Rouge. However, these statistics frequently vary by neighborhood. As for personal and property safety, residents and visitors are encouraged to stay mindful in both cities like any other urban areas.
Cost of Living
The overall cost of living in Jacksonville is lower compared to Baton Rouge. This primarily boils down to lower housing costs in Jacksonville. Other costs, including groceries, healthcare, utilities, and transportation, are also typically lower in Jacksonville.
Income Tax
Jacksonville residents benefit from Florida's lack of a state income tax. Baton Rouge residents, however, are subject to Louisiana's state income tax, which ranges from 2% to 6% based on income.
Property Tax
Both cities have similar property tax rates. In Baton Rouge, the property tax rate is around 0.52%, while Jacksonville is slightly higher at around 0.94%.
Sales Tax
Florida does not have a state income tax, which can be financially beneficial for Jacksonville residents. Louisiana, however, does collect state income tax, which adds to the financial burden for Baton Rouge residents. The state sales tax in Florida is 6%, while it’s higher in Louisiana at 4.45%.
Income
Type
Jacksonville
Baton Rouge
Estimated median household income
$58,621
$41,257
Estimated per capita income
$32,953
$28,621
Cost of living index (U.S. average is 100)
88.3
90.2
If you make $50,000 in Jacksonville, you will have to make $51,076 in Baton Rouge to maintain the same standard of living.
Geographical Conditions
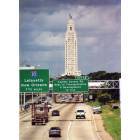
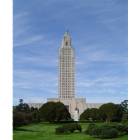
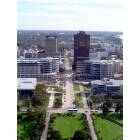
Jacksonville is located on the northeastern coast of Florida, boasting beautiful beaches. Baton Rouge, located along the Mississippi River, doesn't share the beachfront luxury but has attractive lakefront and riverfront settings.
Jacksonville is home to several higher-learning institutions, including Jacksonville University and the University of North Florida. On the other hand, Baton Rouge is home to Louisiana State University. Both offer a variety of public and private school options for K-12 students. The quality of education varies greatly, largely depending on the specific district.
Jacksonville has more diversified economy sectors like banking, logistics, healthcare, and insurance, providing more job opportunities. Baton Rouge has a strong economy based on the oil and petrochemical industry, but its economy isn't as diverse.
Biggest Employers
The largest employer in Baton Rouge is the State of Louisiana, followed by Louisiana State University and Blue Cross Blue Shield of Louisiana. In Jacksonville, Naval Air Station Jacksonville, Duval County Public Schools, and the City of Jacksonville are the biggest employers.
There were 1,310 building permits issued in Jacksonville in 2012 (353 more than in 2011) compared to 266 building permits issued in Baton Rouge in 2012 (135 more than in 2011).
In Jacksonville (Duval County), 47.9% voted for Democrats and 51.5% for Republicans in 2012 Presidential Election. In Baton Rouge (East Baton Rouge Parish), 52.0% voted for Democrats and 46.7% for Republicans.
Elections
Type
Democrats
Republicans
Other
Year
Jacksonville
Baton Rouge
Jacksonville
Baton Rouge
Jacksonville
Baton Rouge
2020
51.3%
55.8%
47.5%
42.7%
1.2%
1.5%
2016
47.2%
52.6%
48.6%
43.3%
4.2%
4.1%
2012
47.9%
52.0%
51.5%
46.7%
0.6%
1.3%
2008
49.0%
50.7%
51.0%
48.5%
0.0%
0.8%
2004
41.7%
45.0%
57.9%
54.7%
0.3%
0.3%
2000
40.9%
45.4%
57.7%
52.9%
1.4%
1.7%
1996
44.2%
74.9%
50.0%
22.4%
5.8%
2.7%
Breakdown of population affiliated with a religious congregation
Type
Adherents
Congregations
Religion
Jacksonville
Baton Rouge
Jacksonville
Baton Rouge
SOUTHERN BAPTIST CONVENTION
15.8%
12.1%
22.3%
16.1%
CATHOLIC CHURCH
9.0%
22.2%
2.8%
5.5%
EPISCOPAL CHURCH
1.2%
1.3%
2.3%
2.1%
MUSLIM ESTIMATE
0.7%
0.3%
0.6%
1.1%
SEVENTH DAY ADVENTIST CHURCH
0.3%
0.3%
1.4%
1.1%
AMERICAN BAPTIST CHURCHES IN THE USA
0.1%
0.5%
0.2%
0.5%
Weather
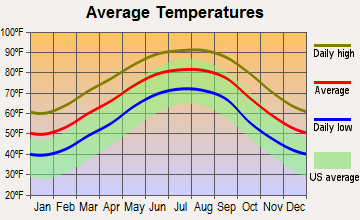
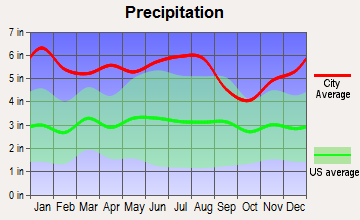
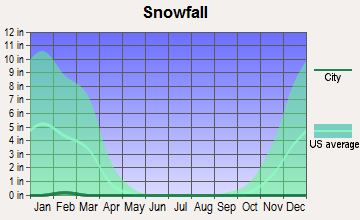
Jacksonville’s weather is humid subtropical, characterized by hot, damp summers and mild to cool winters. On the other hand, Baton Rouge also has a humid subtropical climate with short, mild winters and long, hot, and humid summers. Baton Rouge encounters more rainfall throughout the year compared to Jacksonville.
Weather and climate
Type
Jacksonville
Baton Rouge
Temperature - Average
68.3°F
67°F
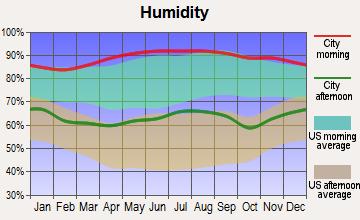
Humidity - Average morning or afternoon humidity
78.4%
80%
Humidity - Differences between morning and afternoon humidity
44%
39%
Humidity - Maximum monthly morning or afternoon humidity
92%
93%
Humidity - Minimum monthly morning or afternoon humidity
48%
54%
Precipitation - Yearly average
51.8 in
64.4 in
Snowfall - Yearly average
0 in
0.4 in
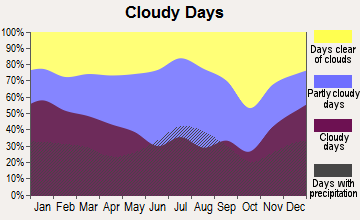
Clouds - Number of days clear of clouds
15.8%
16.5%
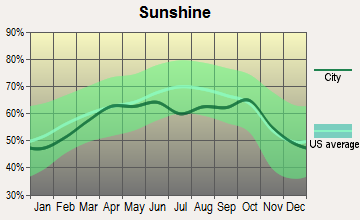
Sunshine amount - Average
69.6%
64.3%
Sunshine amount - Differences during a year
16%
22.5%
Sunshine amount - Maximum monthly
74%
70.4%
Sunshine amount - Minimum monthly
58%
47.9%
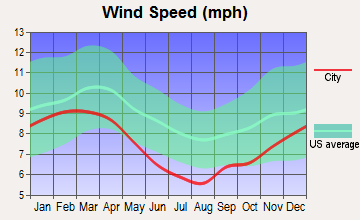
Wind speed - Average
7.2 mph
6.9 mph
Average climate in Jacksonville, Florida
Average climate in Baton Rouge, Louisiana
Air pollution
Type
AQI
CO
NO2
OZONE
PB
PM10
PM25
SO2
Year
Jacksonville
Baton Rouge
Jacksonville
Baton Rouge
Baton Rouge
Jacksonville
Baton Rouge
Jacksonville
Baton Rouge
Jacksonville
Baton Rouge
Jacksonville
Baton Rouge
2018
78
92
N/A
0.20
10.1
N/A
24.5
22.6
N/A
N/A
26.9
N/A
7.1
10.4
N/A
0.6
2017
74
82
N/A
0.21
10.2
N/A
24.7
25.3
N/A
N/A
22.5
N/A
5.8
10.3
0.7
0.4
2016
65
78
0.50
0.22
10.6
N/A
24.9
23.0
N/A
N/A
25.5
N/A
5.2
11.4
0.4
1.1
2015
63
97
0.35
0.22
9.4
N/A
25.4
24.1
N/A
N/A
26.2
N/A
4.9
12.1
0.3
1.1
2014
66
91
0.27
0.26
10.3
N/A
24.3
23.6
N/A
N/A
24.1
N/A
5.9
10.0
0.7
1.2
2013
68
90
0.18
0.20
9.7
N/A
23.0
24.2
N/A
N/A
23.1
N/A
5.3
10.0
0.7
0.6
2012
66
96
0.10
0.22
10.9
N/A
24.0
25.5
N/A
N/A
25.3
N/A
5.8
10.3
0.6
0.8
2011
88
104
0.28
0.22
11.4
N/A
26.6
25.8
N/A
N/A
33.2
N/A
8.1
12.6
0.8
1.3
2010
77
112
0.31
0.25
12.0
N/A
26.4
25.9
N/A
N/A
28.2
N/A
7.1
10.5
0.8
1.3
2009
72
97
0.16
0.22
11.7
N/A
25.0
23.0
N/A
N/A
26.1
N/A
8.5
9.2
0.6
1.9
2008
75
99
0.15
0.28
12.8
N/A
27.6
22.3
N/A
N/A
N/A
N/A
10.0
10.9
0.9
2.5
2007
92
115
0.29
0.38
14.3
N/A
28.4
23.0
N/A
N/A
N/A
N/A
11.4
12.2
1.2
2.6
2006
87
120
0.35
0.34
14.6
N/A
29.0
23.4
N/A
N/A
N/A
N/A
10.8
12.7
1.4
3.6
2005
93
122
0.42
0.41
15.5
N/A
26.5
24.7
N/A
N/A
N/A
N/A
12.2
13.1
1.8
4.4
2004
92
106
0.40
0.56
15.4
N/A
25.2
22.8
N/A
N/A
N/A
N/A
12.4
12.1
1.4
3.5
2003
55
124
0.43
0.66
16.0
N/A
21.6
21.5
N/A
N/A
N/A
N/A
N/A
11.0
1.6
3.4
2002
59
104
0.49
0.70
16.2
N/A
22.2
21.8
0.003
N/A
N/A
N/A
N/A
9.7
1.7
2.7
2001
74
109
0.49
0.82
16.6
N/A
24.0
23.5
0.009
N/A
N/A
N/A
N/A
9.6
2.5
3.7
2000
85
135
0.52
0.76
16.9
N/A
25.1
24.0
0.017
N/A
N/A
N/A
N/A
11.0
3.0
3.7
Natural disasters
Type
Jacksonville
Baton Rouge
Tornado activity compared to U.S. average
75.2%
167.3%
Earthquake activity compared to U.S. average
18.1%
54.9%
Natural disasters compared to U.S. average
24%
28%
Transportation
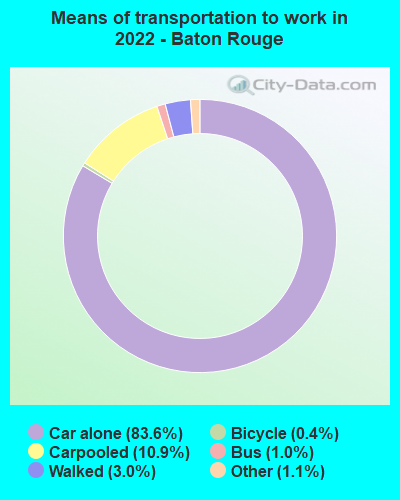
Jacksonville has a larger public transportation system through Jacksonville Transportation Authority. On the other hand, Baton Rouge's Capital Area Transit System is smaller but serves all the key areas of the city. Both cities are car-centric, with the majority of people commuting by car.
Transport
Type
Jacksonville
Baton Rouge
Amtrak stations
1
1
Amtrak stations nearby
1
1
FAA registered aircraft
566
320
FAA registered aircraft manufacturers and dealers
34
10
Means of transportation to work
Type
Jacksonville
Baton Rouge
Bicycle
0.2%
0.6%
Bus
1.1%
1.1%
Carpooled
9%
9.1%
Car alone
86.5%
87.9%
Motorcycle
0.2%
0.1%
Taxicab
0.2%
0%
Walked
1.2%
0.7%
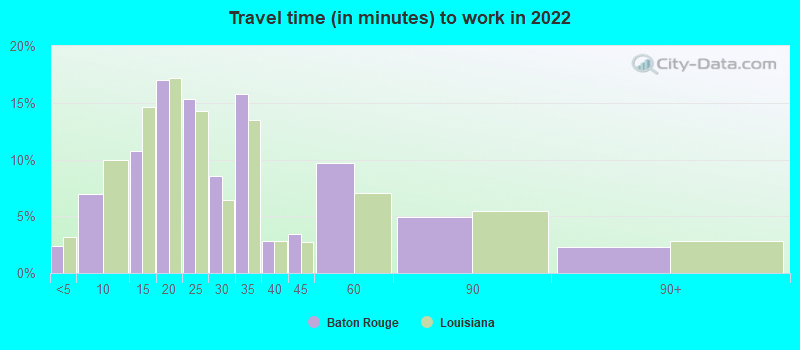
Average travel time to work
Type
Jacksonville
Baton Rouge
Average
27.5 min
30.9 min
Other means
25 min
21.2 min
Public transportation
43.7 min
41.8 min
Private vehicle occupancy
Type
Jacksonville
Baton Rouge
Average
1.1
1.2
Drove alone
89.4%
88.2%
In 2 person carpool
8%
8.3%
In 3 person carpool
1.7%
1%
In 4 person carpool
0.7%
1.7%
In 5-6 person carpool
0%
0.2%
In 7+ person carpool
0.2%
0.6%
How many people usually rode to work in the car, truck or van.
Real Estate
Real estate is generally cheaper in Jacksonville than in Baton Rouge. Both cities, however, offer a variety of housing options from downtown apartments to suburban homes.
Neighborhoods
Both cities offer diverse neighborhoods ranging from bustling downtown areas to quiet residential suburbs. Baton Rouge’s Garden District and Spanish Town offer historic and quaint homes, while Jacksonville’s Riverside and San Marco are trendy neighborhoods with lots of shopping and dining.
Houses and residents
Type
Jacksonville
Baton Rouge
Houses
422,315
107,002
Average household size (people)
2.5
2.4
Median year apartment built
1985
1979
Median year house/condo built
1987
1971
Length of stay in the house since moving in
12.5 years
14.8 years
Houses occupied
386,283 (91.5%)
87,440 (81.7%)
Houses occupied by owners
226,429 (58.6%)
41,267 (47.2%)
Houses occupied by renters
159,854 (41.4%)
46,173 (52.8%)
Median rent asked for vacant for-rent units
$1,444
$1,167
Median monthly housing costs
$1,154
$938
Median price asked for vacant for-sale houses and condos
$260,045
$351,611
Estimated median house or condo value
$239,400
$199,600
Median numbers of rooms
5.6
4.9
Median number of rooms in apartments
4.3
4
Median number of rooms in houses and condos
6.3
6.6
Median house price - detached houses
$282,276
$277,211
Median house price - in 2-unit structures
$177,341
$80,632
Median house price - in 3-to-4-unit structures
$144,947
$204,273
Median house price - in 5 or more unit structures
$220,508
$162,691
Median house price - mobile homes
$87,589
$36,615
Median house price - Townhouses or other attached units
$213,709
$190,008
Median house price - All housing units
$266,926
$270,567
Median house age
36
47
Renting percentage
38.3%
50.7%
Housing density (houses/condos per square mile)
557.4
1,392.5
House value disparities
33.2%
39.7%
Household income disparities
44.2%
52.9%
Median household income for houses/condes with a mortgage
$83,160
$85,373
Median household income for apartments without a mortgage
$59,777
$51,524
Housing units without a mortgage
2,439 (1.6%)
607 (2.5%)
Housing units with both a second mortgage and home equity loan
8,460 (5.5%)
1,424 (6%)
Housing units with a mortgage
150,468 (98.4%)
23,275 (97.5%)
Housing units with a home equity loan
255 (0.2%)
140 (0.6%)
Housing units with a second mortgage
11,378 (7.4%)
1,954 (8.2%)
House/condo owner moved in on average (years ago)
10
14
House/condo renter moved in on average (years ago)
1
1
Housing units lacking complete kitchen facilities
1.5%
6.1%
Housing units lacking complete plumbing facilities
1.4%
5.2%
Housing units in structures
Housing units in structures
Jacksonville
Baton Rouge
One, detached
59.4%
55.3%
One, attached
6.1%
3.3%
Two
2.1%
3.5%
3 or 4
5.3%
5.6%
5 to 9
5.0%
7.5%
10 to 19
7.9%
9.4%
20 to 49
4.9%
7.0%
50 or more
5.3%
7.9%
Mobile homes
3.8%
0.4%
Boats, RVs, vans, etc.
0.2%
0.0%
Median real estate property taxes paid for housing units
Self-employed workers in own not incorporated business
19,601
5,415
State government workers
13,692
9,361
Unpaid family workers
1,066
351
Industries and Occupations
Baton Rouge’s economy is primarily driven by petrochemical manufacturing and oil refining. In contrast, Jacksonville’s diverse economy covers industries such as finance, insurance, healthcare, and logistics.
Both cities offer a range of healthcare facilities. Jacksonville hosts the Mayo Clinic and Baptist Medical Center, while Baton Rouge houses Our Lady of the Lake Regional Medical Center and Baton Rouge General Medical Center.
Health (county statistics)
Type
Jacksonville
Baton Rouge
General health status score of residents in this county from 1 (poor) to 5 (excellent)
Both cities have well-developed infrastructures. Jacksonville, however, has a slight advantage due to its location as a major port city, which provides it with more extensive transportation and logistics facilities.
Infrastructure
Type
Jacksonville
Baton Rouge
Hospitals
25
95
TV stations
17
16
Arenas or stadiums
2
2
Bank branches located here
191
145
Bank institutions located here
31
29
Main business address for public companies
23
4
Drinking water stations with no reported violations in the past
20
8
Drinking water stations with reported violations in the past
HMDA - Conventional home purchase loans - Applications denied
Year
Jacksonville
Baton Rouge
1999
5,422
728
2000
4,132
592
2001
3,038
495
2002
2,017
472
2003
3,563
472
2004
4,781
757
2005
7,134
1,088
2006
8,812
1,139
2007
5,298
717
2008
1,719
348
2009
676
176
Culture and Food
Baton Rouge offers a vibrant culture with its French/Cajun influences. The food scene in Baton Rouge is heavily influenced by its cultural mix with Creole and Cajun dishes being local favorites. Meanwhile, Jacksonville offers a blend of southern charm and beach town lifestyle, with a food scene that includes fresh seafood, southern barbeque, and multicultural foods.
Sports Teams
For sports fans, Jacksonville is home to the Jacksonville Jaguars (NFL). Baton Rouge, on the other hand, has no professional sports teams but is home to the highly competitive Louisiana State University Tigers college football team.


 Jacksonville, FL
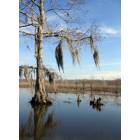
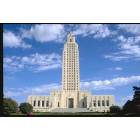
 Baton Rouge, LA