


Relative area comparison
 Jacksonville, FL
 Fayetteville, NC

 | Demographics Thread - 2023 (194 replies) |
| Top 200 Most Influential Urban Areas in the USA (186 replies) |
| Control city on highway signs in your state (224 replies) |
| Top 200 Most Influential USA Urban Areas (NOT City Proper) (202 replies) |
| Is Virginia more similar to Pennsylvania or North Carolina (107 replies) |
| Southern City Tiers (1022 replies) |
Jacksonville, FL and
Fayetteville, NC : 364.6 miles
Jacksonville's population is larger by 357%. Its population has grown by 218,997 people (29.8%) since 2000. The population of Fayetteville has grown by 87,763 people (72.5%) during that time.
| Population | ||
| Type | Jacksonville | Fayetteville |
|---|---|---|
| Population | 954,614 | 208,778 |
| Female / male percentage | 51.4% / 48.6%
|
49.8% / 50.2%
|
| Income | ||
| Type | Jacksonville | Fayetteville |
|---|---|---|
| Estimated median household income | $58,621 | $51,629 |
| Estimated per capita income | $32,953 | $27,983 |
| Cost of living index (U.S. average is 100) | 88.3 | 88.7 |
If you make $50,000 in Jacksonville, you will have to make $50,227 in Fayetteville to maintain the same standard of living.
| Geographical information | ||
| Type | Jacksonville | Fayetteville |
|---|---|---|
| Land area | 757.7 sq. miles | 58.8 sq. miles |
| Population density | 1,259.9 people per sq. mile | 3,552.6 people per sq. mile |
| Elevation | 12 feet | 240 feet |
Jacksonville, FL
Fayetteville, NC
| Education level (25-year-olds and older) | ||
| Type | Jacksonville | Fayetteville |
|---|---|---|
| Bachelor's degree or higher | 32.3% | 29.3% |
| Graduate or professional degree | 10.5% | 11.2% |
| High school or higher | 90.8% | 93.9% |
There were 1,310 building permits issued in Jacksonville in 2012 (353 more than in 2011) compared to 337 building permits issued in Fayetteville in 2012 (181 less than in 2011).
In Jacksonville (Duval County), 47.9% voted for Democrats and 51.5% for Republicans in 2012 Presidential Election. In Fayetteville (Cumberland County), 59.5% voted for Democrats and 39.8% for Republicans.
| Weather and climate | ||
| Type | Jacksonville | Fayetteville |
|---|---|---|
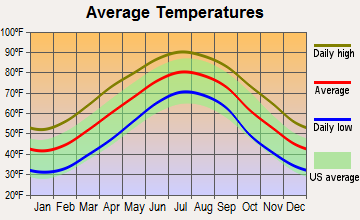
| Temperature - Average | 68.3°F | 61.4°F |
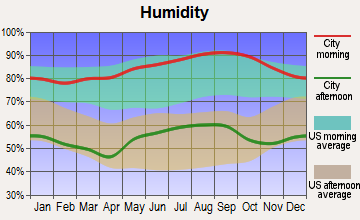
| Humidity - Average morning or afternoon humidity | 78.4% | 74.1% |
| Humidity - Differences between morning and afternoon humidity | 44% | 42.8% |
| Humidity - Maximum monthly morning or afternoon humidity | 92% | 89.5% |
| Humidity - Minimum monthly morning or afternoon humidity | 48% | 46.7% |
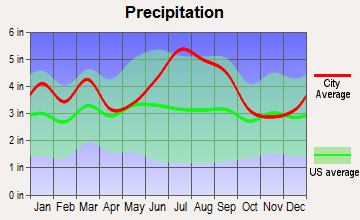
| Precipitation - Yearly average | 51.8 in | 46.8 in |
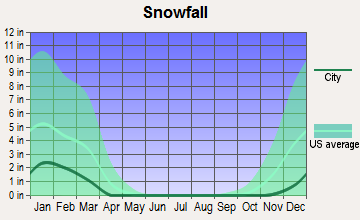
| Snowfall - Yearly average | 0 in | 11.3 in |
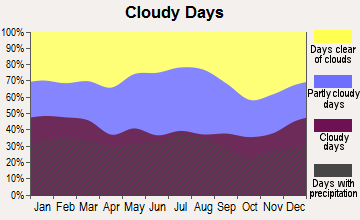
| Clouds - Number of days clear of clouds | 15.8% | 18.4% |
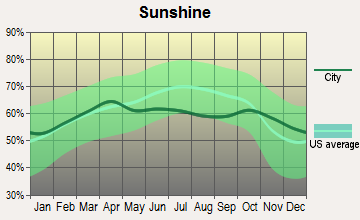
| Sunshine amount - Average | 69.6% | 64.9% |
| Sunshine amount - Differences during a year | 16% | 13.1% |
| Sunshine amount - Maximum monthly | 74% | 65.7% |
| Sunshine amount - Minimum monthly | 58% | 52.6% |
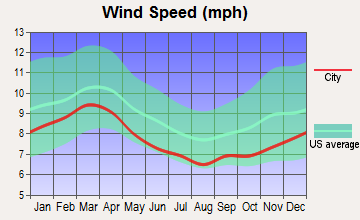
| Wind speed - Average | 7.2 mph | 7.5 mph |
| Natural disasters | ||
| Type | Jacksonville | Fayetteville |
|---|---|---|
| Tornado activity compared to U.S. average | 75.2% | 112.7% |
| Earthquake activity compared to U.S. average | 18.1% | 49.2% |
| Natural disasters compared to U.S. average | 24% | 15% |
| Transport | ||
| Type | Jacksonville | Fayetteville |
|---|---|---|
| Amtrak stations | 1 | 1 |
| Amtrak stations nearby | 1 | 1 |
| FAA registered aircraft | 566 | 110 |
| FAA registered aircraft manufacturers and dealers | 34 | 4 |
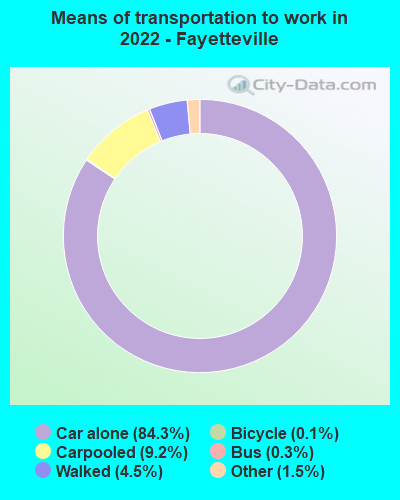
| Means of transportation to work | ||
| Type | Jacksonville | Fayetteville |
|---|---|---|
| Bicycle | 0.2% | 0.1% |
| Bus | 1.1% | 0.3% |
| Carpooled | 9% | 6.5% |
| Car alone | 86.5% | 87.8% |
| Motorcycle | 0.2% | 0.3% |
| Taxicab | 0.2% | 0.2% |
| Walked | 1.2% | 4% |
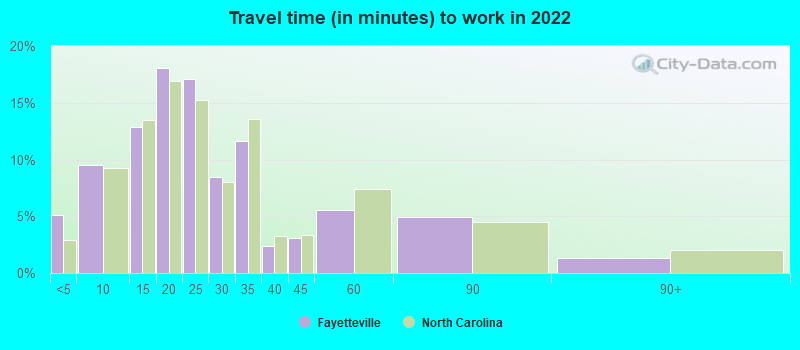
| Average travel time to work | ||
| Type | Jacksonville | Fayetteville |
|---|---|---|
| Average | 27.5 min | 24.4 min |
| Other means | 25 min | 21 min |
| Public transportation | 43.7 min | 42.6 min |
| Private vehicle occupancy | ||
| Type | Jacksonville | Fayetteville |
|---|---|---|
| Average | 1.1 | 1.1 |
| Drove alone | 89.4% | 90.8% |
| In 2 person carpool | 8% | 7% |
| In 3 person carpool | 1.7% | 1.8% |
| In 4 person carpool | 0.7% | 0.1% |
| In 7+ person carpool | 0.2% | 0.2% |
How many people usually rode to work in the car, truck or van.
| Houses and residents | ||
| Type | Jacksonville | Fayetteville |
|---|---|---|
| Houses | 422,315 | 91,054 |
| Average household size (people) | 2.5 | 2.5 |
| Median year apartment built | 1985 | 1987 |
| Median year house/condo built | 1987 | 1982 |
| Length of stay in the house since moving in | 12.5 years | 13.6 years |
| Houses occupied | 386,283 (91.5%) | 83,147 (91.3%) |
| Houses occupied by owners | 226,429 (58.6%) | 38,079 (45.8%) |
| Houses occupied by renters | 159,854 (41.4%) | 45,068 (54.2%) |
| Median rent asked for vacant for-rent units | $1,444 | $571.42 |
| Median monthly housing costs | $1,154 | $1,041 |
| Median price asked for vacant for-sale houses and condos | $260,045 | $86,536 |
| Estimated median house or condo value | $239,400 | $150,200 |
| Median numbers of rooms | 5.6 | 5.4 |
| Median number of rooms in apartments | 4.3 | 4.4 |
| Median number of rooms in houses and condos | 6.3 | 6.4 |
| Median house price - detached houses | $282,276 | $214,819 |
| Median house price - in 2-unit structures | $177,341 | $152,480 |
| Median house price - in 3-to-4-unit structures | $144,947 | $234,147 |
| Median house price - in 5 or more unit structures | $220,508 | $194,723 |
| Median house price - mobile homes | $87,589 | $98,029 |
| Median house price - Townhouses or other attached units | $213,709 | $236,623 |
| Median house price - All housing units | $266,926 | $214,671 |
| Median house age | 36 | 38 |
| Renting percentage | 38.3% | 49.7% |
| Housing density (houses/condos per square mile) | 557.4 | 1,549.4 |
| House value disparities | 33.2% | 32.9% |
| Household income disparities | 44.2% | 43.4% |
| Median household income for houses/condes with a mortgage | $83,160 | $73,385 |
| Median household income for apartments without a mortgage | $59,777 | $56,188 |
| Housing units without a mortgage | 2,439 (1.6%) | 726 (2.8%) |
| Housing units with both a second mortgage and home equity loan | 8,460 (5.5%) | 593 (2.3%) |
| Housing units with a mortgage | 150,468 (98.4%) | 25,293 (97.2%) |
| Housing units with a home equity loan | 255 (0.2%) | 67 (0.3%) |
| Housing units with a second mortgage | 11,378 (7.4%) | 1,240 (4.8%) |
| House/condo owner moved in on average (years ago) | 10 | 12 |
| House/condo renter moved in on average (years ago) | 1 | 1 |
| Housing units lacking complete kitchen facilities | 1.5% | 1.1% |
| Housing units lacking complete plumbing facilities | 1.4% | 1.6% |
| Median real estate property taxes paid for housing units | ||
| Type | Jacksonville | Fayetteville |
|---|---|---|
| With mortgages | $1,976 (0.8%) | $1,837 (1.1%) |
| With no mortgages | $1,563 (0.7%) | $1,519 (1.3%) |
| Health (county statistics) | ||
| Type | Jacksonville | Fayetteville |
|---|---|---|
| General health status score of residents in this county from 1 (poor) to 5 (excellent) | 3.4 | 3.3 |
| Average weight of females (lbs) | 163.1 lbs | 165.3 lbs |
| Average weight of males (lbs) | 198.5 lbs | 197.2 lbs |
| Residents visited a dentist within the past year | 64.1% | 67.7% |
| Residents exercised in the past month | 69.2% | 72.6% |
| Adult residents drank alcohol in the past 30 days | 52.3% | 74.9% |
| Residents smoked 100+ cigarettes in their lives | 46.4% | 47.7% |
| English speakers (speaking English at home) | ||
| Type | Jacksonville | Fayetteville |
|---|---|---|
| Born in the United States residents | 94.4% | 91.3% |
| Foreign born residents | 22.4% | 28.7% |
| Native, born elsewhere residents | 47.2% | 52.3% |
| Total residents | 84.3% | 86.1% |
| Infrastructure | ||
| Type | Jacksonville | Fayetteville |
|---|---|---|
| Hospitals | 25 | 16 |
| TV stations | 17 | 19 |
| Arenas or stadiums | 2 | 1 |
| Bank branches located here | 191 | 50 |
| Bank institutions located here | 31 | 13 |
| Drinking water stations with no reported violations in the past | 20 | 4 |
| Drinking water stations with reported violations in the past | 20 | 20 |