Jacksonville, FL and Hialeah, FL are two prominent cities in the state of Florida but offer different living experiences. Jacksonville is the largest city in the state with a diversified economy, while Hialeah is part of the Miami metropolitan area with a Cuban-American majority. Both cities offer year-round warm climates, various industries, and cultural events making them attractive to both residents and tourists. This comprehensive comparison will guide you through various aspects of life in both cities.
Distance between
Jacksonville, FL and
Hialeah, FL : 319.1 miles
Jacksonville's population is larger by 333%. Its population has grown by 218,997 people (29.8%) since 2000. The population of Hialeah has decreased by 5,929 people (2.6%) during that time.
Comparatively, Jacksonville has a higher crime rate than Hialeah. Jacksonville's crime rate is higher than 64% of Florida's cities and towns, while Hialeah's crime rate is lower than many cities in Florida. It's vital for both residents planning to relocate and tourists visiting to stay informed about safety measures, especially in Jacksonville. Jacksonville has been putting a lot of effort into increasing safety standards, while Hialeah is generally safer with continual law enforcement presence.
Cost of Living
The cost of living in Hialeah is higher than in Jacksonville. This includes factors like housing, groceries, utilities, and transportation. Jacksonville offers a more affordable cost of living, which might be particularly appealing for those considering relocation. It's crucial for both tourists and potential relocatees to consider these factors when budgeting for their trips or potential relocation.
Income Tax
Florida is one of the few states that do not impose an income tax - this applies to both Jacksonville and Hialeah.
Property Tax
The average property tax rate is slightly higher in Hialeah compared to Jacksonville. This could affect both potential buyers and renters as landlords often pass these costs on to tenants in the form of higher rent.
Sales Tax
The overall sales tax rate is 7% in Jacksonville and 7% in Hialeah. Neither city has a separate city tax, relying instead on the Florida state sales tax.
Income
Type
Jacksonville
Hialeah
Estimated median household income
$58,621
$46,674
Estimated per capita income
$32,953
$21,712
Cost of living index (U.S. average is 100)
88.3
107
If you make $50,000 in Jacksonville, you will have to make $60,589 in Hialeah to maintain the same standard of living.
Geographical Conditions
Jacksonville is located where St. John’s River meets the Atlantic Ocean, providing access to numerous beaches and waterways. Hialeah is characterized by its relatively flat terrain and proximity to the Everglades.
The education systems in both cities are under the Florida Department of Education. Jacksonville is home to more than a few higher-education institutions including the University of North Florida and Jacksonville University. Hialeah, on the other hand, offers institutions like the Miami Dade College's Hialeah Campus. Both cities offer a multitude of public and private schooling options.
The Jacksonville economy is highly diversified with major sectors including transportation, logistics, health care, banking, and defense. In contrast, Hialeah's economy is more focused on manufacturing and retail trade. Job growth is higher in Jacksonville, potentially offering more opportunities for those looking to relocate for work.
Biggest Employers
The biggest employer in Jacksonville is the naval air station, along with several health systems like Baptist Health and UF Health Jacksonville. In Hialeah, the biggest employers are the Publix Supermarket company, and Palmetto General Hospital.
There were 1,310 building permits issued in Jacksonville in 2012 (353 more than in 2011) compared to 2 building permits issued in Hialeah in 2012 (15 less than in 2011).
In Jacksonville (Duval County), 47.9% voted for Democrats and 51.5% for Republicans in 2012 Presidential Election. In Hialeah (Miami-Dade County), 61.8% voted for Democrats and 38.0% for Republicans.
Elections
Type
Democrats
Republicans
Other
Year
Jacksonville
Hialeah
Jacksonville
Hialeah
Jacksonville
Hialeah
2020
51.3%
53.5%
47.5%
46.2%
1.2%
0.3%
2016
47.2%
63.4%
48.6%
33.9%
4.2%
2.7%
2012
47.9%
61.8%
51.5%
38.0%
0.6%
0.3%
2008
49.0%
58.1%
51.0%
41.9%
0.0%
0.0%
2004
41.7%
53.0%
57.9%
46.7%
0.3%
0.3%
2000
40.9%
52.7%
57.7%
46.4%
1.4%
0.9%
1996
44.2%
57.3%
50.0%
37.9%
5.8%
4.8%
Breakdown of population affiliated with a religious congregation
Type
Adherents
Congregations
Religion
Jacksonville
Hialeah
Jacksonville
Hialeah
SOUTHERN BAPTIST CONVENTION
15.8%
3.2%
22.3%
21.8%
CATHOLIC CHURCH
9.0%
21.8%
2.8%
4.5%
EPISCOPAL CHURCH
1.2%
0.5%
2.3%
2.1%
MUSLIM ESTIMATE
0.7%
0.9%
0.6%
1.0%
SEVENTH DAY ADVENTIST CHURCH
0.3%
1.1%
1.4%
4.3%
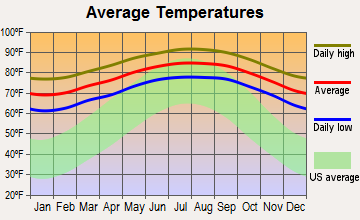
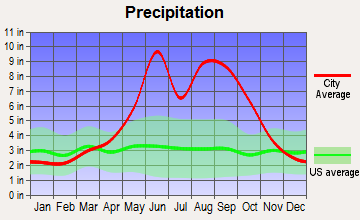
Weather
The weather is pretty similar in both cities, as they are located in Florida – known for its subtropical climate. Jacksonville, however, being further north, can see slightly colder temperatures in the winter. Hialeah enjoys warm winters due to its southerly location. Both cities experience a good deal of rainfall, with the wettest season being in the summer. Tourists and potential residents should be prepared for hurricanes during the late summer and early fall.
Weather and climate
Type
Jacksonville
Hialeah
Temperature - Average
68.3°F
77.9°F
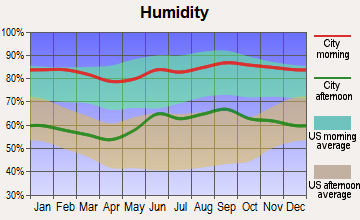
Humidity - Average morning or afternoon humidity
78.4%
77.3%
Humidity - Differences between morning and afternoon humidity
44%
31%
Humidity - Maximum monthly morning or afternoon humidity
92%
86%
Humidity - Minimum monthly morning or afternoon humidity
48%
55%
Precipitation - Yearly average
51.8 in
63.5 in
Snowfall - Yearly average
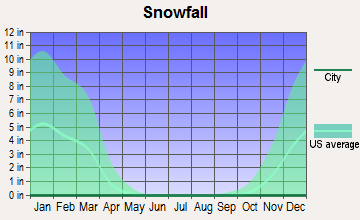
0 in
0 in
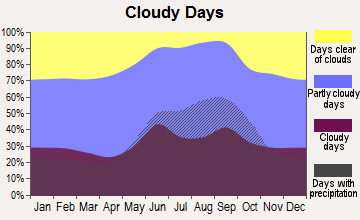
Clouds - Number of days clear of clouds
15.8%
12.3%
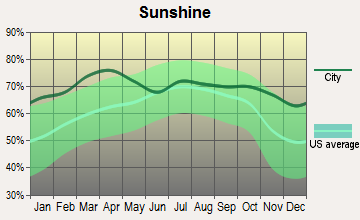
Sunshine amount - Average
69.6%
76.8%
Sunshine amount - Differences during a year
16%
16%
Sunshine amount - Maximum monthly
74%
79%
Sunshine amount - Minimum monthly
58%
63%
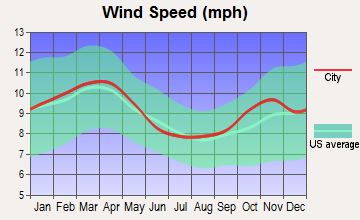
Wind speed - Average
7.2 mph
9.1 mph
Average climate in Jacksonville, Florida
Average climate in Hialeah, Florida
Air pollution
Type
AQI
CO
NO2
OZONE
PB
PM10
PM25
SO2
Year
Jacksonville
Hialeah
Jacksonville
Hialeah
Hialeah
Jacksonville
Hialeah
Jacksonville
Hialeah
Jacksonville
Hialeah
Jacksonville
Hialeah
2018
78
72
N/A
0.24
5.4
N/A
24.5
27.8
N/A
N/A
15.5
N/A
7.1
8.1
N/A
0.3
2017
74
80
N/A
0.24
6.1
N/A
24.7
27.4
N/A
N/A
N/A
N/A
5.8
8.4
0.7
0.3
2016
65
68
0.50
0.25
5.5
N/A
24.9
29.3
N/A
N/A
N/A
N/A
5.2
7.1
0.4
0.0
2015
63
62
0.35
0.22
3.4
N/A
25.4
26.2
N/A
N/A
N/A
N/A
4.9
8.2
0.3
0.0
2014
66
71
0.27
0.23
4.6
N/A
24.3
27.7
N/A
N/A
N/A
N/A
5.9
8.0
0.7
0.0
2013
68
64
0.18
0.18
3.4
N/A
23.0
27.3
N/A
N/A
N/A
N/A
5.3
7.9
0.7
0.0
2012
66
71
0.10
0.19
3.4
N/A
24.0
28.6
N/A
N/A
N/A
N/A
5.8
8.7
0.6
0.0
2011
88
72
0.28
0.12
3.7
N/A
26.6
28.3
N/A
N/A
N/A
N/A
8.1
8.7
0.8
0.0
2010
77
77
0.31
0.33
5.0
N/A
26.4
29.4
N/A
N/A
N/A
N/A
7.1
9.1
0.8
0.0
2009
72
67
0.16
0.52
4.2
N/A
25.0
28.8
N/A
N/A
N/A
N/A
8.5
9.1
0.6
0.0
2008
75
95
0.15
0.59
4.2
N/A
27.6
31.0
N/A
N/A
18.0
N/A
10.0
10.5
0.9
0.0
2007
92
94
0.29
0.65
5.4
N/A
28.4
33.5
N/A
N/A
21.9
N/A
11.4
10.5
1.2
0.0
2006
87
87
0.35
0.57
6.4
N/A
29.0
34.6
N/A
N/A
22.3
N/A
10.8
10.2
1.4
0.0
2005
93
75
0.42
0.52
6.5
N/A
26.5
31.8
N/A
N/A
18.8
N/A
12.2
8.7
1.8
0.0
2004
92
69
0.40
1.03
6.4
N/A
25.2
31.3
N/A
N/A
19.5
N/A
12.4
8.5
1.4
0.3
2003
55
70
0.43
1.11
7.2
N/A
21.6
29.5
N/A
N/A
N/A
N/A
N/A
8.4
1.6
0.4
2002
59
75
0.49
0.73
6.5
N/A
22.2
30.2
0.003
N/A
N/A
N/A
N/A
8.4
1.7
2.1
2001
74
84
0.49
0.74
6.8
N/A
24.0
30.2
0.009
N/A
N/A
N/A
N/A
9.1
2.5
1.5
2000
85
66
0.52
0.81
7.3
N/A
25.1
31.1
0.017
N/A
N/A
N/A
N/A
N/A
3.0
1.3
Natural disasters
Type
Jacksonville
Hialeah
Tornado activity compared to U.S. average
75.2%
66.7%
Earthquake activity compared to U.S. average
18.1%
1.1%
Natural disasters compared to U.S. average
24%
10%
Transportation
Both cities have reliable public transit systems. Jacksonville has a bus system, a skyway monorail, and a ferry service, while Hialeah residents often make use of the Miami-Dade Transit system. Jacksonville's larger area results in longer commute times.
Transport
Type
Jacksonville
Hialeah
Amtrak stations
1
0
Amtrak stations nearby
1
3
FAA registered aircraft
566
47
FAA registered aircraft manufacturers and dealers
34
2
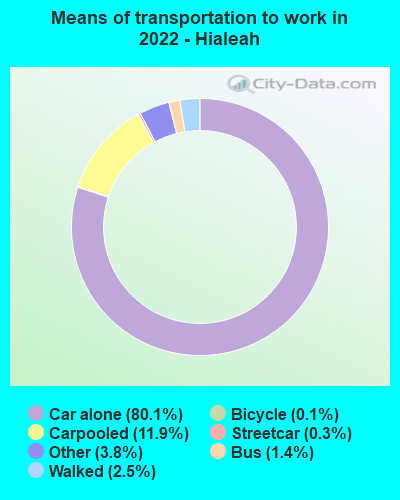
Means of transportation to work
Type
Jacksonville
Hialeah
Bicycle
0.2%
0.1%
Bus
1.1%
1.5%
Carpooled
9%
10.2%
Car alone
86.5%
85%
Motorcycle
0.2%
0%
Railroad
0%
0.1%
Subway
0%
0.2%
Taxicab
0.2%
0%
Walked
1.2%
1.2%
Average travel time to work
Type
Jacksonville
Hialeah
Average
27.5 min
31.1 min
Other means
25 min
27.8 min
Public transportation
43.7 min
47.6 min
Private vehicle occupancy
Type
Jacksonville
Hialeah
Average
1.1
1.2
Drove alone
89.4%
88.7%
In 2 person carpool
8%
7.4%
In 3 person carpool
1.7%
0.6%
In 4 person carpool
0.7%
1.4%
In 5-6 person carpool
0%
1.6%
In 7+ person carpool
0.2%
0.2%
How many people usually rode to work in the car, truck or van.
Real Estate
Housing costs in Hialeah are significantly higher than in Jacksonville. The median home cost in Hialeah is considerably more than in Jacksonville. On the other hand, the real estate market in Jacksonville is growing at faster rates, offering potential investment opportunities.
Neighborhoods
Both cities have diverse neighborhoods with unique characteristics. Jacksonville has neighborhoods like Riverside with its unique architecture, and the beachfront neighborhood of Neptune Beach. Hialeah is known for its neighborhoods like Palm Springs North and Hialeah Heights, which have a suburban feel and attract families.
Houses and residents
Type
Jacksonville
Hialeah
Houses
422,315
78,076
Average household size (people)
2.5
3.1
Median year apartment built
1985
1975
Median year house/condo built
1987
1973
Length of stay in the house since moving in
12.5 years
15.4 years
Houses occupied
386,283 (91.5%)
75,692 (96.9%)
Houses occupied by owners
226,429 (58.6%)
35,676 (47.1%)
Houses occupied by renters
159,854 (41.4%)
40,016 (52.9%)
Median rent asked for vacant for-rent units
$1,444
$712.50
Median monthly housing costs
$1,154
$1,239
Median price asked for vacant for-sale houses and condos
$260,045
$578,978
Estimated median house or condo value
$239,400
$324,000
Median numbers of rooms
5.6
4.4
Median number of rooms in apartments
4.3
3.9
Median number of rooms in houses and condos
6.3
5.2
Median house price - detached houses
$282,276
$353,442
Median house price - in 2-unit structures
$177,341
$207,624
Median house price - in 3-to-4-unit structures
$144,947
$218,498
Median house price - in 5 or more unit structures
$220,508
$239,263
Median house price - mobile homes
$87,589
$433,672
Median house price - Townhouses or other attached units
$213,709
$285,621
Median house price - All housing units
$266,926
$317,773
Median house age
36
46
Renting percentage
38.3%
49.4%
Housing density (houses/condos per square mile)
557.4
4,057.7
House value disparities
33.2%
24.8%
Household income disparities
44.2%
45.8%
Median household income for houses/condes with a mortgage
$83,160
$64,386
Median household income for apartments without a mortgage
$59,777
$44,969
Housing units without a mortgage
2,439 (1.6%)
436 (2.3%)
Housing units with both a second mortgage and home equity loan
8,460 (5.5%)
756 (4%)
Housing units with a mortgage
150,468 (98.4%)
18,412 (97.7%)
Housing units with a home equity loan
255 (0.2%)
53 (0.3%)
Housing units with a second mortgage
11,378 (7.4%)
850 (4.5%)
House/condo owner moved in on average (years ago)
10
15
House/condo renter moved in on average (years ago)
1
3
Housing units lacking complete kitchen facilities
1.5%
2.1%
Housing units lacking complete plumbing facilities
1.4%
1.1%
Housing units in structures
Housing units in structures
Jacksonville
Hialeah
One, detached
59.4%
39.3%
One, attached
6.1%
9.0%
Two
2.1%
1.3%
3 or 4
5.3%
6.5%
5 to 9
5.0%
8.2%
10 to 19
7.9%
5.7%
20 to 49
4.9%
14.4%
50 or more
5.3%
15.1%
Mobile homes
3.8%
0.5%
Boats, RVs, vans, etc.
0.2%
0.1%
Median real estate property taxes paid for housing units
Self-employed workers in own not incorporated business
19,601
14,316
State government workers
13,692
1,118
Unpaid family workers
1,066
379
Industries and Occupations
Both cities have diverse employment sectors but Jacksonville’s economy is more diversified. In Jacksonville, transportation, logistics, and healthcare are common industries, whereas in Hialeah, manufacturing and retail trade dominate. Retail sales and office and administrative support are common occupations in Hialeah, while in Jacksonville the most common jobs are in management, business, and finance.
Both Jacksonville and Hialeah have quality hospitals and health care providers. Jacksonville has a number of leading medical institutions, including the prestigious Mayo Clinic. Hialeah also offers quality health care facilities such as Palmetto General Hospital and Hialeah Hospital.
Health (county statistics)
Type
Jacksonville
Hialeah
General health status score of residents in this county from 1 (poor) to 5 (excellent)
Jacksonville's infrastructure is more developed due to the city's size and importance as a regional transport hub. It has a large port, several highways and an international airport. Hialeah has good infrastructure, with major highways and access to Miami's ports and airports. However, it's not as extensive as Jacksonville's.
Infrastructure
Type
Jacksonville
Hialeah
Hospitals
25
6
TV stations
17
27
Bank branches located here
191
53
Bank institutions located here
31
22
Main business address for public companies
23
2
Drinking water stations with no reported violations in the past
20
1
Drinking water stations with reported violations in the past
HMDA - Conventional home purchase loans - Applications denied
Year
Jacksonville
Hialeah
1999
5,422
0
2000
4,132
267
2001
3,038
265
2002
2,017
244
2003
3,563
696
2004
4,781
983
2005
7,134
1,502
2006
8,812
2,294
2007
5,298
1,204
2008
1,719
319
2009
676
73
Culture and Food
Jacksonville is known for Southern cuisine, fresh seafood, and a burgeoning craft beer scene. Hialeah boasts of it's Cuban food due to its strong Cuban-American population. Numerous cultural events and festivals take place in both cities, offering entertainment options for families and young professionals alike.
Sports Teams
Sports fans may prefer Jacksonville as it's home to the NFL's Jacksonville Jaguars, the minor league baseball team Jacksonville Jumbo Shrimp, and a soccer team. Hialeah doesn't host any major sports teams but Miami's sports teams are close by.


 Jacksonville, FL
 Hialeah, FL