Jacksonville and Port St. Lucie diverge in terms of their city dynamics. The former is the largest city in Florida with a more urbanized feel, while the latter is a smaller city with a close-knit community vibe. Important factors such as safety, economy, and lifestyle differ significantly between these two destinations. This comparison aims to provide a comprehensive understanding for those considering relocation or visiting as a tourist.
Distance between
Jacksonville, FL and
Port St. Lucie, FL : 224.6 miles
Jacksonville's population is larger by 339%. Its population has grown by 218,997 people (29.8%) since 2000. The population of Port St. Lucie has grown by 128,754 people (145.0%) during that time.
Jacksonville's crime rates are higher than the national average and significantly outnumber Port St. Lucie, which is considered one of Florida's safest cities. Both cities have made efforts to reduce crime, with Jacksonville using community-based initiatives and Port St. Lucie focusing on maintaining a secure, family-oriented environment. Visitors and residents are always advised to follow basic safety precautions in any city.
Cost of Living
Port St. Lucie has a lower cost of living compared to Jacksonville. However, Jacksonville offers more variety in housing options, from urban condos to suburban homes. In contrast, Port St. Lucie is known for its affordable single-family homes, making it appealing for families and retirees.
Income Tax
Florida does not have a state income tax, benefiting residents of both Jacksonville and Port St. Lucie.
Property Tax
Jacksonville has a slightly higher property tax rate compared to Port St. Lucie. However, they both are considered moderate relative to other parts of the country.
Sales Tax
Both Jacksonville and Port St. Lucie have a 7% sales tax, which is inline with Florida's state level. There are no distinctions in sales tax rates for either city.
Income
Type
Jacksonville
Port St. Lucie
Estimated median household income
$58,621
$71,381
Estimated per capita income
$32,953
$32,151
Cost of living index (U.S. average is 100)
88.3
90.4
If you make $50,000 in Jacksonville, you will have to make $51,189 in Port St. Lucie to maintain the same standard of living.
Geographical Conditions
Jacksonville sits at the mouth of the St. Johns River and boasts of many beaches. Port St. Lucie, situated on Florida's Treasure Coast, is intersected by rivers and positioned between natural preserves and the Atlantic Ocean.
When it comes to education, Jacksonville houses several esteemed institutions like the University of North Florida and Jacksonville University. Port St. Lucie, houses Indian River State College and is close to other colleges in nearby cities. Public schools in both cities are varied in quality, with some top-rated and others struggling.
Jacksonville's economy is diversified with a variety of industries like healthcare, finance, and logistics playing a key role. Port St. Lucie, smaller in size, has a steadily growing economy with healthcare and retail trade leading its employment sectors. Both cities have a slightly higher unemployment rate compared to the national average.
Biggest Employers
In Jacksonville, major employers include Baptist Health, Bank of America, and Naval Air Station Jacksonville. Port St. Lucie's largest employers include Port St. Lucie Hospital, Walmart, and City of Port St. Lucie.
There were 1,310 building permits issued in Jacksonville in 2012 (353 more than in 2011) compared to 5,160 building permits issued in Port St. Lucie in 2012 (5007 more than in 2011).
In Jacksonville (Duval County), 47.9% voted for Democrats and 51.5% for Republicans in 2012 Presidential Election. In Port St. Lucie (St. Lucie County), 53.7% voted for Democrats and 45.8% for Republicans.
Elections
Type
Democrats
Republicans
Other
Year
Jacksonville
Port St. Lucie
Jacksonville
Port St. Lucie
Jacksonville
Port St. Lucie
2020
51.3%
49.0%
47.5%
50.6%
1.2%
0.4%
2016
47.2%
47.2%
48.6%
49.6%
4.2%
3.2%
2012
47.9%
53.7%
51.5%
45.8%
0.6%
0.4%
2008
49.0%
55.7%
51.0%
43.6%
0.0%
0.7%
2004
41.7%
51.9%
57.9%
47.7%
0.3%
0.4%
2000
40.9%
53.5%
57.7%
44.7%
1.4%
1.8%
1996
44.2%
48.9%
50.0%
39.1%
5.8%
12.0%
Breakdown of population affiliated with a religious congregation
Type
Adherents
Congregations
Religion
Jacksonville
Port St. Lucie
Jacksonville
Port St. Lucie
SOUTHERN BAPTIST CONVENTION
15.8%
3.2%
22.3%
18.8%
CATHOLIC CHURCH
9.0%
12.2%
2.8%
3.8%
EPISCOPAL CHURCH
1.2%
0.5%
2.3%
1.9%
MUSLIM ESTIMATE
0.7%
0.6%
0.6%
0.9%
EVANGELICAL LUTHERAN CHURCH IN AMERICA
0.3%
0.3%
0.9%
1.9%
SEVENTH DAY ADVENTIST CHURCH
0.3%
0.8%
1.4%
3.8%
VINEYARD USA
0.1%
0.4%
0.2%
0.9%
Weather
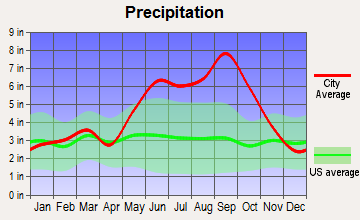
Both cities have similar weather patterns, typical of Florida, featuring hot summers and mild winters. However, Jacksonville, being further north, can have slightly cooler temperatures than Port St. Lucie. Both cities are prone to hurricanes and tropical storms, particularly between June and November.
Weather and climate
Type
Jacksonville
Port St. Lucie
Temperature - Average
68.3°F
73.3°F
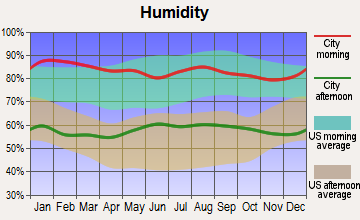
Humidity - Average morning or afternoon humidity
78.4%
79%
Humidity - Differences between morning and afternoon humidity
44%
32.8%
Humidity - Maximum monthly morning or afternoon humidity
92%
87.8%
Humidity - Minimum monthly morning or afternoon humidity
48%
54.9%
Precipitation - Yearly average
51.8 in
55.8 in
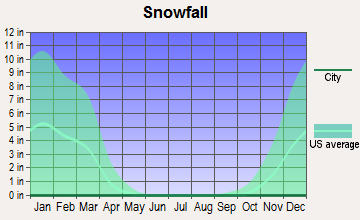
Snowfall - Yearly average
0 in
0 in
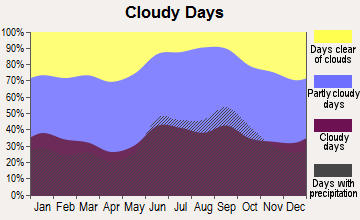
Clouds - Number of days clear of clouds
15.8%
13%
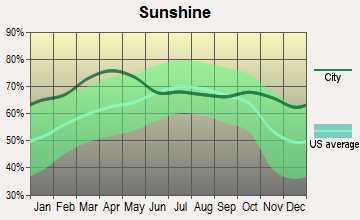
Sunshine amount - Average
69.6%
76.2%
Sunshine amount - Differences during a year
16%
15.1%
Sunshine amount - Maximum monthly
74%
79.6%
Sunshine amount - Minimum monthly
58%
64.5%
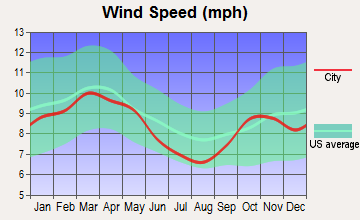
Wind speed - Average
7.2 mph
9 mph
Average climate in Jacksonville, Florida
Average climate in Port St. Lucie, Florida
Air pollution
Type
AQI
CO
OZONE
PB
PM10
PM25
SO2
Year
Jacksonville
Port St. Lucie
Jacksonville
Jacksonville
Port St. Lucie
Jacksonville
Port St. Lucie
Jacksonville
Port St. Lucie
Jacksonville
2018
78
58
N/A
N/A
24.5
28.8
N/A
N/A
N/A
N/A
7.1
7.8
N/A
N/A
2017
74
62
N/A
N/A
24.7
27.5
N/A
N/A
N/A
N/A
5.8
7.9
0.7
N/A
2016
65
57
0.50
N/A
24.9
29.1
N/A
N/A
N/A
N/A
5.2
7.4
0.4
N/A
2015
63
59
0.35
N/A
25.4
27.1
N/A
N/A
N/A
N/A
4.9
7.5
0.3
N/A
2014
66
60
0.27
N/A
24.3
28.1
N/A
N/A
N/A
N/A
5.9
7.6
0.7
N/A
2013
68
56
0.18
N/A
23.0
N/A
N/A
N/A
N/A
N/A
5.3
7.8
0.7
N/A
2012
66
65
0.10
N/A
24.0
29.8
N/A
N/A
N/A
N/A
5.8
8.7
0.6
N/A
2011
88
63
0.28
N/A
26.6
30.2
N/A
N/A
N/A
N/A
8.1
9.1
0.8
N/A
2010
77
60
0.31
N/A
26.4
27.4
N/A
N/A
N/A
N/A
7.1
8.9
0.8
N/A
2009
72
57
0.16
N/A
25.0
N/A
N/A
N/A
N/A
N/A
8.5
8.8
0.6
N/A
2008
75
72
0.15
N/A
27.6
N/A
N/A
N/A
N/A
N/A
10.0
9.4
0.9
N/A
2007
92
76
0.29
N/A
28.4
N/A
N/A
N/A
N/A
N/A
11.4
9.7
1.2
N/A
2006
87
70
0.35
N/A
29.0
N/A
N/A
N/A
N/A
N/A
10.8
10.5
1.4
N/A
2005
93
76
0.42
N/A
26.5
N/A
N/A
N/A
N/A
N/A
12.2
10.5
1.8
N/A
2004
92
N/A
0.40
N/A
25.2
N/A
N/A
N/A
N/A
N/A
12.4
N/A
1.4
N/A
2003
55
35
0.43
N/A
21.6
N/A
N/A
N/A
18.9
N/A
N/A
N/A
1.6
N/A
2002
59
N/A
0.49
N/A
22.2
N/A
0.003
N/A
N/A
N/A
N/A
N/A
1.7
N/A
2001
74
N/A
0.49
N/A
24.0
N/A
0.009
N/A
N/A
N/A
N/A
N/A
2.5
N/A
2000
85
N/A
0.52
N/A
25.1
N/A
0.017
N/A
N/A
N/A
N/A
N/A
3.0
N/A
Natural disasters
Type
Jacksonville
Port St. Lucie
Tornado activity compared to U.S. average
75.2%
68.7%
Earthquake activity compared to U.S. average
18.1%
7.1%
Natural disasters compared to U.S. average
24%
5%
Transportation
Jacksonville has a more extensive public transit system, including buses, a skyway monorail, and a ferry. Port St. Lucie has a bus system, but most residents rely on cars. Both cities contend with traffic on their main thoroughfares.
Transport
Type
Jacksonville
Port St. Lucie
Amtrak stations
1
0
Amtrak stations nearby
1
0
FAA registered aircraft
566
0
FAA registered aircraft manufacturers and dealers
34
0
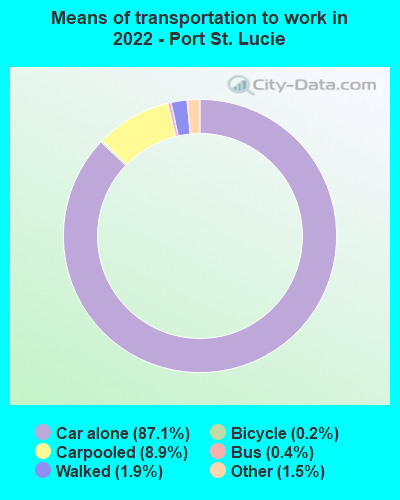
Means of transportation to work
Type
Jacksonville
Port St. Lucie
Bicycle
0.2%
0.5%
Bus
1.1%
0.3%
Carpooled
9%
9.2%
Car alone
86.5%
86.5%
Motorcycle
0.2%
0.4%
Subway
0%
0.1%
Taxicab
0.2%
0.1%
Walked
1.2%
2.3%
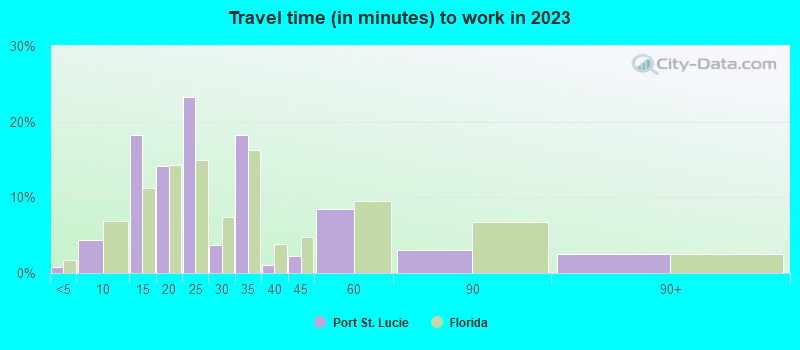
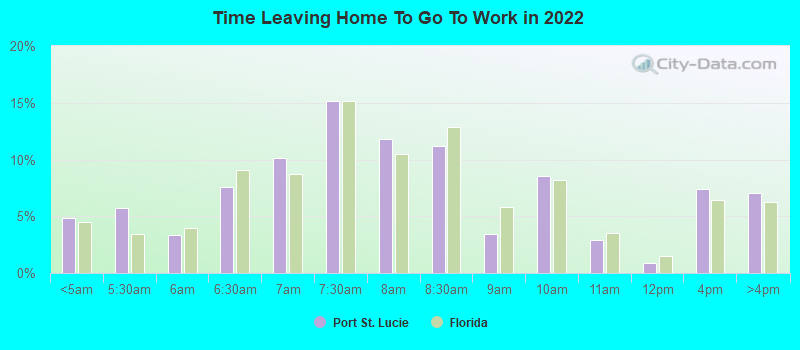
Average travel time to work
Type
Jacksonville
Port St. Lucie
Average
27.5 min
24.7 min
Other means
25 min
27.8 min
Public transportation
43.7 min
38.7 min
Private vehicle occupancy
Type
Jacksonville
Port St. Lucie
Average
1.1
1.1
Drove alone
89.4%
90.9%
In 2 person carpool
8%
7.5%
In 3 person carpool
1.7%
1.1%
In 4 person carpool
0.7%
0.2%
In 5-6 person carpool
0%
0.2%
In 7+ person carpool
0.2%
0.1%
How many people usually rode to work in the car, truck or van.
Real Estate
Real estate in both cities offers value for money, with a lower median home price than the national average. Jacksonville presents a broader selection, while Port St. Lucie is touted for its value, particularly in master-planned communities.
Neighborhoods
Both cities boast a variety of neighborhoods fitting diverse lifestyles. Jacksonville has dynamic urban, beachfront, and suburban communities. Port St. Lucie offers relaxed, family-friendly neighborhoods and gated golf communities.
Houses and residents
Type
Jacksonville
Port St. Lucie
Houses
422,315
84,820
Average household size (people)
2.5
2.7
Median year apartment built
1985
1991
Median year house/condo built
1987
2001
Length of stay in the house since moving in
12.5 years
9 years
Houses occupied
386,283 (91.5%)
77,190 (91%)
Houses occupied by owners
226,429 (58.6%)
64,490 (83.5%)
Houses occupied by renters
159,854 (41.4%)
12,700 (16.5%)
Median rent asked for vacant for-rent units
$1,444
$1,050
Median monthly housing costs
$1,154
$1,313
Median price asked for vacant for-sale houses and condos
$260,045
$351,065
Estimated median house or condo value
$239,400
$284,800
Median numbers of rooms
5.6
6.4
Median number of rooms in apartments
4.3
5.8
Median number of rooms in houses and condos
6.3
6.5
Median house price - detached houses
$282,276
$290,278
Median house price - in 2-unit structures
$177,341
$134,121
Median house price - in 3-to-4-unit structures
$144,947
$127,555
Median house price - in 5 or more unit structures
$220,508
$271,458
Median house price - mobile homes
$87,589
$41,584
Median house price - Townhouses or other attached units
$213,709
$264,738
Median house price - All housing units
$266,926
$282,471
Median house age
36
21
Renting percentage
38.3%
21.9%
Housing density (houses/condos per square mile)
557.4
1,122.8
House value disparities
33.2%
22.6%
Household income disparities
44.2%
36.3%
Median household income for houses/condes with a mortgage
$83,160
$84,195
Median household income for apartments without a mortgage
$59,777
$68,067
Housing units without a mortgage
2,439 (1.6%)
1,140 (2.7%)
Housing units with both a second mortgage and home equity loan
8,460 (5.5%)
1,332 (3.2%)
Housing units with a mortgage
150,468 (98.4%)
40,853 (97.3%)
Housing units with a home equity loan
255 (0.2%)
0 (0%)
Housing units with a second mortgage
11,378 (7.4%)
1,459 (3.5%)
House/condo owner moved in on average (years ago)
10
6
House/condo renter moved in on average (years ago)
1
2
Housing units lacking complete kitchen facilities
1.5%
0.8%
Housing units lacking complete plumbing facilities
1.4%
0.8%
Housing units in structures
Housing units in structures
Jacksonville
Port St. Lucie
One, detached
59.4%
87.8%
One, attached
6.1%
3.2%
Two
2.1%
0.5%
3 or 4
5.3%
2.0%
5 to 9
5.0%
1.2%
10 to 19
7.9%
1.8%
20 to 49
4.9%
1.3%
50 or more
5.3%
0.9%
Mobile homes
3.8%
1.2%
Boats, RVs, vans, etc.
0.2%
0.0%
Median real estate property taxes paid for housing units
Self-employed workers in own not incorporated business
19,601
8,105
State government workers
13,692
1,390
Unpaid family workers
1,066
276
Industries and Occupations
Jacksonville's leading industries include healthcare, banking, and logistics, necessitating a range of jobs. Conversely, Port St. Lucie's economy is primarily centered around healthcare, retail, and construction, reflecting the city's development and population growth.
Healthcare in Jacksonville is highlighted by the Mayo Clinic and UF Health Jacksonville. Port St. Lucie’s healthcare facilities include St. Lucie Medical Center and Tradition Medical Center.
Health (county statistics)
Type
Jacksonville
Port St. Lucie
General health status score of residents in this county from 1 (poor) to 5 (excellent)
Jacksonville's infrastructure is more developed due to its size and status as a major city. However, Port St. Lucie's infrastructure is growing, with investments in road widening and construction projects to accommodate its ascending population.
Infrastructure
Type
Jacksonville
Port St. Lucie
TV stations
17
16
Bank branches located here
191
6
Bank institutions located here
31
4
Nuclear power plants nearby
0
2
Drinking water stations with no reported violations in the past
20
1
Drinking water stations with reported violations in the past
HMDA - Conventional home purchase loans - Applications denied
Year
Jacksonville
Port St. Lucie
1999
5,422
260
2000
4,132
167
2001
3,038
166
2002
2,017
179
2003
3,563
763
2004
4,781
1,245
2005
7,134
2,255
2006
8,812
2,306
2007
5,298
1,132
2008
1,719
387
2009
676
201
Culture and Food
Jacksonville, as a larger city, presents more cultural diversity, including a range of cuisines and cultural festivals. Port St. Lucie offers a laid-back lifestyle with a focus on outdoor activities. Both cities are in proximity to the Atlantic Ocean, offering fresh seafood.
Sports Teams
Jacksonville is home to the NFL's Jacksonville Jaguars. Port St. Lucie is the spring training home of the MLB's New York Mets. Both cities have local sports at the college and high school level, creating a vibrant sporting culture.


 Jacksonville, FL
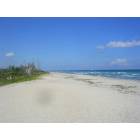
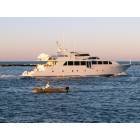
 Port St. Lucie, FL