Las Vegas, NV, and North Las Vegas, NV are neighboring cities with unique characteristics, attracting tourists worldwide. While they share a common desert climate and a vibrant nightlife, they offer different experiences in terms of living conditions, economy, tax rates, healthcare, and cultural activities. This comparison will provide an in-depth understanding for those considering relocation or just visiting either city.
Distance between
Las Vegas, NV and
North Las Vegas, NV : 4.8 miles
Las Vegas's population is larger by 136%. Its population has grown by 168,356 people (35.2%) since 2000. The population of North Las Vegas has grown by 158,645 people (137.4%) during that time.
Las Vegas, being a globally renowned tourist hub, has higher crime rates compared to the national average, largely due to property crimes. However, the city's substantial police force helps ensure overall safety. In contrast, North Las Vegas has a somewhat lower crime rate, mainly because it's predominantly residential, with fewer businesses and tourist attractions.
City-data.com crime index counts serious crimes and violent crime more heavily. It adjusts for the number of visitors and daily workers commuting into cities. (higher means more crime, U.S. average = 301.1)
City-data.com crime index counts serious crimes and violent crime more heavily. It adjusts for the number of visitors and daily workers commuting into cities. (higher means more crime, U.S. average = 301.1)
Sex Offenders
According to our data, there are 4,783 registered sex offenders living in Las Vegas and 732 registered sex offenders living in . The ratio of residents to sex offenders in Las Vegas is 132 to 1; the ratio in North Las Vegas is 326 to 1. The number of registered sex offenders compared to the number of residents is larger in Las Vegas than in North Las Vegas.
Cost of Living
Living in Las Vegas is generally more expensive, primarily due to the cost of housing and services catering to a large number of tourists. Conversely, North Las Vegas, with a predominantly local population, offers a lower cost of living, making it more affordable for families and retirees.
Income Tax
Both cities, as part of Nevada, do not impose a state income tax, which could be a significant factor for those looking to relocate from high-tax states.
Property Tax
Property tax rates are similar for both cities, with rates depending on the assessed value of the property. Both cities provide exemptions for eligible veterans and senior citizens.
Sales Tax
Both Las Vegas and North Las Vegas carry the same sales tax rate, reflecting the statewide rate of 8.25%. There are no additional local sales taxes.
Income
Type
Las Vegas
North Las Vegas
Estimated median household income
$59,746
$67,035
Estimated per capita income
$33,825
$26,498
Cost of living index (U.S. average is 100)
99.1
98.3
If you make $50,000 in North Las Vegas, you will have to make $50,407 in Las Vegas to maintain the same standard of living.
Geographical Conditions
Both cities share a similar desert geography, surrounded by mountain ranges. However, Las Vegas's Strip area, with its distinctive skyline, contrasts greatly with North Las Vegas's planned residential communities.
Both cities provide access to a variety of public, private and charter schools. The University of Nevada, Las Vegas serves the higher education needs in Las Vegas, while the College of Southern Nevada caters to North Las Vegas. Both cities continue to invest in improving the quality of education for residents.
Las Vegas's economy relies heavily on tourism, entertainment, and hospitality, employing a large portion of the city’s population. North Las Vegas, while also benefiting from tourism, has a more diversified economy including manufacturing and military-related jobs.
Biggest Employers
Las Vegas's biggest employers are top-tier hotels and casinos such as MGM Resorts and Caesar’s Entertainment. North Las Vegas is home to some major employers such as Amazon, the City of North Las Vegas, and the Nellis Air Force Base.
There were 2,700 building permits issued in Las Vegas in 2012 (1886 more than in 2011) compared to 2,835 building permits issued in North Las Vegas in 2012 (2325 more than in 2011).
Weather
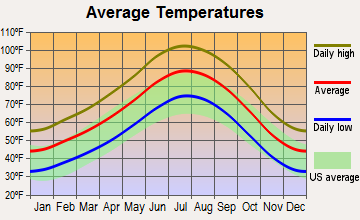
Both cities share the same desert climate with hot summers and mild winters. Temperatures in the summer can exceed 100°F, while winter temperatures typically hover between 30-60°F. Both cities receive little rainfall, primarily during the winter months.
Weather and climate
Type
Las Vegas
North Las Vegas
Temperature - Average
65.5°F
65.8°F
Humidity - Average morning or afternoon humidity
30.7%
30.7%
Humidity - Differences between morning and afternoon humidity
42%
42%
Humidity - Maximum monthly morning or afternoon humidity
52%
52%
Humidity - Minimum monthly morning or afternoon humidity
10%
10%
Precipitation - Yearly average
5.7 in
5.4 in
Snowfall - Yearly average
1.6 in
1.6 in
Clouds - Number of days clear of clouds
35.1%
35.1%
Sunshine amount - Average
91.8%
91.8%
Sunshine amount - Differences during a year
16%
16%
Sunshine amount - Maximum monthly
92%
92%
Sunshine amount - Minimum monthly
76%
76%
Wind speed - Average
9.2 mph
9.2 mph
Average climate in Las Vegas, Nevada
Average climate in North Las Vegas, Nevada
Air pollution
Type
AQI
CO
NO2
OZONE
PM10
PM25
SO2
Year
Las Vegas
North Las Vegas
Las Vegas
North Las Vegas
Las Vegas
North Las Vegas
Las Vegas
North Las Vegas
Las Vegas
North Las Vegas
Las Vegas
North Las Vegas
Las Vegas
North Las Vegas
2018
100
100
0.42
0.42
13.1
14.2
37.2
35.4
24.4
27.7
6.0
7.2
0.7
0.7
2017
101
101
0.29
0.26
13.0
14.2
38.5
29.9
20.3
22.2
7.3
8.6
0.8
0.8
2016
97
93
0.38
0.37
11.2
11.9
36.5
28.4
20.6
22.8
8.7
10.2
0.8
0.8
2015
92
92
0.36
0.34
12.4
13.0
35.6
28.2
18.9
21.2
8.4
9.3
1.2
1.2
2014
91
91
0.40
0.37
10.8
11.3
36.5
27.8
21.1
23.8
9.2
10.1
1.4
1.4
2013
103
103
0.45
0.48
9.6
10.4
36.9
28.4
22.1
24.4
8.6
9.5
1.5
1.5
2012
94
96
0.49
0.52
5.9
6.0
38.5
29.5
21.5
24.8
8.3
8.8
1.4
1.4
2011
85
85
0.40
0.36
5.3
5.3
37.5
29.2
18.2
20.4
7.8
8.0
1.2
1.2
2010
86
81
0.50
0.51
5.7
5.7
36.6
28.6
16.1
18.2
7.1
7.2
N/A
N/A
2009
87
87
0.56
0.55
6.0
6.0
33.3
27.6
20.9
24.3
8.3
8.3
N/A
N/A
2008
82
82
0.66
0.66
8.2
8.2
33.0
26.3
N/A
N/A
9.2
9.5
N/A
N/A
2007
97
97
0.61
0.48
11.7
12.5
32.4
26.3
N/A
N/A
8.6
9.3
0.1
0.1
2006
102
102
0.75
0.67
13.4
14.6
32.7
26.3
N/A
N/A
8.3
9.7
0.8
0.8
2005
100
100
0.76
0.71
15.1
16.3
30.2
25.1
N/A
N/A
7.8
9.7
5.3
5.3
2004
85
86
0.71
0.63
16.0
17.4
30.6
25.5
N/A
N/A
N/A
N/A
1.6
1.6
2003
99
99
0.67
0.62
15.9
18.0
29.8
25.1
N/A
N/A
N/A
N/A
1.0
0.9
2002
94
94
0.73
0.35
15.7
17.7
30.6
24.1
N/A
N/A
N/A
N/A
0.7
0.6
2001
95
95
0.76
0.32
15.0
16.7
29.4
24.1
N/A
N/A
N/A
N/A
1.1
0.9
2000
95
95
0.88
0.34
14.7
16.2
29.7
24.0
N/A
N/A
N/A
N/A
0.4
0.4
Natural disasters
Type
Las Vegas
North Las Vegas
Tornado activity compared to U.S. average
2.1%
2.1%
Earthquake activity compared to U.S. average
6,093.4%
6,003.8%
Natural disasters compared to U.S. average
12%
12%
Transportation
Las Vegas, due to its tourist-oriented economy, benefits from efficient public transportation including buses, monorail and multiple taxi services. North Las Vegas, though lacking a rapid transit system, has good road connectivity and a reliable bus network.
Transport
Type
Las Vegas
North Las Vegas
Amtrak stations
1
0
Amtrak stations nearby
1
1
FAA registered aircraft
1
123
FAA registered aircraft manufacturers and dealers
81
16
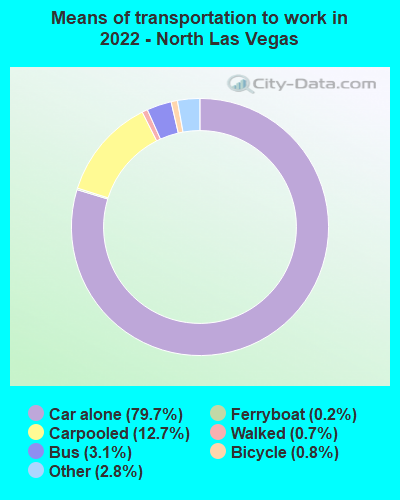
Means of transportation to work
Type
Las Vegas
North Las Vegas
Bicycle
0.1%
0.4%
Bus
2.2%
1.6%
Carpooled
10.3%
13.4%
Car alone
82.7%
80.7%
Motorcycle
0.4%
0.4%
Walked
1.4%
0.7%
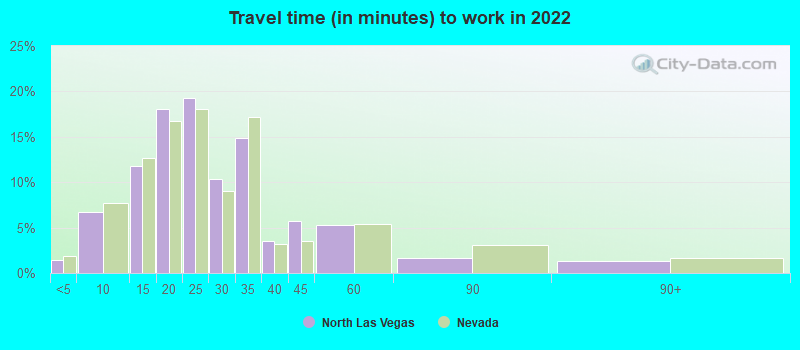
Average travel time to work
Type
Las Vegas
North Las Vegas
Average
26.3 min
25.8 min
Other means
24 min
25.9 min
Public transportation
49.9 min
55.9 min
Private vehicle occupancy
Type
Las Vegas
North Las Vegas
Average
1.2
1.2
Drove alone
88.9%
86.9%
In 2 person carpool
8.2%
9.2%
In 3 person carpool
2.1%
2.9%
In 4 person carpool
0.2%
0.7%
In 5-6 person carpool
0.4%
0.1%
In 7+ person carpool
0.2%
0.1%
How many people usually rode to work in the car, truck or van.
Real Estate
In Las Vegas, real estate is more expensive due to demand from tourists and investors. On the other hand, North Las Vegas offers more affordable real estate, attracting families and first-time homeowners.
Neighborhoods
Las Vegas offers a vibrant mix of neighborhoods from downtown's high-rise condos to suburban family-oriented areas. In contrast, North Las Vegas is quieter and more residential, perfect for families looking for a peaceful environment.
Houses and residents
Type
Las Vegas
North Las Vegas
Houses
269,602
91,034
Average household size (people)
2.7
3.2
Median year apartment built
1991
2002
Median year house/condo built
1995
2003
Length of stay in the house since moving in
10.1 years
9.6 years
Houses occupied
250,350 (92.9%)
85,966 (94.4%)
Houses occupied by owners
138,677 (55.4%)
51,443 (59.8%)
Houses occupied by renters
111,673 (44.6%)
34,523 (40.2%)
Median rent asked for vacant for-rent units
$1,176
$1,592
Median monthly housing costs
$1,255
$1,378
Median price asked for vacant for-sale houses and condos
$989,410
$288,164
Estimated median house or condo value
$362,400
$335,200
Median numbers of rooms
5.2
5.6
Median number of rooms in apartments
4.1
4.6
Median number of rooms in houses and condos
6.1
6.3
Median house price - detached houses
$439,169
$347,582
Median house price - in 3-to-4-unit structures
$201,871
$321,737
Median house price - in 5 or more unit structures
$327,174
$193,128
Median house price - mobile homes
$113,235
$352,751
Median house price - Townhouses or other attached units
$274,961
$462,203
Median house price - All housing units
$417,434
$349,615
Median house age
27
18
Renting percentage
43.5%
37.6%
Housing density (houses/condos per square mile)
2,379.4
1,159.5
House value disparities
27.1%
19.6%
Household income disparities
47.1%
40.2%
Median household income for houses/condes with a mortgage
$90,388
$87,018
Median household income for apartments without a mortgage
$62,287
$67,367
Housing units without a mortgage
1,172 (1.2%)
317 (0.8%)
Housing units with both a second mortgage and home equity loan
4,450 (4.6%)
1,013 (2.6%)
Housing units with a mortgage
95,992 (98.8%)
39,101 (99.2%)
Housing units with a home equity loan
178 (0.2%)
0 (0%)
Housing units with a second mortgage
5,092 (5.2%)
1,247 (3.2%)
House/condo owner moved in on average (years ago)
7
6
House/condo renter moved in on average (years ago)
2
1
Housing units lacking complete kitchen facilities
1.3%
0.9%
Housing units lacking complete plumbing facilities
1%
1.4%
Housing units in structures
Housing units in structures
Las Vegas
North Las Vegas
One, detached
61.5%
75.9%
One, attached
5.3%
3.1%
Two
1.3%
1.1%
3 or 4
7.7%
4.8%
5 to 9
8.4%
4.7%
10 to 19
4.8%
3.0%
20 to 49
2.8%
2.3%
50 or more
6.8%
3.6%
Mobile homes
1.4%
1.4%
Boats, RVs, vans, etc.
0.1%
0.0%
Median real estate property taxes paid for housing units
Self-employed workers in own not incorporated business
18,990
4,201
State government workers
6,950
2,853
Unpaid family workers
614
530
Industries and Occupations
Las Vegas's primary employment sectors include leisure and hospitality, while North Las Vegas enjoys a diversified job market comprising manufacturing, retail trade, healthcare, and aerospace.
Building and grounds cleaning and maintenance occupations
5.8%
5.8%
Business and financial operations occupations
5.3%
5.8%
Health diagnosing and treating practitioners and other technical occupations
5.2%
3.3%
Healthcare support occupations
4.0%
6.4%
Health technologists and technicians
3.2%
1.5%
Material moving occupations
2.8%
5.6%
Production occupations
2.0%
2.3%
Legal occupations
2.0%
0.7%
Community and social service occupations
1.8%
1.4%
Computer and mathematical occupations
1.7%
0.4%
Arts, design, entertainment, sports, and media occupations
1.6%
1.4%
Firefighting and prevention, and other protective service workers including supervisors
0.9%
2.0%
Transportation occupations
0.6%
1.9%
Law enforcement workers including supervisors
0.3%
1.7%
Health Care
Las Vegas has a better healthcare system with multiple advanced healthcare facilities to serve the tourist population. North Las Vegas, while not as expansive, still provides good quality healthcare with several hospitals and primary care centers.
Las Vegas enjoys an advanced infrastructure, optimized for tourism with an international airport, high-speed monorail, and extensive highway system. North Las Vegas, while not as optimized for tourist traffic, still offers good infrastructure with a focus on residential communities.
Infrastructure
Type
Las Vegas
North Las Vegas
Hospitals
39
1
TV stations
12
14
Bank branches located here
281
27
Bank institutions located here
34
12
Main business address for public companies
57
1
Drinking water stations with no reported violations in the past
32
2
Drinking water stations with reported violations in the past
HMDA - Conventional home purchase loans - Applications denied
Year
Las Vegas
North Las Vegas
1999
2,657
426
2000
579
190
2001
371
110
2002
380
152
2003
3,590
1,025
2004
5,908
2,286
2005
7,894
3,742
2006
6,914
3,581
2007
3,733
1,737
2008
1,431
574
2009
813
330
Culture and Food
Las Vegas is world-renowned for its rich and diverse food culture, offering gourmet dining options in its Casinos to iconic street foods. North Las Vegas provides more local, family-oriented dining options often at more affordable prices.
Sports Teams
Las Vegas is home to professional sports teams such as the Las Vegas Raiders (NFL) and the Golden Knights (NHL). North Las Vegas residents also enjoy these teams as they represent the entire region.


 Las Vegas, NV
 North Las Vegas, NV