Los Angeles, California and Dallas, Texas are two prominent cities in the United States, each with their own distinct features. While Los Angeles is recognized for its entertainment industry and coastal location, Dallas is known for its rich cultural heritage, thriving economy, and sports scene. This comprehensive comparison highlights key features such as crime/safety, weather, cost of living, education, work and economy, infrastructure, industries and occupations, biggest employers, real-estate, neighborhoods, transportation, taxes, culture, sports teams, geographical conditions, and health care.
Distance between
Los Angeles, CA and
Dallas, TX : 1,245.5 miles
Los Angeles's population is larger by 199%. Its population has grown by 154,477 people (4.2%) since 2000. The population of Dallas has grown by 99,877 people (8.4%) during that time.
Los Angeles has a higher crime rate compared to Dallas, ranking above the national average. However, crime varies significantly by neighborhood. Neighborhoods like West Los Angeles, Encino and Brentwood are notably safe. On the contrary, Dallas has a slightly lower overall crime rate, with some areas like North Dallas and Far North being remarkably secure.
City-data.com crime index counts serious crimes and violent crime more heavily. It adjusts for the number of visitors and daily workers commuting into cities. (higher means more crime, U.S. average = 301.1)
City-data.com crime index counts serious crimes and violent crime more heavily. It adjusts for the number of visitors and daily workers commuting into cities. (higher means more crime, U.S. average = 301.1)
Sex Offenders
According to our data, there are 4,425 registered sex offenders living in Los Angeles and 4,271 registered sex offenders living in . The ratio of residents to sex offenders in Los Angeles is 899 to 1; the ratio in Dallas is 309 to 1. The number of registered sex offenders compared to the number of residents is a lot smaller in Los Angeles than in Dallas.
Cost of Living
Los Angeles has a significantly higher cost of living than Dallas, primarily due to housing expenses. Food, transportation, and healthcare are also typically more expensive in LA. On the other hand, Dallas offers a more affordable living standard, making it an attractive option for families and retirees.
Income Tax
California, and by extension Los Angeles, has a steep income tax rate that goes up to 13.3% for the wealthiest residents. Texas, however, does not levy a state income tax, which can result in significant savings for Dallas residents.
Property Tax
Dallas has a higher average property tax rate than Los Angeles. Dallas levies an average property tax rate of about 2.06%, while in LA it's considerably lower at around 0.73%.
Sales Tax
Los Angeles has a higher sales tax rate than Dallas, standing at 9.5% compared to Dallas's 8.25%. Neither Texas nor California has a city-level sales tax.
Income
Type
Los Angeles
Dallas
Estimated median household income
$70,372
$57,995
Estimated per capita income
$39,509
$38,479
Cost of living index (U.S. average is 100)
145.1
96.1
If you make $50,000 in Dallas, you will have to make $75,494 in Los Angeles to maintain the same standard of living.
Geographical Conditions
Los Angeles is bordered by the Pacific Ocean and has a mountainous terrain, making it a hotspot for outdoor activities. Dallas is relatively flat, located in the southern plains, and does not have significant geographical features like oceans or mountains.
Los Angeles is home to prestigious universities like UCLA, USC, and Loyola Marymount. The LA Unified School District is the largest public school system in California. Dallas also has its share of good schools, including the University of Texas at Dallas and Southern Methodist University. Dallas Independent School District serves the city's public school students.
Los Angeles has a diverse economy with entertainment, technology, and healthcare being the major sectors. However, Dallas's economy is primarily driven by financial services, technology, defense, and logistics. Both cities boast thriving economies with plenty of job opportunities.
Biggest Employers
In Los Angeles, the biggest employers are UCLA Health, the County of Los Angeles, and the City of Los Angeles. In Dallas, AT&T and American Airlines are among the top employers.
There were 2,475 building permits issued in Los Angeles in 2012 (1950 more than in 2011) compared to 2,245 building permits issued in Dallas in 2012 (1436 more than in 2011).
In Los Angeles (Los Angeles County), 69.7% voted for Democrats and 27.8% for Republicans in 2012 Presidential Election. In Dallas (Dallas County), 57.3% voted for Democrats and 41.8% for Republicans.
Elections
Type
Democrats
Republicans
Other
Year
Los Angeles
Dallas
Los Angeles
Dallas
Los Angeles
Dallas
2020
71.0%
65.1%
26.9%
33.4%
2.1%
1.4%
2016
72.0%
60.8%
22.5%
34.7%
5.5%
4.5%
2012
69.7%
57.3%
27.8%
41.8%
2.4%
1.0%
2008
69.2%
57.4%
28.8%
42.0%
1.9%
0.6%
2004
63.3%
49.0%
35.7%
50.4%
1.0%
0.5%
2000
63.6%
45.0%
32.4%
52.7%
4.0%
2.4%
1996
59.3%
46.0%
31.0%
46.8%
9.7%
7.2%
Breakdown of population affiliated with a religious congregation
Type
Adherents
Congregations
Religion
Los Angeles
Dallas
Los Angeles
Dallas
CATHOLIC CHURCH
36.1%
18.9%
4.7%
2.4%
SOUTHERN BAPTIST CONVENTION
1.0%
11.0%
9.0%
31.1%
MUSLIM ESTIMATE
0.7%
3.6%
1.0%
1.1%
AMERICAN BAPTIST CHURCHES IN THE USA
0.5%
0.1%
3.1%
0.2%
SEVENTH DAY ADVENTIST CHURCH
0.5%
0.5%
2.4%
1.7%
EPISCOPAL CHURCH
0.4%
1.0%
1.4%
1.5%
EVANGELICAL LUTHERAN CHURCH IN AMERICA
0.2%
0.3%
1.9%
0.9%
Weather
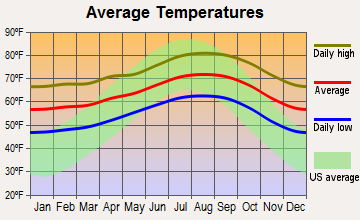
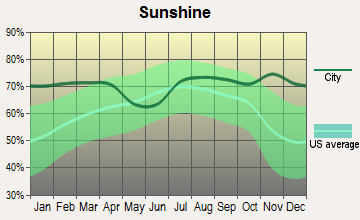
Los Angeles boasts a Mediterranean climate with dry summers and mild winters. It's an ideal location for people who enjoy a year-round warm climate. In contrast, Dallas has a humid subtropical climate. Summers can be hot and humid, while winters are mild to cool.
Weather and climate
Type
Los Angeles
Dallas
Temperature - Average
63.9°F
66.6°F
Humidity - Average morning or afternoon humidity
60.9%
71.3%
Humidity - Differences between morning and afternoon humidity
16.1%
34%
Humidity - Maximum monthly morning or afternoon humidity
65.1%
82%
Humidity - Minimum monthly morning or afternoon humidity
49%
48%
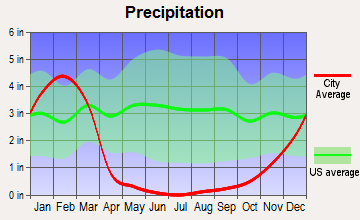
Precipitation - Yearly average
17.1 in
37.3 in
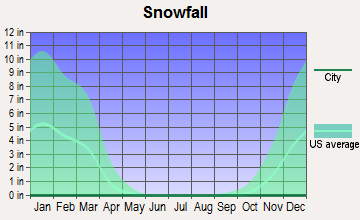
Snowfall - Yearly average
0 in
4.2 in
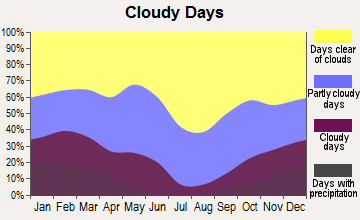
Clouds - Number of days clear of clouds
29.9%
22.8%
Sunshine amount - Average
78.4%
66.6%
Sunshine amount - Differences during a year
22%
20%
Sunshine amount - Maximum monthly
85%
74%
Sunshine amount - Minimum monthly
63%
54%
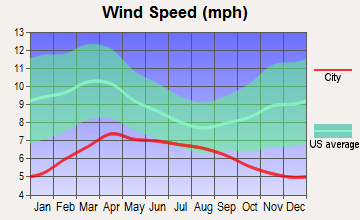
Wind speed - Average
2.1 mph
10.3 mph
Average climate in Los Angeles, California
Average climate in Dallas, Texas
Air pollution
Type
AQI
CO
NO2
OZONE
PB
PM10
PM25
SO2
Year
Los Angeles
Dallas
Los Angeles
Los Angeles
Dallas
Los Angeles
Dallas
Los Angeles
Dallas
Los Angeles
Los Angeles
Dallas
Los Angeles
Dallas
2018
137
86
0.38
N/A
9.9
5.7
26.9
28.7
0.008
N/A
24.4
N/A
16.0
9.7
0.4
0.4
2017
136
84
0.41
N/A
10.3
5.5
27.2
28.6
0.007
N/A
25.0
N/A
16.2
9.1
0.5
0.3
2016
128
81
0.37
N/A
10.0
6.1
27.7
27.2
0.007
N/A
23.8
N/A
15.4
8.4
0.4
0.2
2015
128
85
0.38
N/A
10.9
6.5
28.5
26.7
0.005
N/A
21.8
N/A
17.4
8.9
0.3
0.3
2014
139
83
0.50
N/A
12.0
6.3
27.8
27.6
0.007
N/A
26.4
N/A
19.9
9.9
0.3
0.3
2013
140
97
0.48
N/A
11.8
7.3
26.2
28.8
0.007
N/A
25.5
N/A
19.0
13.0
0.3
0.2
2012
144
116
0.48
N/A
10.9
8.6
26.3
31.0
0.008
N/A
24.8
N/A
19.9
12.0
0.4
0.3
2011
141
98
0.38
N/A
13.4
9.4
24.2
30.9
0.009
N/A
32.4
N/A
18.3
11.9
0.3
0.6
2010
127
79
0.44
N/A
12.2
9.4
23.2
28.3
0.027
N/A
33.9
N/A
17.3
N/A
0.5
0.7
2009
153
88
0.51
N/A
16.0
9.2
24.0
28.8
0.009
N/A
45.2
N/A
18.8
N/A
1.1
0.5
2008
145
88
0.37
N/A
14.0
9.8
24.8
29.2
0.010
0.121
44.7
N/A
19.5
N/A
1.0
0.5
2007
121
94
0.39
N/A
14.0
11.0
24.3
25.7
0.013
0.070
N/A
N/A
N/A
N/A
1.9
0.3
2006
131
107
0.38
N/A
15.4
10.8
23.1
30.6
0.006
0.106
N/A
N/A
N/A
N/A
1.9
0.7
2005
132
108
0.43
N/A
12.8
13.0
24.1
29.7
0.012
0.142
N/A
N/A
N/A
11.0
3.7
0.9
2004
142
96
0.64
N/A
17.6
12.3
27.5
26.0
0.016
0.099
N/A
N/A
N/A
N/A
2.5
0.8
2003
145
102
0.94
N/A
27.1
13.6
19.8
27.1
0.030
0.121
N/A
N/A
N/A
N/A
2.1
1.0
2002
154
100
1.04
N/A
31.3
14.0
21.7
25.2
0.027
0.080
N/A
N/A
N/A
N/A
2.4
0.4
2001
135
100
1.16
N/A
37.0
14.3
18.7
26.0
0.041
0.069
N/A
N/A
N/A
N/A
2.4
1.0
2000
147
109
1.13
N/A
31.1
14.5
16.7
27.0
0.035
0.092
N/A
N/A
N/A
N/A
1.4
1.1
Natural disasters
Type
Los Angeles
Dallas
Tornado activity compared to U.S. average
16.2%
254.7%
Earthquake activity compared to U.S. average
7,082.4%
567%
Natural disasters compared to U.S. average
57%
21%
Transportation
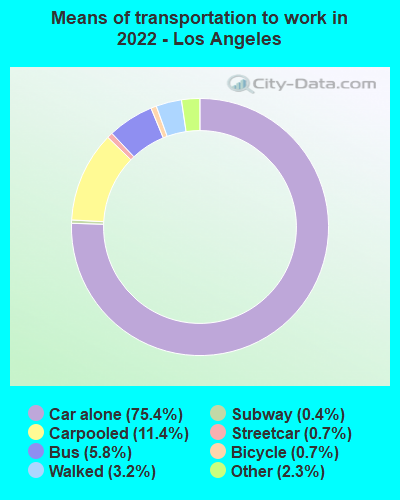
Los Angeles boasts an extensive public transit system with an expanding Metro Rail network. A sizable percentage of LA residents commute by car, leading to heavy traffic. Dallas, on the other hand, also has a comprehensive public transportation with a light rail and bus system. Car ownership is common in Dallas, and traffic congestion is less severe than in LA.
Transport
Type
Los Angeles
Dallas
Amtrak stations
1
1
Amtrak stations nearby
3
1
FAA registered aircraft
669
2
FAA registered aircraft manufacturers and dealers
14
56
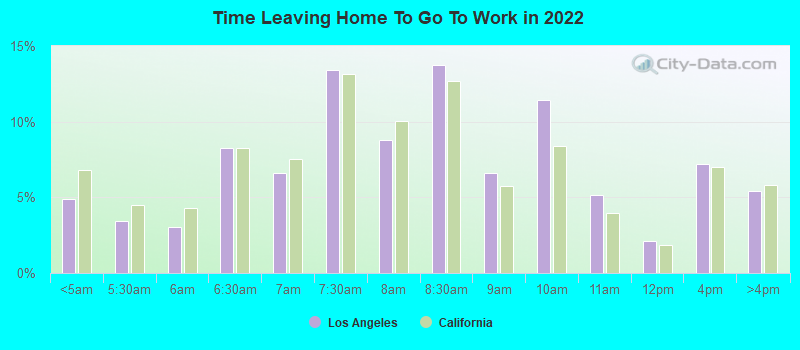
Means of transportation to work
Type
Los Angeles
Dallas
Bicycle
0.6%
0.3%
Bus
5.8%
1.4%
Carpooled
10.6%
10.9%
Car alone
76.5%
83.9%
Ferryboat
0.2%
0%
Motorcycle
0.2%
0%
Railroad
0.1%
0.2%
Streetcar
0.5%
0.1%
Subway
0.2%
0.2%
Taxicab
0.1%
0.1%
Walked
3%
1.6%
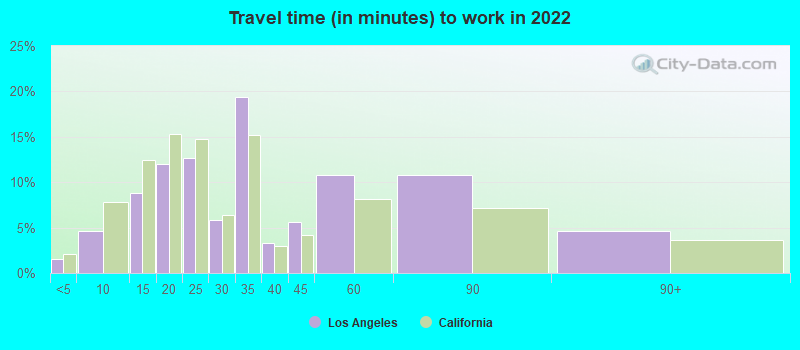
Average travel time to work
Type
Los Angeles
Dallas
Average
34.8 min
31.5 min
Other means
28.5 min
26.5 min
Public transportation
46.4 min
46 min
Private vehicle occupancy
Type
Los Angeles
Dallas
Average
1.2
1.2
Drove alone
87.4%
86.8%
In 2 person carpool
10.1%
9%
In 3 person carpool
1.6%
2.6%
In 4 person carpool
0.5%
0.9%
In 5-6 person carpool
0.3%
0.5%
In 7+ person carpool
0.1%
0.2%
How many people usually rode to work in the car, truck or van.
Real Estate
Los Angeles's real estate market is higher priced, with diverse options from luxury beachfront properties to suburban houses. In contrast, Dallas has a more affordable housing market with a wide range of options from condos to detached homes.
Neighborhoods
Los Angeles neighborhoods each have a unique vibe, from the upscale Beverly Hills to the bohemian Silver Lake. Dallas is home to charming neighborhoods like Uptown, known for its nightlife and Deep Ellum, filled with art and music venues.
Houses and residents
Type
Los Angeles
Dallas
Houses
1,542,391
591,773
Average household size (people)
2.8
2.6
Median year apartment built
1970
1987
Median year house/condo built
1957
1969
Length of stay in the house since moving in
16 years
13.9 years
Houses occupied
1,410,594 (91.5%)
536,008 (90.6%)
Houses occupied by owners
521,485 (37%)
229,518 (42.8%)
Houses occupied by renters
889,109 (63%)
306,490 (57.2%)
Median rent asked for vacant for-rent units
$2,146
$1,403
Median monthly housing costs
$1,845
$1,225
Median price asked for vacant for-sale houses and condos
$1,410,311
$574,934
Estimated median house or condo value
$812,800
$267,600
Median numbers of rooms
4.1
4.6
Median number of rooms in apartments
3.4
3.7
Median number of rooms in houses and condos
5.8
6.1
Median house price - detached houses
Over $1,000,000
$410,272
Median house price - in 2-unit structures
$906,968
$255,160
Median house price - in 3-to-4-unit structures
$752,598
$230,927
Median house price - in 5 or more unit structures
$760,192
$444,589
Median house price - mobile homes
$204,691
$91,039
Median house price - Townhouses or other attached units
$809,932
$350,045
Median house price - All housing units
Over $1,000,000
$402,215
Median house age
57
40
Renting percentage
61.8%
55.9%
Housing density (houses/condos per square mile)
3,288.2
1,727.6
House value disparities
23.2%
41.3%
Household income disparities
47.7%
48.2%
Median household income for houses/condes with a mortgage
$122,032
$103,798
Median household income for apartments without a mortgage
$83,712
$61,909
Housing units without a mortgage
5,970 (1.6%)
1,309 (1%)
Housing units with both a second mortgage and home equity loan
28,556 (7.6%)
3,320 (2.6%)
Housing units with a mortgage
369,242 (98.4%)
124,846 (99%)
Housing units with a home equity loan
2,061 (0.5%)
204 (0.2%)
Housing units with a second mortgage
37,750 (10.1%)
5,351 (4.2%)
House/condo owner moved in on average (years ago)
15
12
House/condo renter moved in on average (years ago)
4
1
Housing units lacking complete kitchen facilities
3.1%
1.2%
Housing units lacking complete plumbing facilities
0.9%
0.9%
Housing units in structures
Housing units in structures
Los Angeles
Dallas
One, detached
37.2%
41.8%
One, attached
5.7%
4.3%
Two
2.8%
1.5%
3 or 4
6.3%
4.9%
5 to 9
8.9%
7.9%
10 to 19
9.5%
12.1%
20 to 49
13.1%
8.1%
50 or more
15.9%
18.4%
Mobile homes
0.6%
1.0%
Median real estate property taxes paid for housing units
Self-employed workers in own not incorporated business
200,073
43,703
State government workers
54,504
17,325
Unpaid family workers
4,643
754
Industries and Occupations
Los Angeles is dominated by entertainment, digital media, and technology industries. However, in Dallas, the leading industries are financial services, information technology, and healthcare.
Both Los Angeles and Dallas boast high-quality healthcare facilities. Los Angeles has world-class medical centers like the Ronald Reagan UCLA Medical Center and Cedars-Sinai. Dallas is home to standout healthcare institutions like Baylor University Medical Center and UT Southwestern Medical Center.
Health (county statistics)
Type
Los Angeles
Dallas
General health status score of residents in this county from 1 (poor) to 5 (excellent)
Los Angeles is noted for its sprawling infrastructure including extensive freeways, intercity rail, and two international airports. Dallas is known for its modern infrastructure featuring an advanced road system, and a light rail network.
Infrastructure
Type
Los Angeles
Dallas
Hospitals
62
74
TV stations
21
25
Arenas or stadiums
5
2
Bank branches located here
385
394
Bank institutions located here
73
80
Main business address for public companies
69
122
Drinking water stations with no reported violations in the past
5
8
Drinking water stations with reported violations in the past
HMDA - Conventional home purchase loans - Applications denied
Year
Los Angeles
Dallas
1999
10,170
5,030
2000
9,527
3,390
2001
7,928
2,626
2002
9,092
2,657
2003
14,114
3,617
2004
18,901
5,460
2005
22,524
7,445
2006
26,600
7,397
2007
19,394
5,056
2008
7,924
2,200
2009
4,210
1,121
Culture and Food
Los Angeles, as a hub of global entertainment, has a vibrant cultural scene, hosting countless museum and art galleries. LA is renowned for culinary diversity, ranging from upscale dining to food trucks. Dallas's rich history and culture can be explored in locations like the Dallas Museum of Art and the Sixth Floor Museum. Dallas has a thriving food scene, particularly known for its barbecue and Tex-Mex cuisine.
Sports Teams
Los Angeles is home to a host of prominent sports teams, like the Los Angeles Lakers in the NBA and the Los Angeles Dodgers in the MLB. Dallas is also a sports powerhouse, with teams like the Dallas Cowboys in the NFL, the Dallas Mavericks in the NBA and the Texas Rangers in MLB.


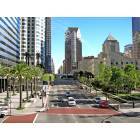
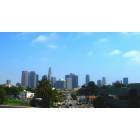


 Los Angeles, CA
 Dallas, TX