Los Angeles, known globally for its movie-making industry while the East San Gabriel Valley is famous for its community-rich suburban lifestyle. Both the city and the suburb provide unique experiences with differences in crime rates, cost of living, educational opportunities, economic growth, infrastructural developments, and more. The comparison between the two focuses on the defining aspects of these regions, considering the perspective of both potential relocations and tourists.
Los Angeles, as a larger city, has a higher crime rate compared to East San Gabriel Valley. However, it’s important to note that crime rates vary substantially by neighborhood. East San Gabriel Valley, with its suburban setting, tends to feature a safer environment, which is why it is often preferred by families. Both areas are making significant efforts to improve overall safety.
Cost of Living
The cost of living in Los Angeles is notably higher than in East San Gabriel Valley. Everything from housing to groceries tends to cost more in Los Angeles. East San Gabriel Valley, while not cheap, is generally more affordable to live in than LA.
Income Tax
California has a progressive income tax, with the same rates applied to both regions.
Property Tax
Both areas are subjected to California's property tax rate, which is approximately 1.1% of the property's assessed value, although effective rates in LA tend to be slightly higher due to higher property valuations.
Sales Tax
Los Angeles has a sales tax rate of 9.5%, which is higher than the 7.25% in East San Gabriel Valley.
Income
Type
Los Angeles
East San Gabriel Valley
Estimated median household income
$70,372
$95,242
Estimated per capita income
$39,509
$34,474
Cost of living index (U.S. average is 100)
145.1
150.2
If you make $50,000 in Los Angeles, you will have to make $51,757 in East San Gabriel Valley to maintain the same standard of living.
Geographical Conditions
LA is on the coast with beautiful beaches while East San Gabriel Valley is inland with suburban layouts. Hiking opportunities abound in both regions, but East San Gabriel Valley is closer to major mountain ranges.
Geographical information
Type
Los Angeles
East San Gabriel Valley
Land area
469.1 sq. miles
212.6 sq. miles
Population density
8,206.1 people per sq. mile
4,478.5 people per sq. mile
Relative area comparison
Los Angeles, CA East San Gabriel Valley, CA
Education
Los Angeles is home to prestigious universities like the University of Southern California and UCLA. East San Gabriel Valley, while not having these esteemed institutions, does have good schools and community colleges providing quality education.
Los Angeles' economy is driven by the entertainment, technology, aviation, fashion, and tourism industries. East San Gabriel Valley, on the other hand, has more opportunities in healthcare, retail, and education sectors.
Biggest Employers
The biggest employers in LA include the City of Los Angeles, UCLA, and Universal Pictures. In East San Gabriel, some of the largest employers are Walmart, Mt. San Antonio College, and Citrus Valley Medical Center.
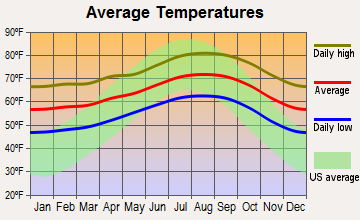
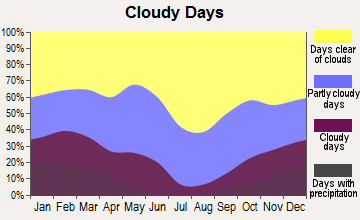
Weather
Both Los Angeles and East San Gabriel Valley enjoy a Mediterranean climate characterized by mild, wet winters and hot, dry summers. However, being farther inland, East San Gabriel Valley can experience more temperature extremes compared to coastal Los Angeles.
Weather and climate
Type
Los Angeles
East San Gabriel Valley
Temperature - Average
63.9°F
62.7°F
Humidity - Average morning or afternoon humidity
60.9%
64.7%
Humidity - Differences between morning and afternoon humidity
16.1%
19.6%
Humidity - Maximum monthly morning or afternoon humidity
65.1%
70.7%
Humidity - Minimum monthly morning or afternoon humidity
49%
51%
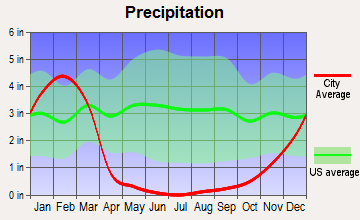
Precipitation - Yearly average
17.1 in
19.1 in
Snowfall - Yearly average
0 in
0 in
Clouds - Number of days clear of clouds
29.9%
28.3%
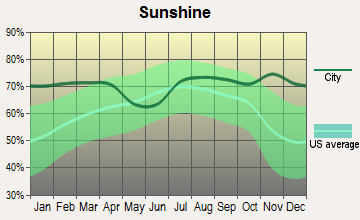
Sunshine amount - Average
78.4%
78.4%
Sunshine amount - Differences during a year
22%
22%
Sunshine amount - Maximum monthly
85%
85%
Sunshine amount - Minimum monthly
63%
63%
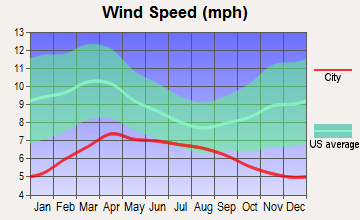
Wind speed - Average
2.1 mph
3.7 mph
Average climate in Los Angeles, California
Average climate in East San Gabriel Valley, California
Air pollution
Type
AQI
CO
NO2
OZONE
PB
PM10
PM25
SO2
Year
Los Angeles
East San Gabriel Valley
Los Angeles
East San Gabriel Valley
Los Angeles
East San Gabriel Valley
Los Angeles
East San Gabriel Valley
Los Angeles
East San Gabriel Valley
Los Angeles
East San Gabriel Valley
Los Angeles
East San Gabriel Valley
Los Angeles
East San Gabriel Valley
2018
137
143
0.38
0.36
9.9
14.1
26.9
29.2
0.008
0.007
24.4
29.6
16.0
13.4
0.4
0.3
2017
136
150
0.41
0.35
10.3
14.8
27.2
30.5
0.007
0.007
25.0
32.7
16.2
12.6
0.5
0.3
2016
128
141
0.37
0.31
10.0
15.5
27.7
29.3
0.007
0.007
23.8
30.3
15.4
12.0
0.4
0.3
2015
128
145
0.38
0.30
10.9
15.2
28.5
30.4
0.005
0.007
21.8
30.0
17.4
14.6
0.3
0.2
2014
139
142
0.50
0.32
12.0
16.8
27.8
29.7
0.007
0.008
26.4
33.6
19.9
11.7
0.3
0.3
2013
140
147
0.48
0.33
11.8
17.0
26.2
27.7
0.007
0.007
25.5
31.5
19.0
11.5
0.3
0.4
2012
144
149
0.48
0.39
10.9
18.3
26.3
27.5
0.008
0.005
24.8
30.9
19.9
15.6
0.4
0.6
2011
141
149
0.38
0.40
13.4
18.6
24.2
26.7
0.009
0.008
32.4
30.3
18.3
17.3
0.3
0.5
2010
127
139
0.44
0.44
12.2
19.3
23.2
26.8
0.027
N/A
33.9
26.6
17.3
14.8
0.5
0.4
2009
153
156
0.51
0.40
16.0
21.0
24.0
28.0
0.009
0.010
45.2
26.0
18.8
16.5
1.1
0.6
2008
145
156
0.37
0.48
14.0
22.7
24.8
27.7
0.010
0.012
44.7
27.0
19.5
15.1
1.0
1.0
2007
121
135
0.39
0.52
14.0
25.3
24.3
24.8
0.013
0.014
N/A
N/A
N/A
N/A
1.9
1.3
2006
131
128
0.38
0.55
15.4
25.1
23.1
24.0
0.006
0.009
N/A
N/A
N/A
N/A
1.9
1.9
2005
132
127
0.43
0.59
12.8
25.7
24.1
22.8
0.012
0.014
N/A
N/A
N/A
N/A
3.7
1.9
2004
142
132
0.64
0.68
17.6
25.4
27.5
24.6
0.016
0.016
N/A
N/A
N/A
N/A
2.5
1.7
2003
145
137
0.94
0.80
27.1
29.9
19.8
24.7
0.030
0.021
N/A
N/A
N/A
N/A
2.1
1.4
2002
154
134
1.04
0.83
31.3
31.4
21.7
23.1
0.027
0.021
N/A
N/A
N/A
N/A
2.4
2.0
2001
135
141
1.16
1.00
37.0
31.8
18.7
21.4
0.041
0.029
N/A
N/A
N/A
N/A
2.4
2.1
2000
147
150
1.13
1.05
31.1
34.7
16.7
20.7
0.035
0.027
N/A
N/A
N/A
N/A
1.4
2.0
Natural disasters
Type
Los Angeles
East San Gabriel Valley
Tornado activity compared to U.S. average
16.2%
18.5%
Earthquake activity compared to U.S. average
7,082.4%
7,292.4%
Natural disasters compared to U.S. average
57%
57%
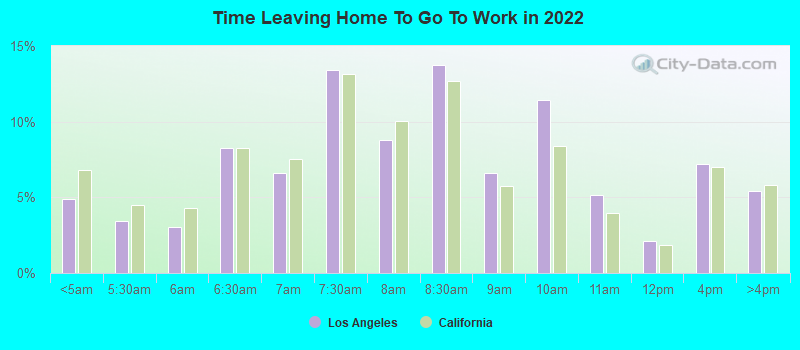
Transportation
LA has a complex network of metro lines and bus services run by LA Metro. East San Gabriel Valley lacks this extensive public transport but most areas are easily accessible by car and limited public bus services.
Transport
Type
Los Angeles
East San Gabriel Valley
Amtrak stations
1
0
Amtrak stations nearby
3
3
FAA registered aircraft
669
0
FAA registered aircraft manufacturers and dealers
14
0
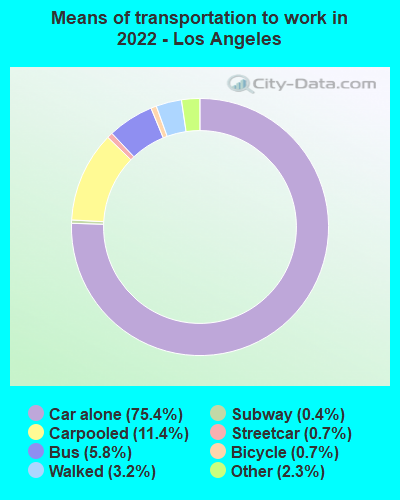
Means of transportation to work
Type
Los Angeles
East San Gabriel Valley
Bicycle
0.6%
0.6%
Bus
5.8%
2.9%
Carpooled
10.6%
17.1%
Car alone
76.5%
73.3%
Ferryboat
0.2%
0%
Motorcycle
0.2%
0.2%
Railroad
0.1%
0.6%
Streetcar
0.5%
0%
Subway
0.2%
0.1%
Taxicab
0.1%
0%
Walked
3%
2.2%
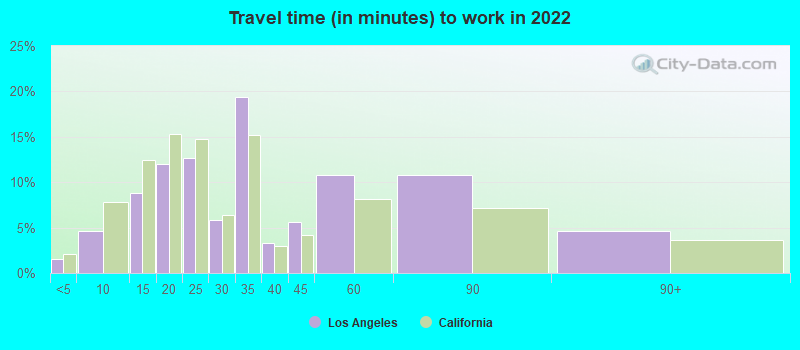
Average travel time to work
Type
Los Angeles
East San Gabriel Valley
Average
34.8 min
32.3 min
Real Estate
Real estate in LA is significantly more expensive than in East San Gabriel Valley. LA has a wide range of options from luxury condos to houses, while East San Gabriel Valley primarily offers single-family homes.
Neighborhoods
LA is known for its glamorous neighborhoods like Beverly Hills and Hollywood. On the other hand, East San Gabriel Valley boasts of quiet, family-friendly communities like Glendora and Walnut.
Houses and residents
Type
Los Angeles
East San Gabriel Valley
Houses
1,542,391
270,240
Average household size (people)
2.8
3.5
Houses occupied
1,410,594 (91.5%)
263,338 (97.4%)
Houses occupied by owners
521,485 (37%)
180,683 (68.6%)
Houses occupied by renters
889,109 (63%)
82,655 (31.4%)
Median rent asked for vacant for-rent units
$2,146
$1,935
Median price asked for vacant for-sale houses and condos
$1,410,311
$1,138,428
Estimated median house or condo value
$812,800
$643,048
Median number of rooms in apartments
3.4
3.7
Median number of rooms in houses and condos
5.8
5.9
Renting percentage
61.8%
32.3%
Housing density (houses/condos per square mile)
3,288.2
1,270.8
Household income disparities
47.7%
40.3%
Housing units without a mortgage
5,970 (1.6%)
26,635 (16.4%)
Housing units with both a second mortgage and home equity loan
28,556 (7.6%)
515 (0.3%)
Housing units with a mortgage
369,242 (98.4%)
136,243 (83.6%)
Housing units with a home equity loan
2,061 (0.5%)
11,429 (7%)
Housing units with a second mortgage
37,750 (10.1%)
21,150 (13%)
Housing units lacking complete kitchen facilities
3.1%
1%
Housing units lacking complete plumbing facilities
Self-employed workers in own not incorporated business
200,073
25,753
State government workers
54,504
13,845
Unpaid family workers
4,643
1,494
Industries and Occupations
In LA, the primary occupations are in entertainment, tech, fashion, and tourism. In East San Gabriel Valley, most people work in healthcare, retail, and education sectors.
Health Care
Both regions offer excellent health care services, but LA offers more medical facilities due to its size. Major health care centers in LA include UCLA Medical Center and Cedars Sinai.
Infrastructure
LA boasts of robust infrastructure with world-class airports, highways, and ports. East San Gabriel Valley's infrastructure, though not as grand, is well-developed to support its suburban lifestyle.
Infrastructure
Type
Los Angeles
East San Gabriel Valley
TV stations
21
24
Culture and Food
LA is known for its vibrant cultural scene with globally recognized film festivals, art exhibits, and music concerts. It offers diverse food options from around the world. East San Gabriel Valley is home to a thriving Asian community which influences its unique cultural and dining experiences.
Sports Teams
LA is home to many professional sports teams in the NBA, NFL, and MLB, and hosts global sporting events. East San Gabriel Valley doesn't have professional teams and the residents generally support LA's teams.
 Los Angeles, CA
 East San Gabriel Valley, CA