Los Angeles, CA and San Jose, CA offer varying experiences in terms of living, studying, working, and visiting. These two Californian giants are known for their kaleidoscope of cultures, vibrant scenes, and contrasting facets that align with different lifestyles. The following comparison focuses on their crime/safety rate, weather, cost of living, education, work and economy, infrastructure, industries and occupations, biggest employers, real-estate, neighborhoods, transportation, taxes, culture/food, sports teams, geographical conditions, and health care.
Distance between
Los Angeles, CA and
San Jose, CA : 296.5 miles
Los Angeles's population is larger by 291%. Its population has grown by 154,477 people (4.2%) since 2000. The population of San Jose has grown by 88,546 people (9.9%) during that time.
Los Angeles is known to have a higher crime rate than San Jose, though specific areas within Los Angeles do enjoy higher safety levels. San Jose experiences less crime overall, making it generally safer. Tourists visiting both cities are advised to stay vigilant and follow local guidance to avoid unsafe areas.
City-data.com crime index counts serious crimes and violent crime more heavily. It adjusts for the number of visitors and daily workers commuting into cities. (higher means more crime, U.S. average = 301.1)
City-data.com crime index counts serious crimes and violent crime more heavily. It adjusts for the number of visitors and daily workers commuting into cities. (higher means more crime, U.S. average = 301.1)
Sex Offenders
According to our data, there are 4,425 registered sex offenders living in Los Angeles and 1,806 registered sex offenders living in . The ratio of residents to sex offenders in Los Angeles is 899 to 1; the ratio in San Jose is 568 to 1. The number of registered sex offenders compared to the number of residents is a smaller in Los Angeles than in San Jose.
Cost of Living
San Jose is known for its high cost of living, primarily due to expensive housing. On the other hand, Los Angeles, while also quite pricey, is generally less expensive than San Jose. Those wishing to relocate will want to factor in the relative costs.
Income Tax
Both cities follow California's progressive income tax, which ranges from 1% to 13.3%. The tax is the same across the state, but the cost of living can inflate income and potentially push residents into higher tax brackets.
Property Tax
Property tax rates in California are among the lowest in the US. However, due to high real estate prices in both cities, actual tax payments can still be significant.
Sales Tax
Both cities are within California and share a high sales tax rate. The state's base rate is 7.25%, but with local additions, it is 9.50% in Los Angeles and 9.25% in San Jose.
Income
Type
Los Angeles
San Jose
Estimated median household income
$70,372
$126,377
Estimated per capita income
$39,509
$57,357
Cost of living index (U.S. average is 100)
145.1
127.4
If you make $50,000 in San Jose, you will have to make $56,947 in Los Angeles to maintain the same standard of living.
Geographical Conditions
Los Angeles is sited between mountains and the Pacific Ocean, offering a variety of landscapes and natural features. San Jose is nestled in the Santa Clara Valley, surrounded by mountains on three sides, offering a more serene setting.
Los Angeles boasts notable universities like UCLA and USC, making it an educational hub. San Jose, part of Silicon Valley, hosts prestigious institutions like San Jose State University and is proximate to Stanford University. Both cities offer ample educational opportunities, though the focus in San Jose is more tech-oriented.
Los Angeles has a diverse economy with entertainment, fashion, and technology sectors leading. San Jose is the heart of Silicon Valley, so tech dominates. Therefore, employment preferences may influence relocation decisions.
Biggest Employers
The County of Los Angeles, the University of Southern California, and Northrop Grumman are LA's top employers. Leading employers in San Jose include Cisco Systems, eBay, and Adobe systems, along with numerous other tech firms.
There were 2,475 building permits issued in Los Angeles in 2012 (1950 more than in 2011) compared to 299 building permits issued in San Jose in 2012 (216 more than in 2011).
In Los Angeles (Los Angeles County), 69.7% voted for Democrats and 27.8% for Republicans in 2012 Presidential Election. In San Jose (Santa Clara County), 70.0% voted for Democrats and 27.1% for Republicans.
Elections
Type
Democrats
Republicans
Other
Year
Los Angeles
San Jose
Los Angeles
San Jose
Los Angeles
San Jose
2020
71.0%
72.7%
26.9%
25.2%
2.1%
2.1%
2016
72.0%
72.7%
22.5%
20.6%
5.5%
6.7%
2012
69.7%
70.0%
27.8%
27.1%
2.4%
2.9%
2008
69.2%
69.6%
28.8%
28.6%
1.9%
1.8%
2004
63.3%
64.3%
35.7%
34.8%
1.0%
0.9%
2000
63.6%
60.7%
32.4%
34.4%
4.0%
4.9%
1996
59.3%
56.9%
31.0%
32.2%
9.7%
11.0%
Breakdown of population affiliated with a religious congregation
Type
Adherents
Congregations
Religion
Los Angeles
San Jose
Los Angeles
San Jose
CATHOLIC CHURCH
36.1%
25.1%
4.7%
6.0%
SOUTHERN BAPTIST CONVENTION
1.0%
0.9%
9.0%
7.7%
MUSLIM ESTIMATE
0.7%
1.1%
1.0%
1.8%
AMERICAN BAPTIST CHURCHES IN THE USA
0.5%
0.1%
3.1%
1.1%
SEVENTH DAY ADVENTIST CHURCH
0.5%
0.4%
2.4%
2.6%
EPISCOPAL CHURCH
0.4%
0.5%
1.4%
2.3%
EVANGELICAL LUTHERAN CHURCH IN AMERICA
0.2%
0.3%
1.9%
2.3%
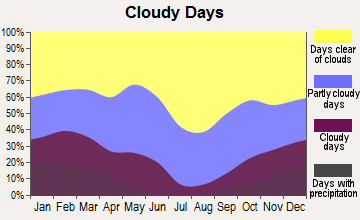
Weather
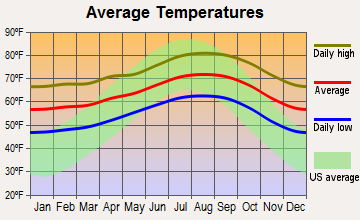
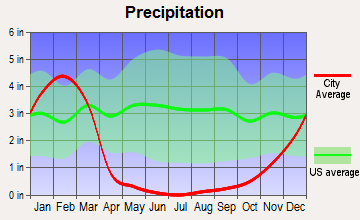
Los Angeles has a Mediterranean climate, enjoying mild, fairly wet winters and warm to hot, mostly dry summers. San Jose, however, experiences a more temperate climate, with more than 300 sunny days a year. For those who prefer mild, sunny weather, San Jose may be a better fit.
Weather and climate
Type
Los Angeles
San Jose
Temperature - Average
63.9°F
60.9°F
Humidity - Average morning or afternoon humidity
60.9%
77.3%
Humidity - Differences between morning and afternoon humidity
16.1%
35.5%
Humidity - Maximum monthly morning or afternoon humidity
65.1%
87%
Humidity - Minimum monthly morning or afternoon humidity
49%
51.6%
Precipitation - Yearly average
17.1 in
16.1 in
Snowfall - Yearly average
0 in
0 in
Clouds - Number of days clear of clouds
29.9%
27.4%
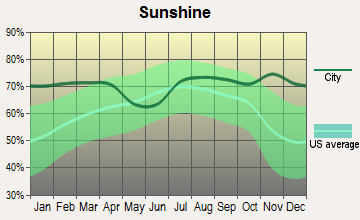
Sunshine amount - Average
78.4%
73.8%
Sunshine amount - Differences during a year
22%
23%
Sunshine amount - Maximum monthly
85%
77.4%
Sunshine amount - Minimum monthly
63%
54.4%
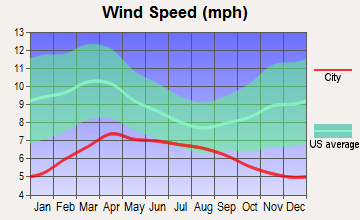
Wind speed - Average
2.1 mph
10.3 mph
Average climate in Los Angeles, California
Average climate in San Jose, California
Air pollution
Type
AQI
CO
NO2
OZONE
PB
PM10
PM25
SO2
Year
Los Angeles
San Jose
Los Angeles
San Jose
Los Angeles
San Jose
Los Angeles
San Jose
Los Angeles
San Jose
Los Angeles
Los Angeles
San Jose
Los Angeles
San Jose
2018
137
94
0.38
0.49
9.9
14.5
26.9
22.2
0.008
0.006
24.4
N/A
16.0
12.5
0.4
0.2
2017
136
91
0.41
0.50
10.3
14.6
27.2
23.5
0.007
0.004
25.0
N/A
16.2
10.2
0.5
0.2
2016
128
69
0.37
0.47
10.0
13.7
27.7
22.4
0.007
0.003
23.8
N/A
15.4
8.8
0.4
0.2
2015
128
84
0.38
0.52
10.9
15.4
28.5
22.3
0.005
0.004
21.8
N/A
17.4
9.2
0.3
0.3
2014
139
83
0.50
0.40
12.0
13.9
27.8
21.5
0.007
0.004
26.4
N/A
19.9
8.2
0.3
0.2
2013
140
90
0.48
0.41
11.8
15.2
26.2
20.8
0.007
0.005
25.5
N/A
19.0
12.4
0.3
0.3
2012
144
74
0.48
0.35
10.9
13.3
26.3
21.8
0.008
0.003
24.8
N/A
19.9
10.1
0.4
0.3
2011
141
83
0.38
0.37
13.4
14.8
24.2
20.6
0.009
0.003
32.4
N/A
18.3
12.3
0.3
0.3
2010
127
88
0.44
0.35
12.2
14.4
23.2
20.4
0.027
0.004
33.9
N/A
17.3
9.0
0.5
0.4
2009
153
89
0.51
0.40
16.0
14.7
24.0
18.2
0.009
0.004
45.2
N/A
18.8
9.3
1.1
0.3
2008
145
100
0.37
0.45
14.0
16.7
24.8
20.6
0.010
N/A
44.7
N/A
19.5
12.6
1.0
N/A
2007
121
92
0.39
0.44
14.0
16.6
24.3
20.0
0.013
0.009
N/A
N/A
N/A
11.1
1.9
N/A
2006
131
100
0.38
0.46
15.4
18.0
23.1
21.8
0.006
N/A
N/A
N/A
N/A
11.1
1.9
N/A
2005
132
95
0.43
0.68
12.8
18.6
24.1
20.0
0.012
N/A
N/A
N/A
N/A
11.6
3.7
N/A
2004
142
98
0.64
0.63
17.6
18.5
27.5
20.4
0.016
N/A
N/A
N/A
N/A
9.9
2.5
N/A
2003
145
87
0.94
0.73
27.1
20.6
19.8
19.1
0.030
N/A
N/A
N/A
N/A
N/A
2.1
N/A
2002
154
78
1.04
0.65
31.3
19.5
21.7
18.0
0.027
0.006
N/A
N/A
N/A
N/A
2.4
N/A
2001
135
75
1.16
0.61
37.0
18.5
18.7
16.8
0.041
0.008
N/A
N/A
N/A
N/A
2.4
N/A
2000
147
65
1.13
0.66
31.1
18.9
16.7
15.6
0.035
0.009
N/A
N/A
N/A
N/A
1.4
N/A
Natural disasters
Type
Los Angeles
San Jose
Tornado activity compared to U.S. average
16.2%
9%
Earthquake activity compared to U.S. average
7,082.4%
7,785.3%
Natural disasters compared to U.S. average
57%
19%
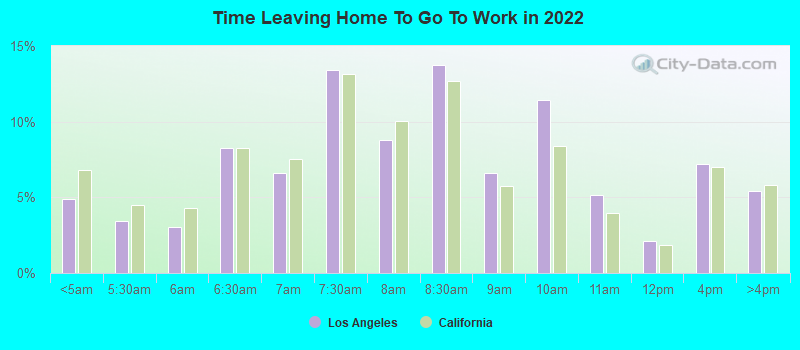
Transportation
Public transit is more extensive in Los Angeles, featuring a metro system and expansive bus network. San Jose relies more on cars, though it has public transit options. For commuters, these factors play a significant role.
Transport
Type
Los Angeles
San Jose
Amtrak stations
1
1
Amtrak stations nearby
3
3
FAA registered aircraft
669
553
FAA registered aircraft manufacturers and dealers
14
13
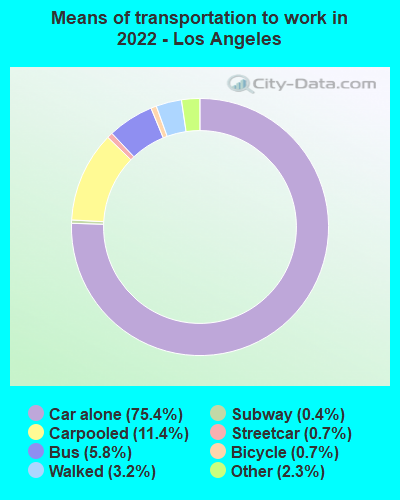
Means of transportation to work
Type
Los Angeles
San Jose
Bicycle
0.6%
1%
Bus
5.8%
1.1%
Carpooled
10.6%
11.4%
Car alone
76.5%
80.5%
Ferryboat
0.2%
0%
Motorcycle
0.2%
0.2%
Railroad
0.1%
0.2%
Streetcar
0.5%
0%
Subway
0.2%
0.2%
Taxicab
0.1%
0%
Walked
3%
3.3%
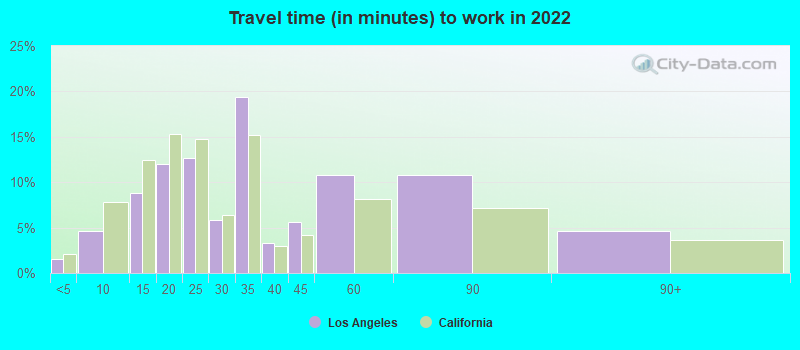
Average travel time to work
Type
Los Angeles
San Jose
Average
34.8 min
29.2 min
Other means
28.5 min
27.9 min
Public transportation
46.4 min
48.5 min
Private vehicle occupancy
Type
Los Angeles
San Jose
Average
1.2
1.2
Drove alone
87.4%
87.3%
In 2 person carpool
10.1%
8.9%
In 3 person carpool
1.6%
1.9%
In 4 person carpool
0.5%
1.1%
In 5-6 person carpool
0.3%
0.6%
In 7+ person carpool
0.1%
0.2%
How many people usually rode to work in the car, truck or van.
Real Estate
In general, real estate prices are higher in San Jose than Los Angeles. Both cities have robust housing markets, but the super pricy nature of San Jose's market is especially noteworthy.
Neighborhoods
Los Angeles is a patchwork of neighborhoods each offering a unique cultural experience. San Jose's neighborhoods are more homogenous, favoring a more suburban living style. Tourists can enjoy the diversity offered by both cities.
Houses and residents
Type
Los Angeles
San Jose
Houses
1,542,391
340,561
Average household size (people)
2.8
3.1
Median year apartment built
1970
1979
Median year house/condo built
1957
1973
Length of stay in the house since moving in
16 years
15.6 years
Houses occupied
1,410,594 (91.5%)
322,881 (94.8%)
Houses occupied by owners
521,485 (37%)
179,797 (55.7%)
Houses occupied by renters
889,109 (63%)
143,084 (44.3%)
Median rent asked for vacant for-rent units
$2,146
$3,214
Median monthly housing costs
$1,845
$2,463
Median price asked for vacant for-sale houses and condos
$1,410,311
$1,197,016
Estimated median house or condo value
$812,800
Over $1,000,000
Median numbers of rooms
4.1
4.9
Median number of rooms in apartments
3.4
3.6
Median number of rooms in houses and condos
5.8
6
Median house price - detached houses
Over $1,000,000
Over $1,000,000
Median house price - in 2-unit structures
$906,968
$753,788
Median house price - in 3-to-4-unit structures
$752,598
$680,453
Median house price - in 5 or more unit structures
$760,192
$688,625
Median house price - mobile homes
$204,691
$240,963
Median house price - occupied boats, rvs, vans etc.
$134,345
$55,872
Median house price - Townhouses or other attached units
$809,932
$892,629
Median house price - All housing units
Over $1,000,000
Over $1,000,000
Median house age
57
45
Renting percentage
61.8%
41.5%
Housing density (houses/condos per square mile)
3,288.2
1,947.6
House value disparities
23.2%
21.2%
Household income disparities
47.7%
38.3%
Median household income for houses/condes with a mortgage
$122,032
$197,583
Median household income for apartments without a mortgage
$83,712
$103,711
Housing units without a mortgage
5,970 (1.6%)
2,632 (2.1%)
Housing units with both a second mortgage and home equity loan
28,556 (7.6%)
13,499 (10.6%)
Housing units with a mortgage
369,242 (98.4%)
124,224 (97.9%)
Housing units with a home equity loan
2,061 (0.5%)
346 (0.3%)
Housing units with a second mortgage
37,750 (10.1%)
16,249 (12.8%)
House/condo owner moved in on average (years ago)
15
14
House/condo renter moved in on average (years ago)
4
3
Housing units lacking complete kitchen facilities
3.1%
1.2%
Housing units lacking complete plumbing facilities
0.9%
0.6%
Housing units in structures
Housing units in structures
Los Angeles
San Jose
One, detached
37.2%
50.9%
One, attached
5.7%
11.5%
Two
2.8%
1.1%
3 or 4
6.3%
5.0%
5 to 9
8.9%
5.1%
10 to 19
9.5%
4.5%
20 to 49
13.1%
4.5%
50 or more
15.9%
14.2%
Mobile homes
0.6%
3.1%
Boats, RVs, vans, etc.
0.0%
0.1%
Median real estate property taxes paid for housing units
Self-employed workers in own not incorporated business
200,073
28,517
State government workers
54,504
10,222
Unpaid family workers
4,643
472
Industries and Occupations
Job seekers in Los Angeles will find opportunities in industries like entertainment, fashion, and tourism. Tech professionals may prefer San Jose, a city teeming with tech companies and startups.
Both Los Angeles and San Jose have access to high-quality health care, with LA hosting renowned institutes like UCLA Health. San Jose is home to high-ranking hospitals like El Camino Health.
Health (county statistics)
Type
Los Angeles
San Jose
General health status score of residents in this county from 1 (poor) to 5 (excellent)
Los Angeles boasts a vast urban landscape, from beaches to skyscrapers. San Jose, predominantly suburban, offers its own charm with a noticeably cleaner environment. Infrastructure-related preferences should be considered when deciding to move or visit.
Infrastructure
Type
Los Angeles
San Jose
Hospitals
62
20
TV stations
21
9
Arenas or stadiums
5
2
Bank branches located here
385
145
Bank institutions located here
73
25
Main business address for public companies
69
74
Drinking water stations with no reported violations in the past
5
21
Drinking water stations with reported violations in the past
HMDA - Conventional home purchase loans - Applications denied
Year
Los Angeles
San Jose
1999
10,170
3,839
2000
9,527
2,577
2001
7,928
1,953
2002
9,092
1,908
2003
14,114
3,578
2004
18,901
5,489
2005
22,524
6,994
2006
26,600
6,324
2007
19,394
4,298
2008
7,924
2,419
2009
4,210
1,631
Culture and Food
Los Angeles is known for its culture, featuring influences from around the globe and a famous culinary scene. San Jose also offers a diverse food/culture scene, with a strong presence of Vietnamese and Mexican cultures.
Sports Teams
Los Angeles boasts numerous major league sports teams, like the Lakers, Dodgers, and Rams. San Jose, while not as sports-saturated, houses the Sharks and Earthquakes and is close to Santa Clara, where the 49ers play.

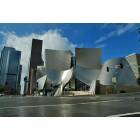
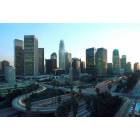
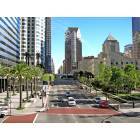
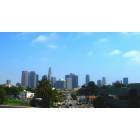


 Los Angeles, CA
 San Jose, CA