When comparing Miami, the vivacious and bohemian city, to Plantation, the charming 'little-big-town' in Florida, it's interesting to see how they compare across various aspects. Miami offers a rich cultural blend, sparkling city life, and is a global hub for tourism, business, and entertainment. On the contrary, Plantation has a quieter, suburban atmosphere with a higher focus on family-oriented living. This comparison delves into multiple aspects across crime and safety, weather, cost of living, and more, to help you understand the unique lifestyles these places offer.
Distance between
Miami, FL and
Plantation, FL : 23.3 miles
Miami's population is larger by 373%. Its population has grown by 77,420 people (21.4%) since 2000. The population of Plantation has grown by 10,052 people (12.1%) during that time.
Miami's crime rate is higher than the national average, primarily due to its larger population and status as a major city. On the other hand, Plantation's crime rate is marginally lower than the national average, indicative of its suburban character, which might appeal to families and those seeking quieter residential environments. However, both cities provide adequate law enforcement services.
City-data.com crime index counts serious crimes and violent crime more heavily. It adjusts for the number of visitors and daily workers commuting into cities. (higher means more crime, U.S. average = 301.1)
City-data.com crime index counts serious crimes and violent crime more heavily. It adjusts for the number of visitors and daily workers commuting into cities. (higher means more crime, U.S. average = 301.1)
Sex Offenders
According to our data, there are 1,381 registered sex offenders living in Miami and 19 registered sex offenders living in . The ratio of residents to sex offenders in Miami is 328 to 1; the ratio in Plantation is 4,901 to 1. The number of registered sex offenders compared to the number of residents is much larger in Miami than that in Plantation.
Cost of Living
The cost of living in Miami is higher than in Plantation, including housing, food, and entertainment expenses. Miami's thriving tourism and entertainment scenes significantly affect the pricing. In contrast, Plantation, being a suburban locale, has a more reasonable cost of living.
Income Tax
Both cities benefit from the state of Florida's lack of state income tax, a significant advantage for residents and employees.
Property Tax
Property tax is marginally higher in Miami due to higher property values. Meanwhile, Plantation has slightly lower property taxes, reflecting the lower cost of real estate.
Sales Tax
In both cities, the Florida state sales tax is 6%, and Miami-Dade County adds a discretionary tax, totaling to 7%. Broward County, where Plantation resides, also imposes an additional 1% tax, totaling to 7%.
Income
Type
Miami
Plantation
Estimated median household income
$48,789
$72,955
Estimated per capita income
$37,223
$43,231
Cost of living index (U.S. average is 100)
110.1
110.9
If you make $50,000 in Miami, you will have to make $50,363 in Plantation to maintain the same standard of living.
Geographical Conditions
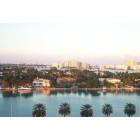
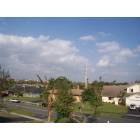
Miami is located on the southeastern tip of Florida, offering stunning coastal views and beaches. Plantation enjoys lush greenery being inland and is popular for its parks and open spaces.
Both cities have a similar educational structure, with public and private schools accessible. However, Miami offers a broader array of choices for higher education, with universities like the University of Miami and Florida International University.
Miami's economy is robust with thriving sectors like tourism, international trade, entertainment, and financial services. Conversely, Plantation has a more localized economy, driven by sectors like healthcare, retail, and local businesses.
Biggest Employers
Miami's major employers include the University of Miami, American Airlines, and Carnival Corporation. In contrast, Plantation's largest employers are DHL Express, Motorola Solutions, and Westside Regional Medical Center.
There were 102 building permits issued in Miami in 2012 (81 more than in 2011) compared to 14 building permits issued in Plantation in 2012 (2 more than in 2011).
In Miami (Miami-Dade County), 61.8% voted for Democrats and 38.0% for Republicans in 2012 Presidential Election. In Plantation (Broward County), 67.3% voted for Democrats and 32.3% for Republicans.
Elections
Type
Democrats
Republicans
Other
Year
Miami
Plantation
Miami
Plantation
Miami
Plantation
2020
53.5%
64.8%
46.2%
34.9%
0.3%
0.3%
2016
63.4%
66.2%
33.9%
31.2%
2.7%
2.6%
2012
61.8%
67.3%
38.0%
32.3%
0.3%
0.3%
2008
58.1%
67.5%
41.9%
32.5%
0.0%
0.0%
2004
53.0%
64.6%
46.7%
34.8%
0.3%
0.5%
2000
52.7%
67.7%
46.4%
31.1%
0.9%
1.2%
1996
57.3%
63.5%
37.9%
28.3%
4.8%
8.2%
Breakdown of population affiliated with a religious congregation
Type
Adherents
Congregations
Religion
Miami
Plantation
Miami
Plantation
CATHOLIC CHURCH
21.8%
16.0%
4.5%
4.4%
SOUTHERN BAPTIST CONVENTION
3.2%
4.2%
21.8%
17.4%
SEVENTH DAY ADVENTIST CHURCH
1.1%
0.9%
4.3%
4.6%
MUSLIM ESTIMATE
0.9%
1.0%
1.0%
1.3%
EPISCOPAL CHURCH
0.5%
0.4%
2.1%
1.6%
AMERICAN BAPTIST CHURCHES IN THE USA
0.0%
0.7%
0.2%
0.2%
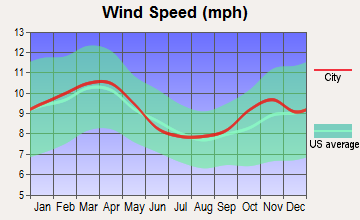
Weather
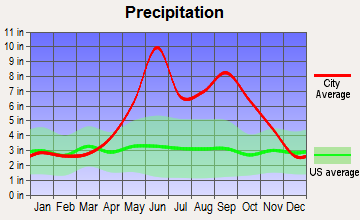
Both Miami and Plantation offer year-round warm climates, typical of South Florida. Miami experiences a slightly higher average temperature due to its proximity to the ocean, while Plantation, although slightly cooler, still offers a tropically warm climate.
Weather and climate
Type
Miami
Plantation
Temperature - Average
77.3°F
76°F
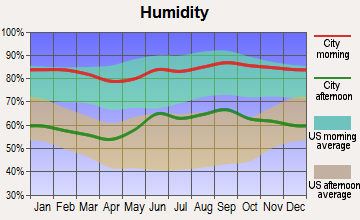
Humidity - Average morning or afternoon humidity
77.3%
77.3%
Humidity - Differences between morning and afternoon humidity
31%
31.1%
Humidity - Maximum monthly morning or afternoon humidity
86%
86%
Humidity - Minimum monthly morning or afternoon humidity
55%
55%
Precipitation - Yearly average
60 in
64.1 in
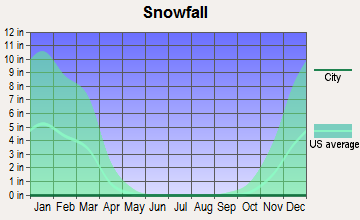
Snowfall - Yearly average
0 in
0 in
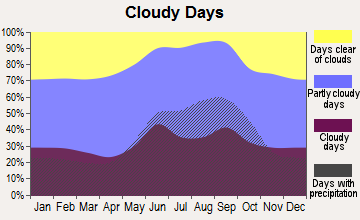
Clouds - Number of days clear of clouds
12.3%
12.4%
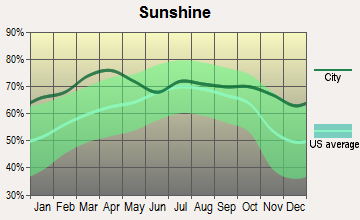
Sunshine amount - Average
76.8%
76.8%
Sunshine amount - Differences during a year
16%
16%
Sunshine amount - Maximum monthly
79%
79%
Sunshine amount - Minimum monthly
63%
63%
Wind speed - Average
9.1 mph
9.2 mph
Average climate in Miami, Florida
Average climate in Plantation, Florida
Air pollution
Type
AQI
CO
NO2
OZONE
PM10
PM25
SO2
Year
Miami
Plantation
Miami
Plantation
Miami
Plantation
Miami
Plantation
Miami
Plantation
Miami
Plantation
Miami
Plantation
2018
72
69
0.24
0.33
2.7
11.6
31.8
25.2
15.5
15.6
8.6
7.6
0.3
0.1
2017
80
78
0.27
0.35
3.0
12.2
30.9
24.9
N/A
N/A
8.5
8.8
0.4
0.1
2016
68
65
0.30
0.32
2.9
12.4
32.6
27.2
N/A
N/A
7.2
7.4
0.0
0.0
2015
62
61
0.23
0.27
2.4
5.9
29.0
23.2
N/A
N/A
8.2
8.2
0.0
0.0
2014
71
73
0.21
N/A
3.8
6.6
30.7
23.4
N/A
N/A
8.0
8.0
0.0
0.0
2013
64
62
0.22
N/A
3.1
4.4
30.8
22.6
N/A
N/A
7.9
7.9
0.0
0.0
2012
71
68
0.19
N/A
2.9
5.0
32.1
23.7
N/A
N/A
8.7
8.7
0.0
0.0
2011
72
65
0.16
N/A
3.0
5.5
32.3
23.1
N/A
N/A
8.7
8.7
0.0
0.0
2010
77
69
0.31
N/A
4.2
6.5
32.3
25.0
N/A
N/A
9.1
9.0
0.0
0.0
2009
67
64
0.53
0.47
3.3
6.1
31.9
22.7
N/A
N/A
9.1
9.3
0.0
0.0
2008
95
87
0.55
0.43
3.8
5.2
31.0
23.7
18.0
19.0
10.5
10.5
0.0
0.0
2007
94
89
0.59
0.42
5.0
6.1
33.5
24.4
21.9
20.2
10.5
10.5
0.0
0.0
2006
87
77
0.48
0.57
5.8
7.8
34.6
23.9
22.3
21.7
10.2
10.2
0.0
0.0
2005
75
67
0.55
0.65
6.0
7.5
31.8
21.8
18.8
18.4
8.7
8.7
0.0
0.0
2004
69
64
1.02
0.58
5.9
7.8
31.3
21.5
19.5
18.7
8.5
8.5
0.3
0.3
2003
70
64
0.99
0.60
6.5
8.8
29.5
19.8
N/A
N/A
8.4
8.4
0.4
0.4
2002
75
72
0.71
0.50
6.3
7.9
30.2
20.4
N/A
N/A
8.4
8.4
2.1
2.1
2001
84
83
0.80
0.60
5.9
9.3
30.2
21.6
N/A
N/A
9.1
9.1
1.5
1.5
2000
66
63
0.89
0.56
6.7
9.2
31.1
22.4
N/A
N/A
N/A
N/A
1.3
1.3
Natural disasters
Type
Miami
Plantation
Tornado activity compared to U.S. average
63%
74.9%
Earthquake activity compared to U.S. average
1.1%
1.1%
Natural disasters compared to U.S. average
10%
27%
Transportation
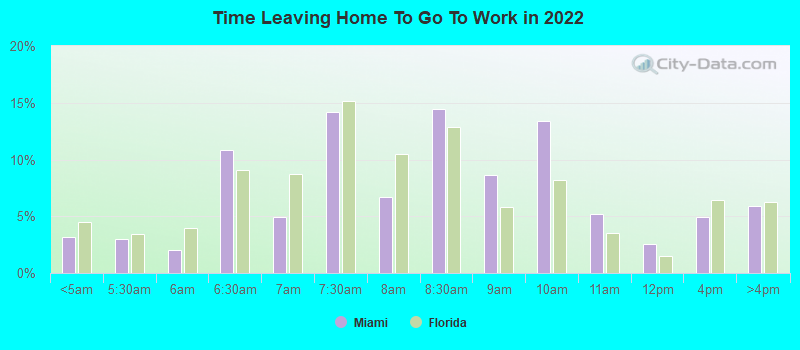
Miami provides extensive public transportation options with Metrorail, Metromover, and buses. Plantation heavily relies on private transportation, with some bus services. Miami's commuting times can be longer due to traffic congestion.
Transport
Type
Miami
Plantation
Amtrak stations
2
0
Amtrak stations nearby
3
3
FAA registered aircraft
1
107
FAA registered aircraft manufacturers and dealers
159
15
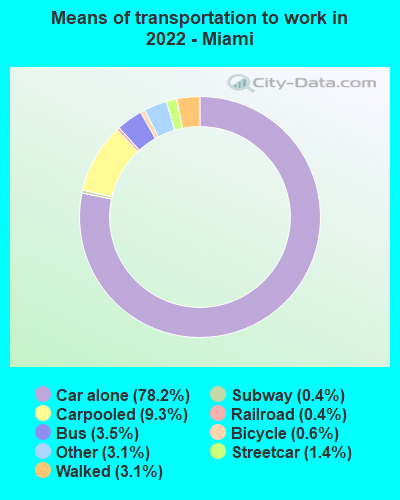
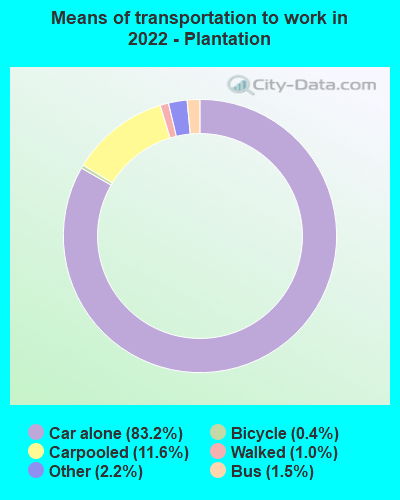
Means of transportation to work
Type
Miami
Plantation
Bicycle
0.8%
0.5%
Bus
3.8%
1.6%
Carpooled
8.5%
10.7%
Car alone
81.1%
84.6%
Motorcycle
0.1%
0.1%
Railroad
0.2%
0.2%
Streetcar
0.5%
0%
Subway
0.3%
0%
Taxicab
0.2%
0.2%
Walked
2.6%
0.6%
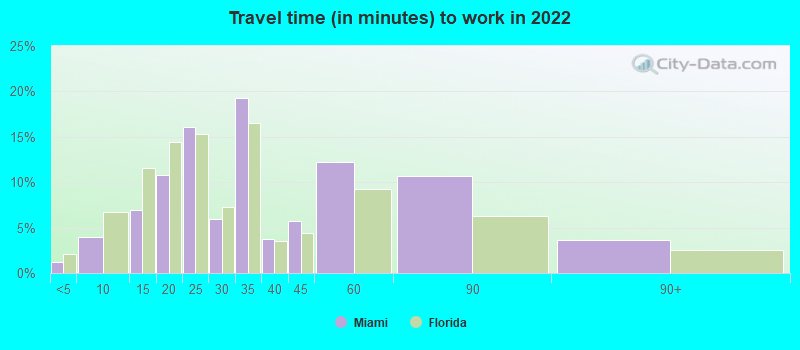
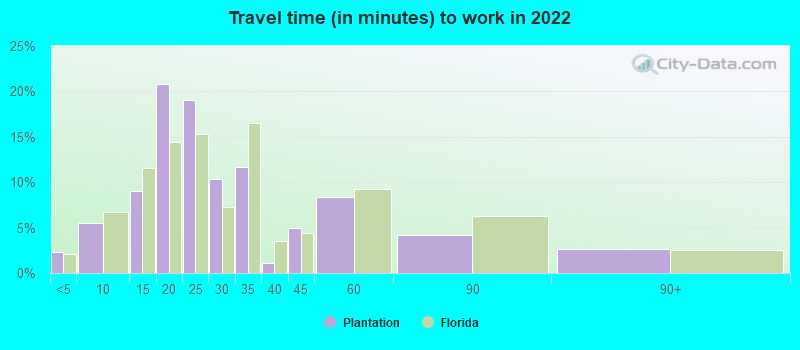
Average travel time to work
Type
Miami
Plantation
Average
33.7 min
27.6 min
Other means
26.1 min
27.5 min
Public transportation
48.5 min
38.9 min
Private vehicle occupancy
Type
Miami
Plantation
Average
1.1
1.2
Drove alone
89%
88.8%
In 2 person carpool
9.2%
8.6%
In 3 person carpool
0.9%
1.8%
In 4 person carpool
0.4%
0.4%
In 5-6 person carpool
0.3%
0.1%
In 7+ person carpool
0.2%
0.2%
How many people usually rode to work in the car, truck or van.
Real Estate
Miami's real estate market is diverse with luxury condos, beachfront properties, and some upscale residential areas. Plantation real estate is more affordable and centered around single-family houses and townhomes perfect for families.
Neighborhoods
Miami neighborhoods reflect its cultural diversity, with areas like Little Havana and Miami Beach offering unique vibes. Plantation is quieter and more residential, with serene neighborhoods like Plantation Acres and El Dorado Estates.
Houses and residents
Type
Miami
Plantation
Houses
219,775
38,622
Average household size (people)
2.5
2.5
Median year apartment built
1981
1992
Median year house/condo built
1968
1979
Length of stay in the house since moving in
13.8 years
12.2 years
Houses occupied
192,219 (87.5%)
36,564 (94.7%)
Houses occupied by owners
58,463 (30.4%)
24,029 (65.7%)
Houses occupied by renters
133,756 (69.6%)
12,535 (34.3%)
Median rent asked for vacant for-rent units
$2,006
$1,441
Median monthly housing costs
$1,456
$1,618
Median price asked for vacant for-sale houses and condos
$1,201,540
$315,152
Estimated median house or condo value
$411,300
$409,400
Median numbers of rooms
3.8
5.1
Median number of rooms in apartments
3.4
4
Median number of rooms in houses and condos
5
6.1
Median house price - detached houses
$499,839
$561,579
Median house price - in 2-unit structures
$427,603
$159,453
Median house price - in 3-to-4-unit structures
$107,725
$197,384
Median house price - in 5 or more unit structures
$570,126
$180,080
Median house price - mobile homes
$238,353
$57,686
Median house price - Townhouses or other attached units
$768,446
$281,602
Median house price - All housing units
$550,392
$454,870
Median house age
43
40
Renting percentage
67.7%
30.9%
Housing density (houses/condos per square mile)
6,160.8
1,776.7
House value disparities
31.5%
30.3%
Household income disparities
51.3%
45.2%
Median household income for houses/condes with a mortgage
$92,897
$98,867
Median household income for apartments without a mortgage
$52,201
$71,250
Housing units without a mortgage
686 (2.1%)
341 (2.3%)
Housing units with both a second mortgage and home equity loan
1,692 (5.1%)
917 (6.1%)
Housing units with a mortgage
32,656 (97.9%)
14,748 (97.7%)
Housing units with a home equity loan
36 (0.1%)
77 (0.5%)
Housing units with a second mortgage
2,892 (8.7%)
1,216 (8.1%)
House/condo owner moved in on average (years ago)
10
10
House/condo renter moved in on average (years ago)
2
1
Housing units lacking complete kitchen facilities
1.6%
1.2%
Housing units in structures
Housing units in structures
Miami
Plantation
One, detached
22.6%
47.1%
One, attached
9.7%
10.3%
Two
3.3%
0.5%
3 or 4
4.0%
5.9%
5 to 9
5.8%
4.8%
10 to 19
6.9%
8.0%
20 to 49
8.3%
7.7%
50 or more
39.2%
14.9%
Mobile homes
0.2%
0.8%
Median real estate property taxes paid for housing units
Self-employed workers in own not incorporated business
26,340
2,891
State government workers
3,509
589
Unpaid family workers
695
159
Industries and Occupations
In Miami, the tourism industry reigns, creating jobs in hospitality, food services, tourism, and retail. Plantation's economy leans more towards healthcare, local services, and retail, offering a more traditional set of occupations.
Miami offers top-notch medical facilities, including the University of Miami Health System. Plantation also offers quality health care with facilities like Westside Regional Medical Center.
Health (county statistics)
Type
Miami
Plantation
General health status score of residents in this county from 1 (poor) to 5 (excellent)
Miami enjoys world-class infrastructure with high-rises, state-of-the-art amenities, and cutting-edge technology. Plantation offers well-planned suburban infrastructure, with a focus on parks and recreational facilities.
Infrastructure
Type
Miami
Plantation
Hospitals
47
3
TV stations
26
28
Bank branches located here
346
27
Bank institutions located here
53
15
Main business address for public companies
29
5
Drinking water stations with no reported violations in the past
9
1
Drinking water stations with reported violations in the past
HMDA - Conventional home purchase loans - Applications denied
Year
Miami
Plantation
1999
0
344
2000
1,368
194
2001
1,354
186
2002
1,274
176
2003
1,618
392
2004
2,862
531
2005
4,991
1,084
2006
7,400
985
2007
5,318
618
2008
3,212
301
2009
888
131
Culture and Food
Miami is known for its vibrant nightlife, music, and a mix of Caribbean and Latin American cuisine. Plantation offers a more suburban culture with local eateries and American cuisine.
Sports Teams
Miami is known for its popular sports teams like the Miami Heat for basketball, Miami Dolphins for American football, and Miami Marlins for baseball. Plantation residents usually support these teams as major leagues are absent in the town.


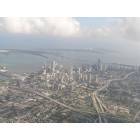
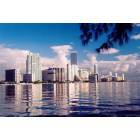
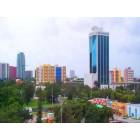

 Miami, FL
 Plantation, FL