North Coast, CA and Carson, CA are both unique locations to live in or visit. While North Coast is a picturesque region offering a peaceful coastal lifestyle, Carson is a vibrant city known for its rich culture and diverse industrial sector. Each location offers different opportunities for safety, weather conditions, cost of living, and other factors that can influence decision-making for either relocation or tourism. Each region has its unique features and considerations for potential residents or visitors.
North Coast, CA encompasses a large region with small towns with relatively low crime rates compared to national averages. The area is generally safe, providing a peaceful and secure environment for both residents and tourists.
On the other hand, Carson, CA, a suburb of Los Angeles, has a higher crime rate than North Coast, but measures are in place to ensure safety. The local government has invested in robust policing services and community involvement in crime prevention is high.
Cost of Living
The cost of living in the North Coast is generally high due to the area's desirable coastal location. This can be seen across housing, groceries, and transportation.
Carson, despite being part of the Los Angeles metropolitan area, has a lower cost of living compared to the North Coast, making it more affordable for residents and visitors alike.
Income Tax
Income taxation in both regions is governed by California's state rules. The state has a progressive income tax system with rates ranging from 1% up to 13.3%.
Property Tax
Property tax rates in California are relatively low compared to other states. Both North Coast and Carson usually stay around the standard state average of 0.73%.
Sales Tax
Both North Coast and Carson are subject to California's base state sales tax rate of 7.25%. Local jurisdictions can add their own taxes, making the final rate vary slightly.
Income
Type
North Coast
Carson
Estimated median household income
$102,807
$92,609
Estimated per capita income
$50,809
$30,197
Cost of living index (U.S. average is 100)
96.1
134.8
If you make $50,000 in North Coast, you will have to make $70,135 in Carson to maintain the same standard of living.
Geographical Conditions
North Coast's geography offers breathtaking coastlines, rolling hills, ancient redwood forests, and vineyards.
Carson, while more urban, is still close to the coastline and has access to several nearby natural features, including parks, beaches, and hiking trails.
Geographical information
Type
North Coast
Carson
Land area
59.4 sq. miles
18.8 sq. miles
Population density
6,335.5 people per sq. mile
4,964.1 people per sq. mile
Relative area comparison
North Coast, CA Carson, CA
Education
The North Coast region boasts several good school districts, while also offering a number of higher education opportunities, including the prestigious Humboldt State University.
Carson is also well-equipped education-wise, home to California State University, Dominguez Hills, and several well-performing public and private schools.
The North Coast's economy is predominantly driven by sectors such as tourism, agriculture, and fishing.
Carson, on the other hand, has a diversified economy, with industries spanning from manufacturing to retail trade, and a robust employment market.
Biggest Employers
In the North Coast, some of the largest employers are the healthcare providers, school districts and universities, and government organizations.
For Carson, large employers include multinational corporations like IKEA and Xerox, along with local government and educational institutions.
In North Coast (Orange County), 45.8% voted for Democrats and 52.0% for Republicans in 2012 Presidential Election. In Carson (Los Angeles County), 69.7% voted for Democrats and 27.8% for Republicans.
Elections
Type
Democrats
Republicans
Other
Year
North Coast
Carson
North Coast
Carson
North Coast
Carson
2020
53.6%
71.0%
44.6%
26.9%
1.8%
2.1%
2016
50.9%
72.0%
42.4%
22.5%
6.7%
5.5%
2012
45.8%
69.7%
52.0%
27.8%
2.3%
2.4%
2008
47.8%
69.2%
50.3%
28.8%
1.9%
1.9%
2004
39.3%
63.3%
60.2%
35.7%
0.5%
1.0%
2000
40.4%
63.6%
55.9%
32.4%
3.7%
4.0%
1996
37.9%
59.3%
51.7%
31.0%
10.5%
9.7%
Breakdown of population affiliated with a religious congregation
Type
Adherents
Congregations
Religion
North Coast
Carson
North Coast
Carson
CATHOLIC CHURCH
26.5%
36.1%
4.4%
4.7%
SOUTHERN BAPTIST CONVENTION
2.3%
1.0%
8.8%
9.0%
MUSLIM ESTIMATE
0.8%
0.7%
1.3%
1.0%
LUTHERAN CHURCH
0.6%
0.2%
2.0%
1.6%
EPISCOPAL CHURCH
0.4%
0.4%
1.4%
1.4%
EVANGELICAL LUTHERAN CHURCH IN AMERICA
0.4%
0.2%
2.3%
1.9%
SEVENTH DAY ADVENTIST CHURCH
0.4%
0.5%
1.3%
2.4%
REFORMED CHURCH IN AMERICA
0.3%
0.1%
0.2%
0.2%
AMERICAN BAPTIST CHURCHES IN THE USA
0.2%
0.5%
1.7%
3.1%
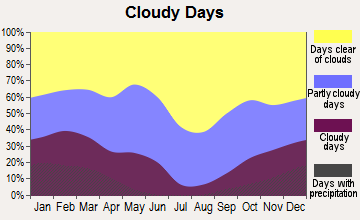
Weather
The North Coast offers a Mediterranean, temperate climate, characterized by mild, wet winters, and dry summers. The proximity to the ocean ensures pleasant weather most of the year, perfect for outdoor activities.
In contrast, Carson experiences a warmer, more humid climate due to its more southern location in California. The city has plenty of sunny days, although summers can get relatively hot.
Weather and climate
Type
North Coast
Carson
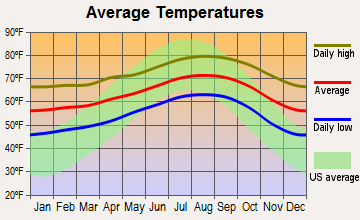
Temperature - Average
64.4°F
63.5°F
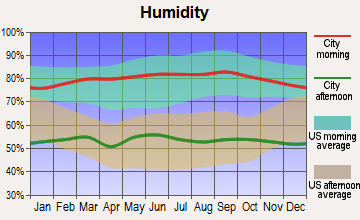
Humidity - Average morning or afternoon humidity
70.2%
70.1%
Humidity - Differences between morning and afternoon humidity
26.7%
26.6%
Humidity - Maximum monthly morning or afternoon humidity
78.7%
78.6%
Humidity - Minimum monthly morning or afternoon humidity
52%
52%
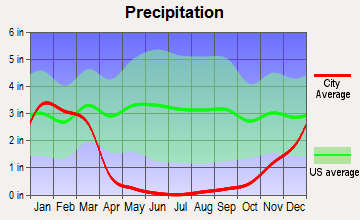
Precipitation - Yearly average
13 in
14 in
Snowfall - Yearly average
0 in
0 in
Clouds - Number of days clear of clouds
26.5%
26.4%
Sunshine amount - Average
78.4%
78.4%
Sunshine amount - Differences during a year
21.9%
22%
Sunshine amount - Maximum monthly
84.9%
85%
Sunshine amount - Minimum monthly
62.9%
63%
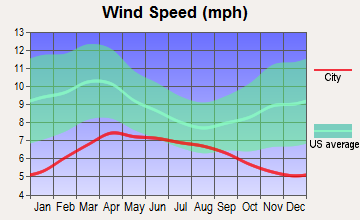
Wind speed - Average
6 mph
5.9 mph
Average climate in North Coast, California
Average climate in Carson, California
Air pollution
Type
AQI
CO
NO2
OZONE
PB
PM10
PM25
SO2
Year
North Coast
Carson
North Coast
Carson
North Coast
Carson
North Coast
Carson
North Coast
Carson
North Coast
Carson
North Coast
Carson
North Coast
Carson
2018
119
124
0.35
0.40
14.4
16.1
26.1
23.5
N/A
0.008
27.5
27.5
12.6
13.7
0.7
0.7
2017
116
122
0.34
0.41
13.8
17.0
28.8
24.4
N/A
0.007
26.7
26.7
13.8
14.6
0.5
0.8
2016
102
115
0.33
0.43
12.2
16.9
29.3
23.6
N/A
0.007
24.1
24.1
12.5
12.2
0.2
0.9
2015
106
111
0.32
0.42
13.2
18.2
29.8
24.3
N/A
0.005
25.0
25.0
14.5
14.4
0.2
0.8
2014
110
128
0.29
0.48
12.9
18.1
28.6
23.8
N/A
0.007
26.7
26.5
15.5
15.1
0.4
1.1
2013
107
128
0.34
0.50
13.9
18.9
27.8
24.8
0.003
0.005
29.5
31.3
14.2
14.8
0.3
0.9
2012
103
132
0.30
0.48
12.7
18.2
26.8
24.6
0.004
0.005
28.2
30.4
14.3
14.6
0.1
0.6
2011
109
124
0.31
0.43
14.7
19.5
27.0
23.4
0.006
0.006
27.7
28.5
15.9
15.8
0.7
1.1
2010
102
117
0.33
0.45
14.3
19.8
26.2
22.2
0.011
0.012
23.6
24.7
14.0
12.5
0.6
0.7
2009
118
136
0.35
0.52
15.5
20.7
27.6
22.9
0.009
0.010
24.3
31.3
14.5
13.8
1.1
1.1
2008
124
129
0.39
0.52
16.5
22.5
28.2
22.3
0.010
0.011
29.5
28.5
21.6
21.4
1.1
1.1
2007
100
111
0.36
0.55
16.3
21.9
27.0
21.7
0.012
0.012
N/A
N/A
N/A
N/A
0.8
1.8
2006
114
120
0.40
0.66
17.2
23.0
26.4
22.1
0.007
0.007
N/A
N/A
N/A
N/A
1.3
1.7
2005
95
111
0.39
0.66
17.7
24.6
27.9
21.5
0.012
0.013
N/A
N/A
N/A
N/A
1.3
3.4
2004
119
128
0.50
0.58
19.2
27.1
30.5
23.8
0.014
0.014
N/A
N/A
N/A
N/A
1.6
2.3
2003
122
131
0.64
0.82
21.9
28.1
28.9
21.4
0.030
0.026
N/A
N/A
N/A
N/A
1.1
0.9
2002
106
123
0.65
0.83
22.0
29.0
25.5
21.9
0.018
0.017
N/A
N/A
N/A
N/A
1.8
2.7
2001
116
126
0.73
0.78
22.0
30.1
25.4
20.5
0.033
0.030
N/A
N/A
N/A
N/A
1.5
3.6
2000
125
142
0.80
0.79
24.4
32.2
24.0
18.5
0.027
0.027
N/A
N/A
N/A
N/A
1.9
2.1
Natural disasters
Type
North Coast
Carson
Tornado activity compared to U.S. average
18.6%
17.7%
Earthquake activity compared to U.S. average
6,843.6%
6,865.2%
Natural disasters compared to U.S. average
32%
57%
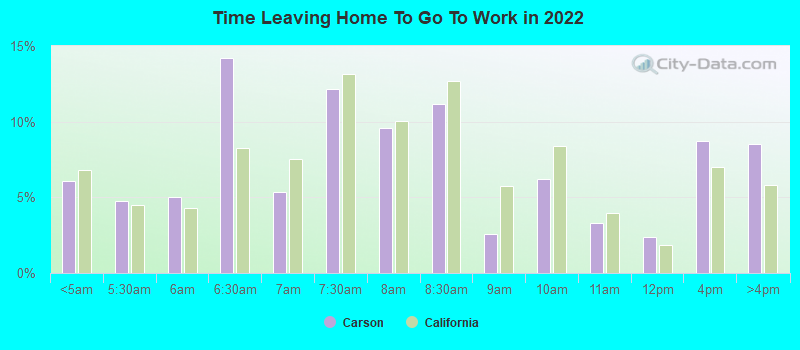
Transportation
In North Coast, commuting is often by private vehicles due to the area's rural nature, but there are also local bus services.
Carson is well-connected with multiple highways and public transit options, including buses and light rail systems, making commuting easier.
Transport
Type
North Coast
Carson
Amtrak stations nearby
3
3
FAA registered aircraft
0
11
FAA registered aircraft manufacturers and dealers
0
1
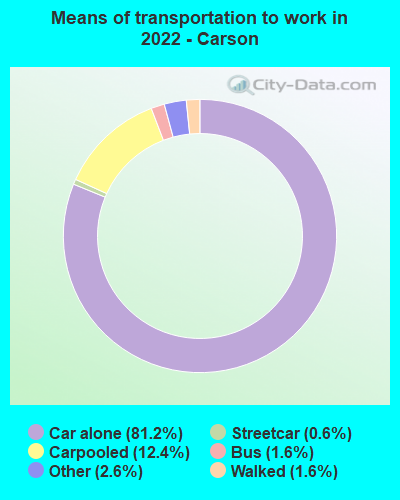
Means of transportation to work
Type
North Coast
Carson
Bicycle
0.7%
0.5%
Bus
1.2%
2.4%
Carpooled
10.7%
11.2%
Car alone
81.4%
83.5%
Motorcycle
0.2%
0.1%
Railroad
0%
0.2%
Subway
0%
0.2%
Walked
1.4%
0.6%
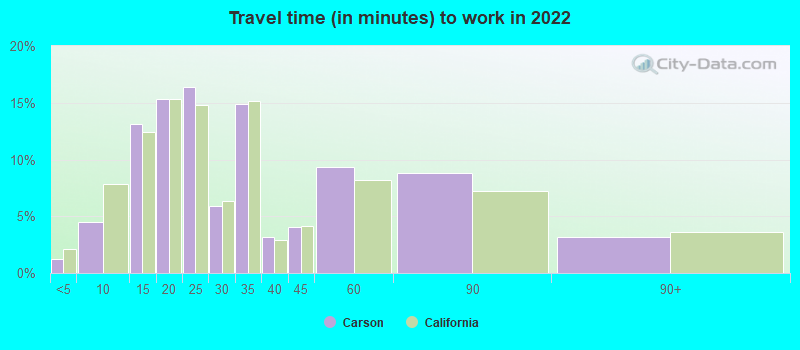
Average travel time to work
Type
North Coast
Carson
Average
28.8 min
31.1 min
Real Estate
Real estate in the North Coast tends to be more expensive due to the desirable coastal location. The area offers a mix of charming homes and modern apartments.
In Carson, real estate is more affordable. The city offers a variety of housing options from single-family homes to apartment complexes.
Neighborhoods
The North Coast features quaint, scenic towns each with their own unique charm and community spirit, offering an idyllic and peaceful lifestyle.
Carson is made up of diverse, dynamic neighborhoods close to many amenities, providing a more urban lifestyle.
Houses and residents
Type
North Coast
Carson
Houses
137,450
26,409
Average household size (people)
2.7
3.6
Houses occupied
133,254 (96.9%)
25,743 (97.5%)
Houses occupied by owners
84,546 (63.4%)
18,898 (73.4%)
Houses occupied by renters
48,708 (36.6%)
6,845 (26.6%)
Median rent asked for vacant for-rent units
$2,340
$1,425
Median price asked for vacant for-sale houses and condos
$1,099,558
$302,846
Estimated median house or condo value
$883,291
$595,900
Median number of rooms in apartments
3.9
4.3
Median number of rooms in houses and condos
6.1
5.8
Renting percentage
37.7%
23.2%
Housing density (houses/condos per square mile)
2,312.7
1,401.6
Household income disparities
41.2%
40.2%
Housing units without a mortgage
13,396 (19.5%)
81 (0.6%)
Housing units with both a second mortgage and home equity loan
282 (0.4%)
894 (7.1%)
Housing units with a mortgage
55,188 (80.5%)
12,586 (99.4%)
Housing units with a home equity loan
6,297 (9.2%)
66 (0.5%)
Housing units with a second mortgage
7,643 (11.1%)
1,580 (12.5%)
Housing units lacking complete kitchen facilities
1%
1.5%
Housing units lacking complete plumbing facilities
Self-employed workers in own not incorporated business
15,532
1,881
State government workers
5,751
1,096
Unpaid family workers
744
0
Industries and Occupations
Primary industries in the North Coast include tourism, agriculture, winemaking, and fishing. Jobs are often related to these industries, with additional opportunities in healthcare and education.
Carson has a diversified industrial sector including manufacturing, retail trade, and logistics. The city's substantial workforce is employed across these diverse industries.
North Coast's rural setting might limit its infrastructural offerings, but the region is well connected with highways and has efficient public services.
Carson, being part of a major metropolitan area, boasts well-developed infrastructure, including multiple highways, public transit systems, and excellent public services.
Infrastructure
Type
North Coast
Carson
TV stations
2
5
Culture and Food
North Coast offers a unique mix of coastal and rural culture combined with a vibrant food scene, including fresh local produce and seafood.
Carson showcases a diverse culture due to its mixed heritage, and the food scene reflects this diversity, offering everything from Southern cuisine to Asian fusion.
Sports Teams
Pro or college sports teams are not prevalent in North Coast; however, outdoor activities and watersports are popular.
Carson, on the other hand, is home to professional soccer teams LA Galaxy and the Los Angeles Chargers, providing lots of opportunities for sports enthusiasts.
 North Coast, CA
 Carson, CA