Oklahoma City, the capital of Oklahoma and McKinney in Texas, are both dynamic cities with unique features that make them appealing for relocators and tourists. While both offer a rich cultural history, diverse industries, and several recreational options, they display variations in weather, crime rate, cost of living, and infrastructure. The differing tax structures and public transit systems must also be considered. This comparison will delve into these distinctions and similarities to give a comprehensive analysis of both cities with respect to various aspects.
Distance between
Oklahoma City, OK and
McKinney, TX : 165.9 miles
Oklahoma City's population is larger by 239%. Its population has grown by 181,593 people (35.9%) since 2000. The population of McKinney has grown by 148,321 people (272.8%) during that time.
When considering crime and safety, Oklahoma City has a higher crime rate compared to McKinney, which is one of the safest cities in Texas. According to FBI reports, McKinney experiences less violent and property crimes. It has invested heavily in law enforcement and community programs to improve safety. Oklahoma City, while having higher crime rates, is taking measures to improve safety and has seen a reduction in crime rates in recent years.
City-data.com crime index counts serious crimes and violent crime more heavily. It adjusts for the number of visitors and daily workers commuting into cities. (higher means more crime, U.S. average = 301.1)
City-data.com crime index counts serious crimes and violent crime more heavily. It adjusts for the number of visitors and daily workers commuting into cities. (higher means more crime, U.S. average = 301.1)
Sex Offenders
According to our data, there are 1,386 registered sex offenders living in Oklahoma City and 86 registered sex offenders living in . The ratio of residents to sex offenders in Oklahoma City is 461 to 1; the ratio in McKinney is 1,932 to 1. The number of registered sex offenders compared to the number of residents is much larger in Oklahoma City than that in McKinney.
Cost of Living
Oklahoma City wins if the cost of living is the question, having a lower cost of living index than McKinney. This includes housing, utilities, groceries, and transportation. Although the margin isn't huge, these variations could significantly affect a family's budget or an individual's living expenses. However, McKinney's higher cost is balanced by its higher median household income.
Property Tax
Property taxes vary, with McKinney residents facing a higher property tax rate. The high level of services and cultural amenities in the city reflect the tax expenditure. Oklahoma City residents enjoy a lower property tax, which increases its affordability.
Sales Tax
Texas has no state income tax, allowing for more disposable income for residents of McKinney. In contrast, Oklahoma residents pay a state income tax. However, Oklahoma City has a lower combined sales tax rate compared to McKinney, which could balance out the overall taxation burden.
Income
Type
Oklahoma City
McKinney
Estimated median household income
$59,214
$98,317
Estimated per capita income
$31,630
$47,493
Cost of living index (U.S. average is 100)
85.4
95.6
If you make $50,000 in Oklahoma City, you will have to make $55,972 in McKinney to maintain the same standard of living.
Geographical Conditions
Oklahoma City's geographical conditions are shaped by its location on the Great Plains, granting a mix of urban areas and natural landscapes. McKinney offers a blend of suburban and rural landscapes, often characterized by its rolling hills, parks, and nearby lakes.
McKinney has a reputation for its excellent education system, with its independent school district consistently ranking high in Texas. Oklahoma City, while showing improvements in its education systems, does not match up with McKinney's higher test scores and graduation rates. However, Oklahoma City is home to a few prestigious universities, providing quality higher education.
Both cities have diverse economies and ample job opportunities. Oklahoma City's primary sectors include public administration, healthcare, and retail. McKinney boasts a strong economy with a focus on industries like technology, defense, and healthcare. The job growth in both cities has been positive, with a slight edge for McKinney.
Biggest Employers
In Oklahoma City, the biggest employers are the State of Oklahoma, Oklahoma City Public Schools, and the Federal Aviation Administration. In McKinney, large employers include the McKinney Independent School District, Raytheon, and the City of McKinney.
There were 4,127 building permits issued in Oklahoma City in 2012 (2834 more than in 2011) compared to 1,727 building permits issued in McKinney in 2012 (555 more than in 2011).
In Oklahoma City (Oklahoma County), 41.7% voted for Democrats and 58.3% for Republicans in 2012 Presidential Election. In McKinney (Collin County), 33.6% voted for Democrats and 65.2% for Republicans.
Elections
Type
Democrats
Republicans
Other
Year
Oklahoma City
McKinney
Oklahoma City
McKinney
Oklahoma City
McKinney
2020
48.1%
47.1%
49.2%
51.4%
2.7%
1.5%
2016
41.2%
39.0%
51.7%
55.7%
7.1%
5.4%
2012
41.7%
33.6%
58.3%
65.2%
0.0%
1.2%
2008
41.6%
36.7%
58.4%
62.3%
0.0%
1.0%
2004
35.8%
28.2%
64.2%
71.3%
0.0%
0.6%
2000
36.6%
24.5%
62.3%
73.2%
1.1%
2.3%
1996
36.5%
28.5%
54.7%
63.0%
8.8%
8.5%
Breakdown of population affiliated with a religious congregation
Type
Adherents
Congregations
Religion
Oklahoma City
McKinney
Oklahoma City
McKinney
SOUTHERN BAPTIST CONVENTION
20.7%
10.1%
20.0%
29.1%
CATHOLIC CHURCH
8.5%
14.2%
3.0%
1.6%
EPISCOPAL CHURCH
0.7%
0.2%
1.3%
1.0%
INTERNA PENTECO HOLINESS CHURCH
0.7%
0.0%
2.9%
0.0%
LUTHERAN CHURCH
0.5%
0.8%
1.0%
1.4%
SEVENTH DAY ADVENTIST CHURCH
0.4%
0.1%
1.5%
0.8%
AMERICAN BAPTIST CHURCHES IN THE USA
0.3%
0.0%
0.1%
0.2%
MUSLIM ESTIMATE
0.3%
2.9%
0.6%
1.9%
EVANGELICAL LUTHERAN CHURCH IN AMERICA
0.2%
0.3%
0.9%
1.0%
Weather
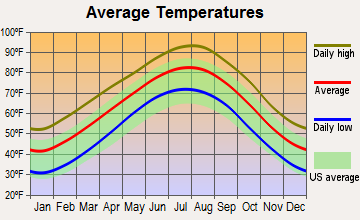
The weather in Oklahoma City and McKinney vary, with Oklahoma City experiencing more extreme weather. It has hot summers and cold winters, with the possibility of tornadoes during spring due to its location in Tornado Alley. McKinney, on the other hand, has a more moderate Texas climate with hot summers and mild winters, making it slightly more favorable for outdoor activities year-round.
Weather and climate
Type
Oklahoma City
McKinney
Temperature - Average
60.1°F
62.8°F
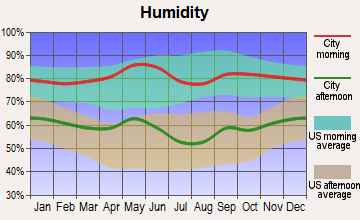
Humidity - Average morning or afternoon humidity
73.1%
71.3%
Humidity - Differences between morning and afternoon humidity
35%
34.1%
Humidity - Maximum monthly morning or afternoon humidity
85%
82%
Humidity - Minimum monthly morning or afternoon humidity
50%
48%
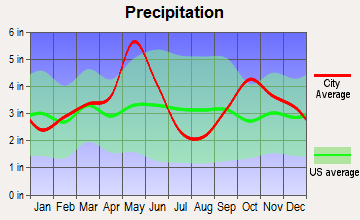
Precipitation - Yearly average
35.7 in
40.9 in
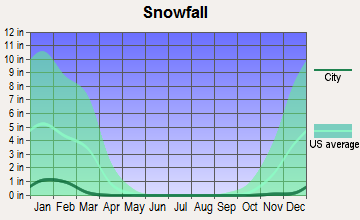
Snowfall - Yearly average
17.2 in
4.2 in
Clouds - Number of days clear of clouds
23.1%
22.8%
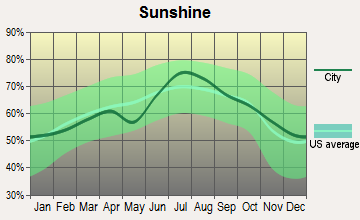
Sunshine amount - Average
72.1%
66.6%
Sunshine amount - Differences during a year
21%
20%
Sunshine amount - Maximum monthly
79%
74%
Sunshine amount - Minimum monthly
58%
54%
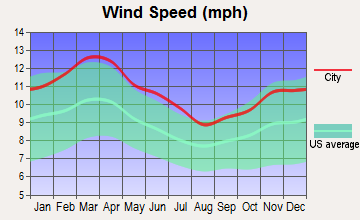
Wind speed - Average
12.3 mph
10.3 mph
Average climate in Oklahoma City, Oklahoma
Average climate in McKinney, Texas
Air pollution
Type
AQI
CO
NO2
OZONE
PB
PM10
PM25
SO2
Year
Oklahoma City
McKinney
Oklahoma City
Oklahoma City
McKinney
Oklahoma City
McKinney
Oklahoma City
McKinney
Oklahoma City
Oklahoma City
Oklahoma City
2018
85
80
0.29
N/A
6.6
5.8
31.9
30.2
0.002
N/A
21.3
N/A
9.6
N/A
0.0
N/A
2017
82
75
0.32
N/A
6.7
5.8
33.0
31.4
0.002
N/A
20.7
N/A
8.9
N/A
0.0
N/A
2016
72
73
0.29
N/A
6.6
6.4
31.9
30.0
0.002
N/A
19.4
N/A
8.5
N/A
0.2
N/A
2015
76
80
0.24
N/A
7.0
7.2
31.5
30.3
0.002
N/A
19.1
N/A
7.8
N/A
0.5
N/A
2014
84
76
0.15
N/A
7.1
6.1
32.4
31.1
0.002
N/A
N/A
N/A
8.7
N/A
0.1
N/A
2013
84
83
0.14
N/A
8.6
7.0
32.8
32.6
0.002
N/A
N/A
N/A
9.3
N/A
0.2
N/A
2012
97
100
0.13
N/A
9.4
8.5
34.0
34.4
0.007
N/A
N/A
N/A
7.9
N/A
0.3
N/A
2011
107
96
0.24
N/A
9.9
9.1
36.3
34.4
0.003
N/A
N/A
N/A
9.9
N/A
0.8
N/A
2010
81
81
0.30
N/A
8.8
9.7
31.7
31.3
0.002
N/A
N/A
N/A
9.8
N/A
0.7
N/A
2009
82
86
0.52
N/A
8.1
9.6
31.9
31.9
0.002
N/A
N/A
N/A
10.2
N/A
0.7
N/A
2008
78
82
0.51
N/A
9.8
9.9
31.0
32.5
N/A
0.121
N/A
N/A
N/A
N/A
1.4
N/A
2007
81
89
0.44
N/A
10.2
10.3
29.4
30.0
N/A
0.070
N/A
N/A
N/A
N/A
2.0
N/A
2006
95
104
0.43
N/A
10.1
10.5
33.7
34.1
N/A
0.106
N/A
N/A
N/A
N/A
1.2
N/A
2005
88
100
0.38
N/A
11.6
13.2
31.0
32.9
N/A
0.142
N/A
N/A
N/A
N/A
1.3
N/A
2004
75
90
0.46
N/A
10.5
11.8
28.6
29.6
N/A
0.099
N/A
N/A
N/A
N/A
0.6
N/A
2003
87
97
0.42
N/A
10.9
13.9
30.8
30.7
N/A
0.121
N/A
N/A
N/A
N/A
N/A
N/A
2002
91
96
0.35
N/A
14.3
14.3
29.0
29.7
N/A
0.080
N/A
N/A
N/A
N/A
2.0
N/A
2001
87
99
0.69
N/A
13.1
12.8
31.0
31.0
N/A
0.069
N/A
N/A
N/A
N/A
1.8
N/A
2000
89
107
0.66
N/A
13.4
14.5
29.5
32.1
N/A
0.092
N/A
N/A
N/A
N/A
3.0
N/A
Natural disasters
Type
Oklahoma City
McKinney
Tornado activity compared to U.S. average
353.4%
250.4%
Earthquake activity compared to U.S. average
938.9%
613.3%
Natural disasters compared to U.S. average
43%
14%
Transportation
Oklahoma City's public transit primarily relies upon its bus system, the EMBARK, which services the entire city. McKinney, while having less extensive public transportation, offers unique solutions like the TAPS Public Transit system, a demand-responsive transit service. Commuting times can depend greatly on residential location and proximity to central areas.
Transport
Type
Oklahoma City
McKinney
Amtrak stations
1
0
Amtrak stations nearby
2
0
FAA registered aircraft
0
272
FAA registered aircraft manufacturers and dealers
0
7
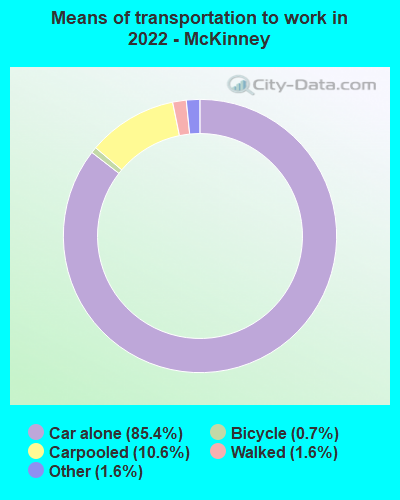
Means of transportation to work
Type
Oklahoma City
McKinney
Bicycle
0.2%
0.6%
Bus
0.3%
0%
Carpooled
8.6%
10.4%
Car alone
87.6%
85.6%
Taxicab
0.2%
0.1%
Walked
1.4%
1.3%
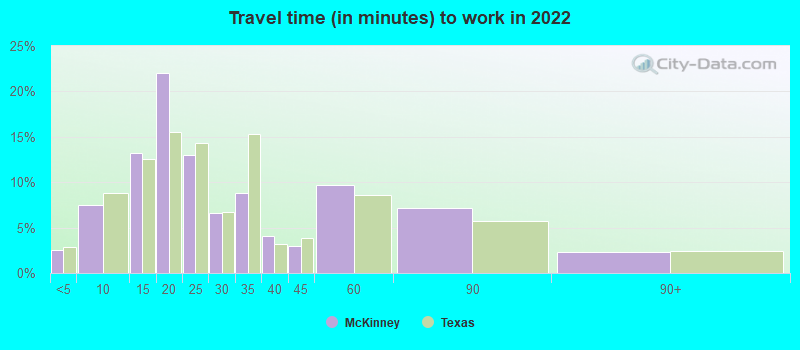
Average travel time to work
Type
Oklahoma City
McKinney
Average
25.6 min
28.7 min
Other means
21 min
29.7 min
Public transportation
33.1 min
55.7 min
Private vehicle occupancy
Type
Oklahoma City
McKinney
Average
1.2
1.1
Drove alone
89.5%
90.8%
In 2 person carpool
7.1%
7.4%
In 3 person carpool
1.9%
0.9%
In 4 person carpool
0.7%
0.4%
In 5-6 person carpool
0.5%
0.1%
In 7+ person carpool
0.2%
0%
How many people usually rode to work in the car, truck or van.
Real Estate
As for real estate, McKinney has a more expensive market compared to Oklahoma City due to its high demand and growth rate. However, this means properties in McKinney generally appreciate in value faster. Oklahoma City's real estate market is more affordable, making it attractive for first-time homebuyers.
Neighborhoods
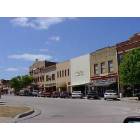
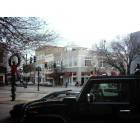
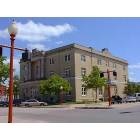
Oklahoma City has diverse neighborhoods with a mix of urban and suburban settings, each offering unique amenities. McKinney is known for its friendly, small-town feel neighborhoods, many with a strong community spirit. Different communities cater to different lifestyles, from more active downtown living to peaceful suburban settings.
Houses and residents
Type
Oklahoma City
McKinney
Houses
302,241
76,364
Average household size (people)
2.5
2.9
Median year apartment built
1978
2010
Median year house/condo built
1986
2007
Length of stay in the house since moving in
11.8 years
8 years
Houses occupied
275,285 (91.1%)
73,357 (96.1%)
Houses occupied by owners
164,470 (59.7%)
47,064 (64.2%)
Houses occupied by renters
110,815 (40.3%)
26,293 (35.8%)
Median rent asked for vacant for-rent units
$1,241
$1,543
Median monthly housing costs
$983
$1,847
Median price asked for vacant for-sale houses and condos
$278,299
$278,214
Estimated median house or condo value
$190,900
$391,200
Median numbers of rooms
5.5
6.6
Median number of rooms in apartments
4.3
3.6
Median number of rooms in houses and condos
6.2
7.7
Median house price - detached houses
$254,772
$377,561
Median house price - in 2-unit structures
$318,820
$369,508
Median house price - in 3-to-4-unit structures
$128,784
$232,195
Median house price - in 5 or more unit structures
$170,231
$235,678
Median house price - mobile homes
$112,256
$82,301
Median house price - Townhouses or other attached units
$245,885
$368,394
Median house price - All housing units
$249,488
$377,050
Median house age
40
13
Renting percentage
40.3%
29%
Housing density (houses/condos per square mile)
497.9
1,316
House value disparities
34.7%
22.3%
Household income disparities
44.3%
40.9%
Median household income for houses/condes with a mortgage
$87,907
$138,524
Median household income for apartments without a mortgage
$61,761
$94,348
Housing units without a mortgage
1,238 (1.2%)
138 (0.4%)
Housing units with both a second mortgage and home equity loan
4,838 (4.7%)
1,162 (3.2%)
Housing units with a mortgage
100,798 (98.8%)
36,370 (99.6%)
Housing units with a home equity loan
123 (0.1%)
69 (0.2%)
Housing units with a second mortgage
5,921 (5.8%)
2,081 (5.7%)
House/condo owner moved in on average (years ago)
9
5
House/condo renter moved in on average (years ago)
1
1
Housing units lacking complete kitchen facilities
3.1%
4.4%
Housing units lacking complete plumbing facilities
1.9%
0.7%
Housing units in structures
Housing units in structures
Oklahoma City
McKinney
One, detached
67.8%
72.4%
One, attached
3.4%
2.2%
Two
2.0%
0.4%
3 or 4
5.1%
1.0%
5 to 9
6.0%
6.3%
10 to 19
5.6%
4.4%
20 to 49
2.4%
3.0%
50 or more
4.6%
9.1%
Mobile homes
3.1%
1.2%
Boats, RVs, vans, etc.
0.1%
0.0%
Median real estate property taxes paid for housing units
Self-employed workers in own not incorporated business
20,964
5,610
State government workers
17,132
939
Unpaid family workers
555
291
Industries and Occupations
The makeup of industries and occupations also differ in these cities. Oklahoma City's economy is dominated by sectors like government, transportation, utilities, and energy, with a sizable portion of occupations in office and administrative support. For McKinney, there's a large focus on sectors such as professional, scientific, and technical services.
Both cities boast high-quality healthcare systems. Oklahoma City is home to world-renowned hospitals and healthcare institutions. Similarly, McKinney features state-of-the-art healthcare facilities, providing access to quality medical services.
Oklahoma City is known for its extensive road network and has experienced significant infrastructure development recently. Conversely, McKinney, while smaller, has well-developed infrastructure with several community amenities and ongoing development projects, making it a smart city in the making.
HMDA - Conventional home purchase loans - Applications denied
Year
Oklahoma City
McKinney
1999
2,925
335
2000
2,396
129
2001
1,824
99
2002
1,507
62
2003
2,014
320
2004
2,323
580
2005
3,134
882
2006
3,132
921
2007
2,036
585
2008
1,143
280
2009
593
141
Culture and Food
Both cities have a unique culture and food scene. Oklahoma City, with its Western heritage, offers a range of cultural experiences and a food scene that is heavily influenced by BBQ and traditional Southern cuisine. McKinney, known for its historic downtown, offers a vibrant art scene and diverse dining options from global cuisine to Texas BBQ.
Sports Teams
Oklahoma City is home to a major NBA team, the Oklahoma City Thunder, drawing substantial fan support. McKinney doesn't host any major sports teams but is near Dallas, where residents can enjoy teams like the Dallas Cowboys and Dallas Mavericks.


 Oklahoma City, OK
 McKinney, TX