Oklahoma City, OK and Mesquite, TX are two unique American cities each with their distinctive charm. The matchup pits an exciting, flourishing urban center against a comfortably laid-back suburban community. Topics such as safety, cost of living, education, work and economy, infrastructure, industries and occupations, as well as culture and food, will be discussed to provide an all-encompassing picture regardless if you plan to visit or shift permanently.
Distance between
Oklahoma City, OK and
Mesquite, TX : 193.9 miles
Oklahoma City's population is larger by 366%. Its population has grown by 181,593 people (35.9%) since 2000. The population of Mesquite has grown by 23,168 people (18.6%) during that time.
Both Oklahoma City and Mesquite have slightly higher than national average crime rates. However, Oklahoma City's crime rate is significantly higher than Mesquite. Neighborhoods in the northwestern part of Oklahoma City and in southeastern Mesquite are considered safer areas in each city. It's crucial for both residents and tourists to take common safety precautions such as locking doors and not leaving valuables unattended.
City-data.com crime index counts serious crimes and violent crime more heavily. It adjusts for the number of visitors and daily workers commuting into cities. (higher means more crime, U.S. average = 301.1)
City-data.com crime index counts serious crimes and violent crime more heavily. It adjusts for the number of visitors and daily workers commuting into cities. (higher means more crime, U.S. average = 301.1)
Sex Offenders
According to our data, there are 1,385 registered sex offenders living in Oklahoma City and 183 registered sex offenders living in . The ratio of residents to sex offenders in Oklahoma City is 461 to 1; the ratio in Mesquite is 786 to 1. The number of registered sex offenders compared to the number of residents is larger in Oklahoma City than in Mesquite.
Cost of Living
When comparing the cost of living in both cities, Oklahoma City is cheaper overall. The greatest difference is in housing costs, where Oklahoma City has significantly lower prices compared to Mesquite. However, Mesquite has a relatively lower cost of groceries, health, and transportation.
Income Tax
Oklahoma does impose a state income tax, with rates ranging from 0.5% to 5%. Texas, on the other hand, is one of the seven states with no state income tax, a huge draw for many.
Property Tax
Oklahoma City's average property tax rate is notably lower than the national average. Conversely, Mesquite has more costly property taxes, with the tax rate significantly higher than the national average.
Sales Tax
Oklahoma City's combined city and state sales tax rate is 8.63%, while Mesquite's combined rate is 8.25%. This makes the overall tax rates relatively on par, with a slight advantage for Mesquite.
Income
Type
Oklahoma City
Mesquite
Estimated median household income
$59,214
$60,957
Estimated per capita income
$31,630
$28,429
Cost of living index (U.S. average is 100)
85.4
94.7
If you make $50,000 in Oklahoma City, you will have to make $55,445 in Mesquite to maintain the same standard of living.
Geographical Conditions
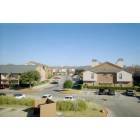
Oklahoma City, located in the Great Plains region, features a diverse landscape with prairies, small mountain ranges, and even forests. Mesquite, though primarily suburban, is situated near Lake Ray Hubbard offering plenty of outdoor recreation opportunities.
Oklahoma City's school system is larger and more diverse, with a host of magnet schools, charter schools, and private schools alongside traditional public school options. Mesquite has a smaller, but highly-rated school system, with Mesquite Independent School District being recognized for its academic achievements and innovative programs.
Oklahoma City has a diverse economy with sectors like aviation, biotech, energy, and healthcare leading the way. On the contrary, Mesquite's economy is based largely on retail, education, health services, and light industries. Both cities have an unemployment rate nearly the same as the national average.
Biggest Employers
Oklahoma City's largest employers are the State of Oklahoma, the Federal Government, and Integris Health. In Mesquite, the biggest employers include UPS, Dallas Regional Medical Center, and the Mesquite Independent School District.
There were 4,127 building permits issued in Oklahoma City in 2012 (2834 more than in 2011) compared to 560 building permits issued in Mesquite in 2012 (527 more than in 2011).
In Oklahoma City (Oklahoma County), 41.7% voted for Democrats and 58.3% for Republicans in 2012 Presidential Election. In Mesquite (Dallas County), 57.3% voted for Democrats and 41.8% for Republicans.
Elections
Type
Democrats
Republicans
Other
Year
Oklahoma City
Mesquite
Oklahoma City
Mesquite
Oklahoma City
Mesquite
2020
48.1%
65.1%
49.2%
33.4%
2.7%
1.4%
2016
41.2%
60.8%
51.7%
34.7%
7.1%
4.5%
2012
41.7%
57.3%
58.3%
41.8%
0.0%
1.0%
2008
41.6%
57.4%
58.4%
42.0%
0.0%
0.6%
2004
35.8%
49.0%
64.2%
50.4%
0.0%
0.5%
2000
36.6%
45.0%
62.3%
52.7%
1.1%
2.4%
1996
36.5%
46.0%
54.7%
46.8%
8.8%
7.2%
Breakdown of population affiliated with a religious congregation
Type
Adherents
Congregations
Religion
Oklahoma City
Mesquite
Oklahoma City
Mesquite
SOUTHERN BAPTIST CONVENTION
20.7%
11.0%
20.0%
31.1%
CATHOLIC CHURCH
8.5%
18.9%
3.0%
2.4%
EPISCOPAL CHURCH
0.7%
1.0%
1.3%
1.5%
INTERNA PENTECO HOLINESS CHURCH
0.7%
0.0%
2.9%
0.3%
LUTHERAN CHURCH
0.5%
0.3%
1.0%
0.7%
SEVENTH DAY ADVENTIST CHURCH
0.4%
0.5%
1.5%
1.7%
AMERICAN BAPTIST CHURCHES IN THE USA
0.3%
0.1%
0.1%
0.2%
MUSLIM ESTIMATE
0.3%
3.6%
0.6%
1.1%
EVANGELICAL LUTHERAN CHURCH IN AMERICA
0.2%
0.3%
0.9%
0.9%
Weather
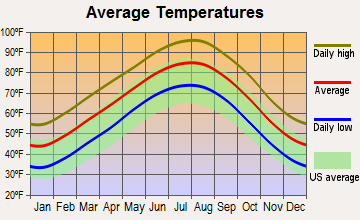
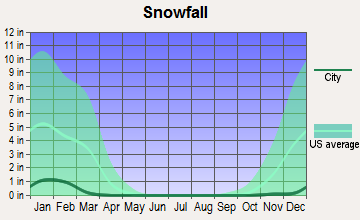
Both cities have a humid subtropical climate, but Oklahoma City has more perceptive four seasons, with hot summers and chilly winters that can occasionally include snow. Mesquite, on the other hand, has a milder winter and hotter, longer summers. Tornadoes can be a concern in both areas, particularly in Oklahoma City which sits in the heart of "Tornado Alley".
Weather and climate
Type
Oklahoma City
Mesquite
Temperature - Average
60.1°F
65.4°F
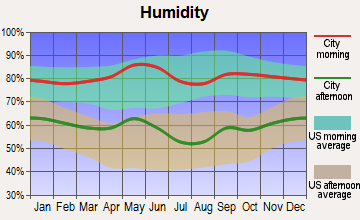
Humidity - Average morning or afternoon humidity
73.1%
71.3%
Humidity - Differences between morning and afternoon humidity
35%
34%
Humidity - Maximum monthly morning or afternoon humidity
85%
82%
Humidity - Minimum monthly morning or afternoon humidity
50%
48%
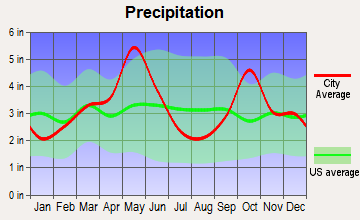
Precipitation - Yearly average
35.7 in
39 in
Snowfall - Yearly average
17.2 in
4.2 in
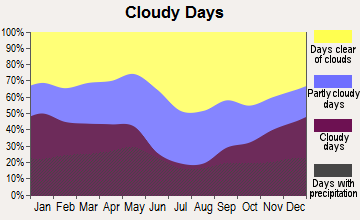
Clouds - Number of days clear of clouds
23.1%
22.7%
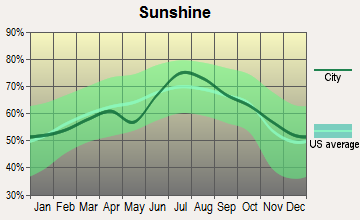
Sunshine amount - Average
72.1%
66.6%
Sunshine amount - Differences during a year
21%
20%
Sunshine amount - Maximum monthly
79%
74%
Sunshine amount - Minimum monthly
58%
54%
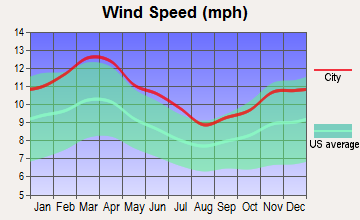
Wind speed - Average
12.3 mph
10.3 mph
Average climate in Oklahoma City, Oklahoma
Average climate in Mesquite, Texas
Air pollution
Type
AQI
CO
NO2
OZONE
PB
PM10
PM25
SO2
Year
Oklahoma City
Mesquite
Oklahoma City
Oklahoma City
Mesquite
Oklahoma City
Mesquite
Oklahoma City
Oklahoma City
Oklahoma City
Mesquite
Oklahoma City
Mesquite
2018
85
86
0.29
N/A
6.6
5.3
31.9
28.1
0.002
N/A
21.3
N/A
9.6
9.1
0.0
0.3
2017
82
84
0.32
N/A
6.7
5.0
33.0
29.0
0.002
N/A
20.7
N/A
8.9
8.7
0.0
0.4
2016
72
73
0.29
N/A
6.6
5.4
31.9
28.1
0.002
N/A
19.4
N/A
8.5
8.1
0.2
0.3
2015
76
82
0.24
N/A
7.0
5.9
31.5
28.3
0.002
N/A
19.1
N/A
7.8
8.5
0.5
0.3
2014
84
77
0.15
N/A
7.1
5.6
32.4
29.3
0.002
N/A
N/A
N/A
8.7
9.3
0.1
0.4
2013
84
96
0.14
N/A
8.6
6.5
32.8
30.6
0.002
N/A
N/A
N/A
9.3
11.7
0.2
0.4
2012
97
110
0.13
N/A
9.4
7.7
34.0
32.2
0.007
N/A
N/A
N/A
7.9
11.1
0.3
0.4
2011
107
99
0.24
N/A
9.9
8.3
36.3
32.4
0.003
N/A
N/A
N/A
9.9
10.7
0.8
0.7
2010
81
76
0.30
N/A
8.8
8.4
31.7
29.8
0.002
N/A
N/A
N/A
9.8
9.3
0.7
0.6
2009
82
90
0.52
N/A
8.1
8.1
31.9
30.4
0.002
N/A
N/A
N/A
10.2
9.1
0.7
0.5
2008
78
86
0.51
N/A
9.8
8.7
31.0
30.4
N/A
N/A
N/A
N/A
N/A
9.7
1.4
0.6
2007
81
99
0.44
N/A
10.2
9.5
29.4
27.4
N/A
N/A
N/A
N/A
N/A
10.2
2.0
0.4
2006
95
104
0.43
N/A
10.1
9.5
33.7
32.4
N/A
N/A
N/A
N/A
N/A
9.9
1.2
0.7
2005
88
107
0.38
N/A
11.6
11.3
31.0
31.6
N/A
N/A
N/A
N/A
N/A
11.0
1.3
0.8
2004
75
95
0.46
N/A
10.5
10.8
28.6
28.4
N/A
N/A
N/A
N/A
N/A
N/A
0.6
0.7
2003
87
100
0.42
N/A
10.9
12.1
30.8
30.4
N/A
N/A
N/A
N/A
N/A
N/A
N/A
0.9
2002
91
95
0.35
N/A
14.3
12.3
29.0
28.1
N/A
N/A
N/A
N/A
N/A
N/A
2.0
0.4
2001
87
91
0.69
N/A
13.1
12.3
31.0
28.4
N/A
N/A
N/A
N/A
N/A
N/A
1.8
0.9
2000
89
104
0.66
N/A
13.4
14.0
29.5
28.2
N/A
N/A
N/A
N/A
N/A
N/A
3.0
1.1
Natural disasters
Type
Oklahoma City
Mesquite
Tornado activity compared to U.S. average
353.4%
250.2%
Earthquake activity compared to U.S. average
938.9%
562.6%
Natural disasters compared to U.S. average
43%
21%
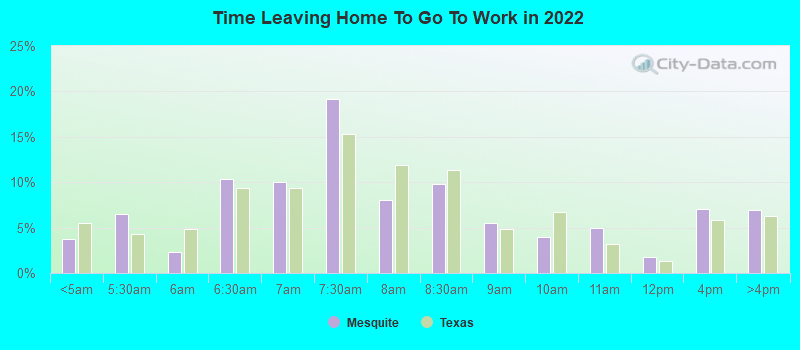
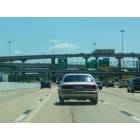
Transportation
Oklahoma City is highly car-dependent due to its sprawling nature with a developing public transit system. Mesquite lacks a rail system but has an efficient bus system, the Mesquite Transportation for the Elderly and Disabled (MTED), which caters specifically to elderly and disabled citizens.
Transport
Type
Oklahoma City
Mesquite
Amtrak stations
1
0
Amtrak stations nearby
2
1
FAA registered aircraft
0
82
FAA registered aircraft manufacturers and dealers
0
2
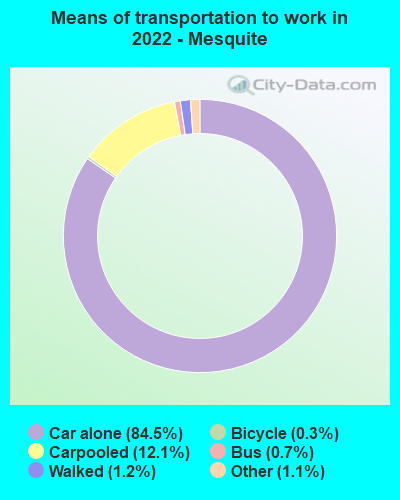
Means of transportation to work
Type
Oklahoma City
Mesquite
Bicycle
0.2%
0.3%
Bus
0.3%
0.6%
Carpooled
8.6%
11.5%
Car alone
87.6%
85.7%
Motorcycle
0.1%
0.1%
Taxicab
0.2%
0.1%
Walked
1.4%
1.1%
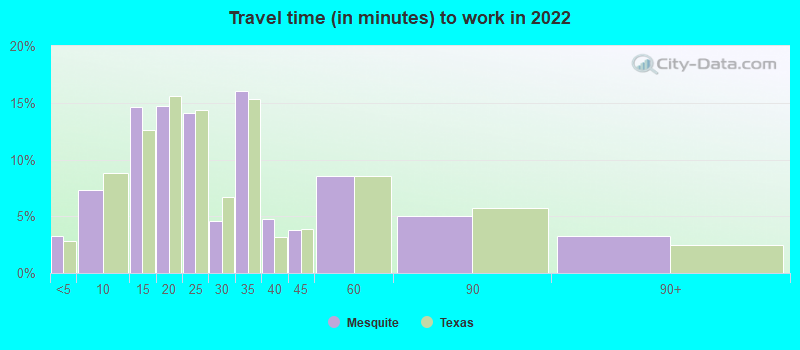
Average travel time to work
Type
Oklahoma City
Mesquite
Average
25.6 min
28.2 min
Other means
21 min
30.9 min
Public transportation
33.1 min
46.8 min
Private vehicle occupancy
Type
Oklahoma City
Mesquite
Average
1.2
1.2
Drove alone
89.5%
84.3%
In 2 person carpool
7.1%
11.3%
In 3 person carpool
1.9%
2.9%
In 4 person carpool
0.7%
0.7%
In 5-6 person carpool
0.5%
0.6%
In 7+ person carpool
0.2%
0.2%
How many people usually rode to work in the car, truck or van.
Real Estate
Due to its lower cost of living, real estate prices in Oklahoma City are generally lower than Mesquite, making it attractive for property buyers. Conversely, Mesquite's close proximity to Dallas makes it more expensive, but offers great opportunities for real estate investment given the stable market.
Neighborhoods
Oklahoma City’s neighborhoods, such as Deep Deuce and The Paseo, are vibrant and diverse, each with its unique character. Mesquite has more suburban, family-oriented neighborhoods like Creek Crossing and Pasadena Gardens, offering a quiet and comfortable lifestyle.
Houses and residents
Type
Oklahoma City
Mesquite
Houses
302,241
55,252
Average household size (people)
2.5
2.9
Median year apartment built
1978
1986
Median year house/condo built
1986
1983
Length of stay in the house since moving in
11.8 years
12.9 years
Houses occupied
275,285 (91.1%)
52,023 (94.2%)
Houses occupied by owners
164,470 (59.7%)
33,675 (64.7%)
Houses occupied by renters
110,815 (40.3%)
18,348 (35.3%)
Median rent asked for vacant for-rent units
$1,241
$1,206
Median monthly housing costs
$983
$1,213
Median price asked for vacant for-sale houses and condos
$278,299
$297,978
Estimated median house or condo value
$190,900
$208,900
Median numbers of rooms
5.5
5.4
Median number of rooms in apartments
4.3
4.2
Median number of rooms in houses and condos
6.2
6
Median house price - detached houses
$254,772
$178,609
Median house price - in 2-unit structures
$318,820
$84,682
Median house price - in 3-to-4-unit structures
$128,784
$148,342
Median house price - in 5 or more unit structures
$170,231
$240,293
Median house price - mobile homes
$112,256
$58,740
Median house price - Townhouses or other attached units
$245,885
$180,243
Median house price - All housing units
$249,488
$180,062
Median house age
40
37
Renting percentage
40.3%
38.6%
Housing density (houses/condos per square mile)
497.9
1,272.6
House value disparities
34.7%
24.3%
Household income disparities
44.3%
41.7%
Median household income for houses/condes with a mortgage
$87,907
$86,417
Median household income for apartments without a mortgage
$61,761
$71,936
Housing units without a mortgage
1,238 (1.2%)
267 (1.3%)
Housing units with both a second mortgage and home equity loan
4,838 (4.7%)
611 (2.9%)
Housing units with a mortgage
100,798 (98.8%)
20,601 (98.7%)
Housing units with a home equity loan
123 (0.1%)
0 (0%)
Housing units with a second mortgage
5,921 (5.8%)
975 (4.7%)
House/condo owner moved in on average (years ago)
9
13
House/condo renter moved in on average (years ago)
1
1
Housing units lacking complete kitchen facilities
3.1%
0.8%
Housing units lacking complete plumbing facilities
1.9%
1.7%
Housing units in structures
Housing units in structures
Oklahoma City
Mesquite
One, detached
67.8%
71.9%
One, attached
3.4%
2.6%
Two
2.0%
1.0%
3 or 4
5.1%
3.8%
5 to 9
6.0%
5.4%
10 to 19
5.6%
5.1%
20 to 49
2.4%
4.2%
50 or more
4.6%
4.1%
Mobile homes
3.1%
1.9%
Boats, RVs, vans, etc.
0.1%
0.0%
Median real estate property taxes paid for housing units
Self-employed workers in own not incorporated business
20,964
4,883
State government workers
17,132
1,369
Unpaid family workers
555
373
Industries and Occupations
In Oklahoma City, the biggest industries are public administration, health care, and retail trade, while in Mesquite, health care, education, and retail trade are the dominant industries. Top occupations in Oklahoma City include office and administrative support, sales, and management whereas in Mesquite, office and administrative support, sales, and education are most common.
Both cities offer excellent healthcare facilities. Oklahoma City is home to Integris Baptist Medical Center and the University of Oklahoma Medical Center. Mesquite has the Dallas Regional Medical Center, offering state-of-the-art medical services.
Health (county statistics)
Type
Oklahoma City
Mesquite
General health status score of residents in this county from 1 (poor) to 5 (excellent)
Oklahoma City's infrastructure is characterized by its expansive freeway network, modern downtown area, and multiple mixed-used neighborhoods. On the other hand, Mesquite is largely residential, with infrastructure reflecting its suburban nature: shopping centers, parks, and residential neighborhoods dominate the landscape.
HMDA - Conventional home purchase loans - Applications denied
Year
Oklahoma City
Mesquite
1999
2,925
810
2000
2,396
286
2001
1,824
190
2002
1,507
196
2003
2,014
463
2004
2,323
732
2005
3,134
967
2006
3,132
995
2007
2,036
633
2008
1,143
209
2009
593
81
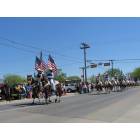
Culture and Food
Oklahoma City has a rich cultural scene, famous for its traditional cowboy culture, and a diverse culinary scene with specific flair for steak and BBQ. Mesquite is known as the "Rodeo Capital of Texas" and its food scene has a strong Tex-Mex influence, with barbecue and chili being popular dishes.
Sports Teams
Oklahoma City is home to the NBA team, the Oklahoma City Thunder. Mesquite, while it doesn't have a major league sports team, is close to Dallas and its array of professional sport teams, just a short drive away.


 Oklahoma City, OK
 Mesquite, TX