Phoenix, Arizona, and the North Coast of California offer distinct living experiences. Phoenix, known for its warm climate and diverse economy, contrasts with the North Coast's picturesque coastal scenery and a more relaxed pace of life. Much like any location, the quality of living in these areas largely depends on personal preference. However, key factors like crime and safety, weather, cost of living, education, employment opportunities, and infrastructure may influence someone's decision to move.
Phoenix has a higher crime rate compared to North Coast, CA. However, like many cities, crime rates can significantly vary by neighborhood. Some parts of Phoenix are extremely safe while others are more crime-afflicted. In contrast, the North Coast of California generally has lower crime rates, especially in rural and suburban areas.
Cost of Living
Living in Phoenix is significantly cheaper than living on the North Coast of California. The overall cost of housing, groceries, utilities, and transportation in Phoenix falls below the national average, while North Coast cities like Santa Rosa and Eureka are much pricier, particularly regarding housing and property taxes.
Income Tax
Arizona's state income tax ranges from 2.59% to 4.50%, while California has a progressive income tax system with rates ranging from 1% to 13.3%.
Property Tax
Property taxes in Phoenix are relatively low, with an average rate of around 0.64% of a property's market value, while on the North Coast of California, the average property tax rate is approximately 0.73%.
Sales Tax
Phoenix has a higher sales tax rate compared to the North Coast of California. The combined sales tax for Phoenix is 8.6% while the sales tax for most of the North Coast, CA, is around 7.5%.
Income
Type
Phoenix
North Coast
Estimated median household income
$68,435
$102,807
Estimated per capita income
$35,073
$50,809
Cost of living index (U.S. average is 100)
101.2
96.1
If you make $50,000 in North Coast, you will have to make $52,653 in Phoenix to maintain the same standard of living.
Geographical Conditions
Phoenix lies in the northeastern reaches of the Sonoran Desert and has a hot desert climate. The North Coast offers diverse terrain from coastal beaches to thick redwood forests and mountain ranges, perfect for outdoor enthusiasts.
Geographical information
Type
Phoenix
North Coast
Land area
474.9 sq. miles
59.4 sq. miles
Population density
3,421.1 people per sq. mile
6,335.5 people per sq. mile
Relative area comparison
Phoenix, AZ North Coast, CA
Education
Phoenix boasts many top-rated schools and is home to multiple colleges and universities, including Arizona State University. The North Coast, although smaller in population, also offers excellent public and private schools, as well as community colleges and four-year universities such as Humboldt State University.
Phoenix's economy is diverse, encompassing sectors like manufacturing, healthcare, finance, and retail. Job growth in Phoenix is positive and above the national average. The North Coast of California's economy is smaller and primarily driven by agriculture, healthcare, education, and tourism, with slower job growth compared to that of Phoenix.
Biggest Employers
In Phoenix, the top employers are Walmart, Banner Health System, and the City of Phoenix. On the North Coast, the largest employers include local government, health care facilities, and education institutions.
In Phoenix (Maricopa County), 43.6% voted for Democrats and 54.3% for Republicans in 2012 Presidential Election. In North Coast (Orange County), 45.8% voted for Democrats and 52.0% for Republicans.
Elections
Type
Democrats
Republicans
Other
Year
Phoenix
North Coast
Phoenix
North Coast
Phoenix
North Coast
2020
50.2%
53.6%
48.0%
44.6%
1.8%
1.8%
2016
44.9%
50.9%
47.7%
42.4%
7.5%
6.7%
2012
43.6%
45.8%
54.3%
52.0%
2.1%
2.3%
2008
44.0%
47.8%
54.5%
50.3%
1.5%
1.9%
2004
42.4%
39.3%
57.0%
60.2%
0.6%
0.5%
2000
43.0%
40.4%
53.4%
55.9%
3.6%
3.7%
1996
44.5%
37.9%
47.2%
51.7%
8.2%
10.5%
Breakdown of population affiliated with a religious congregation
Type
Adherents
Congregations
Religion
Phoenix
North Coast
Phoenix
North Coast
CATHOLIC CHURCH
13.6%
26.5%
4.3%
4.4%
SOUTHERN BAPTIST CONVENTION
1.9%
2.3%
6.5%
8.8%
EVANGELICAL LUTHERAN CHURCH IN AMERICA
0.8%
0.4%
2.0%
2.3%
LUTHERAN CHURCH
0.5%
0.6%
1.5%
2.0%
SEVENTH DAY ADVENTIST CHURCH
0.4%
0.4%
2.0%
1.3%
EPISCOPAL CHURCH
0.3%
0.4%
1.3%
1.4%
VINEYARD USA
0.3%
0.2%
0.6%
0.7%
MUSLIM ESTIMATE
0.2%
0.8%
1.0%
1.3%
REFORMED CHURCH IN AMERICA
0.0%
0.3%
0.2%
0.2%
Weather
Phoenix is well-known for its hot desert climate, with summer temperatures often exceeding 100 degrees. However, it provides over 300 sunny days a year which could appeal to sun lovers. The North Coast of California enjoys a more moderate, Mediterranean climate with cooler, wet summers and mild, wet winters—an excellent location for those who prefer a more temperate climate.
Weather and climate
Type
Phoenix
North Coast
Temperature - Average
71.5°F
64.4°F
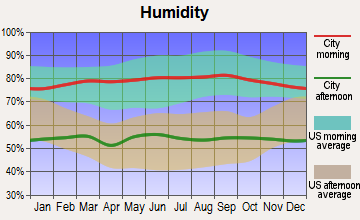
Humidity - Average morning or afternoon humidity
37.5%
70.2%
Humidity - Differences between morning and afternoon humidity
48%
26.7%
Humidity - Maximum monthly morning or afternoon humidity
60%
78.7%
Humidity - Minimum monthly morning or afternoon humidity
12%
52%
Precipitation - Yearly average
8.7 in
13 in
Snowfall - Yearly average
0 in
0 in
Clouds - Number of days clear of clouds
35.3%
26.5%
Sunshine amount - Average
92.8%
78.4%
Sunshine amount - Differences during a year
16%
21.9%
Sunshine amount - Maximum monthly
95%
84.9%
Sunshine amount - Minimum monthly
79%
62.9%
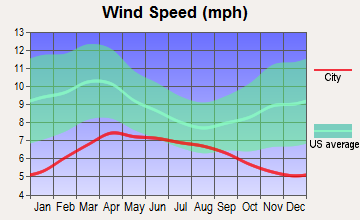
Wind speed - Average
6.6 mph
6 mph
Average climate in Phoenix, Arizona
Average climate in North Coast, California
Air pollution
Type
AQI
CO
NO2
OZONE
PB
PM10
PM25
SO2
Year
Phoenix
North Coast
Phoenix
North Coast
Phoenix
North Coast
Phoenix
North Coast
North Coast
Phoenix
North Coast
Phoenix
North Coast
Phoenix
North Coast
2018
156
119
0.38
0.35
15.2
14.4
28.5
26.1
N/A
N/A
34.8
27.5
8.6
12.6
0.6
0.7
2017
120
116
0.41
0.34
15.9
13.8
28.6
28.8
N/A
N/A
34.9
26.7
7.6
13.8
1.4
0.5
2016
114
102
0.44
0.33
15.8
12.2
27.3
29.3
N/A
N/A
30.6
24.1
7.7
12.5
0.4
0.2
2015
102
106
0.46
0.32
17.6
13.2
27.1
29.8
N/A
N/A
26.2
25.0
7.9
14.5
0.9
0.2
2014
117
110
0.46
0.29
19.6
12.9
27.6
28.6
N/A
N/A
37.0
26.7
8.5
15.5
1.1
0.4
2013
130
107
0.43
0.34
19.9
13.9
27.9
27.8
0.003
N/A
35.3
29.5
8.4
14.2
0.9
0.3
2012
157
103
0.44
0.30
21.2
12.7
28.1
26.8
0.004
N/A
41.9
28.2
8.8
14.3
1.3
0.1
2011
203
109
0.47
0.31
20.0
14.7
28.3
27.0
0.006
N/A
41.3
27.7
9.6
15.9
0.9
0.7
2010
100
102
0.48
0.33
19.9
14.3
26.9
26.2
0.011
N/A
31.2
23.6
8.3
14.0
0.9
0.6
2009
108
118
0.52
0.35
20.1
15.5
25.6
27.6
0.009
N/A
38.2
24.3
N/A
14.5
1.8
1.1
2008
106
124
0.48
0.39
21.4
16.5
26.6
28.2
0.010
N/A
39.6
29.5
N/A
21.6
2.4
1.1
2007
129
100
0.54
0.36
23.5
16.3
25.2
27.0
0.012
N/A
47.6
N/A
N/A
N/A
2.4
0.8
2006
131
114
0.66
0.40
25.3
17.2
24.4
26.4
0.007
N/A
50.8
N/A
N/A
N/A
2.3
1.3
2005
109
95
0.74
0.39
25.9
17.7
22.2
27.9
0.012
N/A
44.6
N/A
N/A
N/A
2.5
1.3
2004
98
119
0.77
0.50
25.5
19.2
23.4
30.5
0.014
N/A
32.8
N/A
N/A
N/A
1.4
1.6
2003
101
122
0.90
0.64
26.8
21.9
23.7
28.9
0.030
N/A
42.6
N/A
N/A
N/A
1.4
1.1
2002
111
106
0.98
0.65
28.7
22.0
23.6
25.5
0.018
N/A
41.8
N/A
N/A
N/A
1.6
1.8
2001
106
116
1.00
0.73
28.6
22.0
22.3
25.4
0.033
N/A
37.8
N/A
N/A
N/A
1.5
1.5
2000
117
125
1.14
0.80
29.9
24.4
24.6
24.0
0.027
N/A
45.6
N/A
N/A
N/A
1.7
1.9
Natural disasters
Type
Phoenix
North Coast
Tornado activity compared to U.S. average
18.3%
18.6%
Earthquake activity compared to U.S. average
2,597.6%
6,843.6%
Natural disasters compared to U.S. average
16%
32%
Transportation
Phoenix offers extensive public transit options, including light rail, buses, and a grid of freeways for easy commuting. North Coast, primarily rural, relies heavily on personal vehicles, with public transit more limited and fewer main highways.
Transport
Type
Phoenix
North Coast
Amtrak stations
3
0
Amtrak stations nearby
3
3
FAA registered aircraft
1
0
FAA registered aircraft manufacturers and dealers
15
0
Means of transportation to work
Type
Phoenix
North Coast
Bicycle
0.4%
0.7%
Bus
1.8%
1.2%
Carpooled
12.2%
10.7%
Car alone
81.8%
81.4%
Motorcycle
0.4%
0.2%
Railroad
0.2%
0%
Taxicab
0.1%
0%
Walked
1.4%
1.4%
Average travel time to work
Type
Phoenix
North Coast
Average
28.6 min
28.8 min
Real Estate
Real estate is more affordable in Phoenix with the median home cost considerably lower than the national average. In contrast, the housing market on the North Coast is typically more expensive, especially in popular coastal towns.
Neighborhoods
Phoenix offers a blend of urban and suburban neighborhoods, catering to various lifestyles. Downtown Phoenix is vibrant, while areas like Arcadia and Paradise Valley are known for more serene suburban living. The North Coast is known for its tight-knit communities and scenic coastal towns like Mendocino and Eureka.
Houses and residents
Type
Phoenix
North Coast
Houses
644,625
137,450
Average household size (people)
2.8
2.7
Houses occupied
602,039 (93.4%)
133,254 (96.9%)
Houses occupied by owners
354,237 (58.8%)
84,546 (63.4%)
Houses occupied by renters
247,802 (41.2%)
48,708 (36.6%)
Median rent asked for vacant for-rent units
$1,605
$2,340
Median price asked for vacant for-sale houses and condos
$375,817
$1,099,558
Estimated median house or condo value
$352,600
$883,291
Median number of rooms in apartments
4
3.9
Median number of rooms in houses and condos
6.1
6.1
Renting percentage
42.4%
37.7%
Housing density (houses/condos per square mile)
1,357.5
2,312.7
Household income disparities
43.9%
41.2%
Housing units without a mortgage
3,634 (1.5%)
13,396 (19.5%)
Housing units with both a second mortgage and home equity loan
12,949 (5.2%)
282 (0.4%)
Housing units with a mortgage
246,434 (98.5%)
55,188 (80.5%)
Housing units with a home equity loan
624 (0.2%)
6,297 (9.2%)
Housing units with a second mortgage
16,890 (6.8%)
7,643 (11.1%)
Housing units lacking complete kitchen facilities
1.2%
1%
Housing units lacking complete plumbing facilities
Self-employed workers in own not incorporated business
48,122
15,532
State government workers
30,385
5,751
Unpaid family workers
1,048
744
Industries and Occupations
The primary industries in Phoenix encompass healthcare, education, retail, and tourism, with top occupations in management, healthcare, sales, and finance. North Coast's most prevalent industries include agriculture, healthcare, education, and tourism, with the most common jobs in management, education, healthcare and food service.
Phoenix, home to the Mayo Clinic and Banner Health System, is a healthcare hub in the Southwest. The North Coast also provides good healthcare services but has fewer major medical centers due to its smaller population.
Health (county statistics)
Type
Phoenix
North Coast
General health status score of residents in this county from 1 (poor) to 5 (excellent)
Phoenix boasts a well-planned infrastructure, including extensive freeway and public transit systems, and Phoenix Sky Harbor International Airport. The infrastructure in North Coast, CA, is less extensive due to its more rural nature, but also includes reliable roadways and a handful of regional airports.
Infrastructure
Type
Phoenix
North Coast
TV stations
22
2
Culture and Food
Phoenix is a blend of cultures with a vibrant food scene, featuring Mexican cuisine, BBQ, and farm-to-table restaurants. It also hosts various cultural festivals every year. The North Coast is known for its farm-to-fork dining, wine industry, and arts and music festivals throughout the year.
Sports Teams
Phoenix is home to several professional sports teams, including the Arizona Cardinals (NFL), the Diamondbacks (MLB), and the Suns (NBA). The North Coast doesn't have any professional sports teams, but it has a strong community sports culture, with college and local sports being popular.
 Phoenix, AZ
 North Coast, CA