Raleigh and Cary are two bustling cities in North Carolina that offer distinguishing features for both residents and tourists. Raleigh, the state capital, is known for its vibrant events and high employment opportunities, while Cary is commonly called a "bedroom community," noted for its tranquility and high quality of life. The favorable weather, low cost of living, excellent education systems, and ease of commuting make the two cities desirable places to live or visit. However, they differ in factors such as crime rates, property prices, cultures, and sports offerings.
Distance between
Raleigh, NC and
Cary, NC : 9.1 miles
Raleigh's population is larger by 165%. Its population has grown by 193,031 people (69.9%) since 2000. The population of Cary has grown by 82,451 people (87.2%) during that time.
Raleigh and Cary both provide a safe environment, but Cary stands out with one of the lowest crime rates in America. Cary's crime rate is about 84% lower than the national average, making it one of the safest cities to live in the country. Raleigh, being larger and the state’s capital, naturally has a higher crime rate, but it's still lower when compared to other major cities in the USA.
City-data.com crime index counts serious crimes and violent crime more heavily. It adjusts for the number of visitors and daily workers commuting into cities. (higher means more crime, U.S. average = 301.1)
City-data.com crime index counts serious crimes and violent crime more heavily. It adjusts for the number of visitors and daily workers commuting into cities. (higher means more crime, U.S. average = 301.1)
Sex Offenders
According to our data, there are 2,161 registered sex offenders living in Raleigh and 40 registered sex offenders living in . The ratio of residents to sex offenders in Raleigh is 212 to 1; the ratio in Cary is 4,100 to 1. The number of registered sex offenders compared to the number of residents is much larger in Raleigh than that in Cary.
Cost of Living
Though Raleigh and Cary offer a lower cost of living compared to national averages, Cary is slightly more expensive due to higher housing costs. Grocery, transportation, and utilities prices are relatively similar in both cities, while healthcare costs stand slightly higher in Raleigh.
Income Tax
Raleigh and Cary, both fall under the North Carolina income tax laws. The state applies a flat rate of 5.25% for all income brackets.
Property Tax
While Raleigh has slightly higher property taxes than the national average, Cary has somewhat lower property tax rates. However, due to the higher average property values in Cary, a homeowner may end up paying the same or at times more property tax.
Sales Tax
The combined state and local sales taxes for Raleigh and Cary are similar. As of 2022, both cities have a combined rate of 7.25%, which is the maximum local tax rate allowed under North Carolina law.
Income
Type
Raleigh
Cary
Estimated median household income
$74,612
$123,857
Estimated per capita income
$44,001
$58,024
Cost of living index (U.S. average is 100)
95.1
94.7
If you make $50,000 in Cary, you will have to make $50,211 in Raleigh to maintain the same standard of living.
Geographical Conditions
Both Raleigh and Cary are relatively flat, with rolling hills and an abundance of trees. They are both inland cities, but it's a comfortable drive to the beautiful Carolina beaches or the Appalachian mountains.
Both cities boast top-class education systems, with numerous highly rated public schools, charter schools, and prestigious universities. Raleigh, housing North Carolina State University and being part of the Research Triangle, may attract more academics and research professionals. However, Cary is not left behind with notable schools like the Cary High and top-rated Wake County Public School System.
Raleigh has a robust and diverse economy with good job growth. The city offers opportunities in sectors such as technology, healthcare, and education, with a lower unemployment rate than the national average. Cary’s economy, while not as diverse, is also strong, focusing on tech, telecom, and healthcare sectors. Many Cary residents commute to Raleigh and other nearby cities for work.
Biggest Employers
In Raleigh, North Carolina State University, WakeMed Health & Hospitals, and Duke Energy Progress are some top employers. On the other hand, Cary’s largest employers include SAS Institute, Verizon, and Wake County Public School System.
There were 1,354 building permits issued in Raleigh in 2012 (366 more than in 2011) compared to 964 building permits issued in Cary in 2012 (6 less than in 2011).
Weather
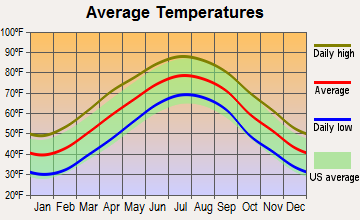
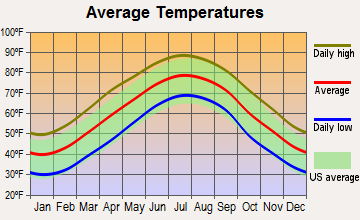
The weather in Raleigh and Cary is almost identical due to their close geographic proximity. Both cities enjoy a temperate climate with four distinct seasons. Springs are short and quickly give rise to warm summers, while fall brings comfortable temperatures and vibrant foliage. Winter is usually mild, but both cities can experience occasional snowfall.
Weather and climate
Type
Raleigh
Cary
Temperature - Average
59.8°F
59.9°F
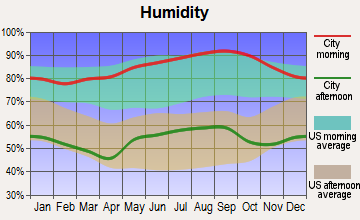
Humidity - Average morning or afternoon humidity
73.7%
73.7%
Humidity - Differences between morning and afternoon humidity
44%
44%
Humidity - Maximum monthly morning or afternoon humidity
90%
90%
Humidity - Minimum monthly morning or afternoon humidity
46%
46%
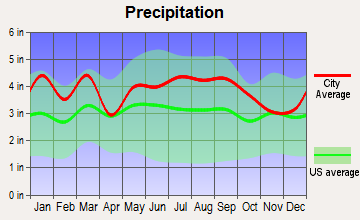
Precipitation - Yearly average
46.2 in
44.8 in
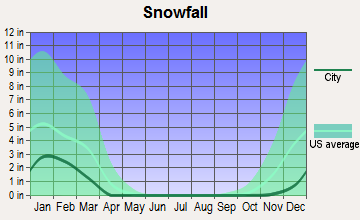
Snowfall - Yearly average
13.4 in
13.4 in
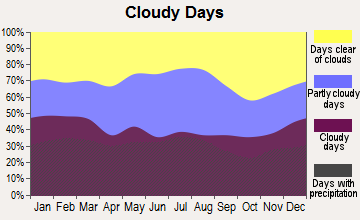
Clouds - Number of days clear of clouds
18.5%
18.5%
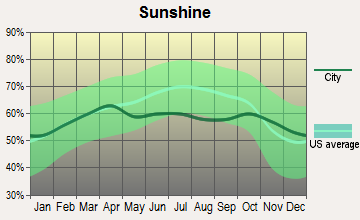
Sunshine amount - Average
63.9%
63.9%
Sunshine amount - Differences during a year
13%
13%
Sunshine amount - Maximum monthly
64%
64%
Sunshine amount - Minimum monthly
51%
51%
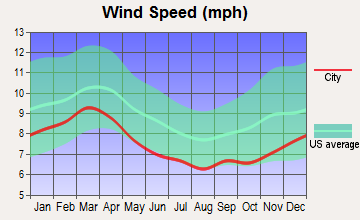
Wind speed - Average
7.1 mph
7.1 mph
Average climate in Raleigh, North Carolina
Average climate in Cary, North Carolina
Air pollution
Type
AQI
CO
NO2
OZONE
PM10
PM25
SO2
Year
Raleigh
Cary
Raleigh
Cary
Raleigh
Cary
Raleigh
Cary
Raleigh
Cary
Raleigh
Cary
Raleigh
Cary
2018
71
71
0.23
0.23
4.9
8.1
27.5
27.6
14.6
14.2
9.5
9.2
0.2
0.2
2017
70
70
0.23
0.23
5.5
8.7
25.8
25.8
14.7
14.1
9.3
9.1
0.2
0.2
2016
80
80
0.23
0.23
5.6
8.6
26.9
26.6
8.7
8.6
10.0
9.7
0.3
0.3
2015
79
79
0.27
0.27
5.7
8.9
28.6
25.9
12.4
12.4
11.0
10.3
0.3
0.4
2014
74
74
0.26
0.26
6.0
9.8
29.9
27.6
N/A
N/A
11.2
10.1
0.3
0.4
2013
72
72
0.26
0.26
N/A
N/A
26.9
24.3
N/A
N/A
10.7
9.7
0.4
0.3
2012
80
79
0.28
0.28
N/A
N/A
29.7
27.0
N/A
N/A
9.5
9.1
0.6
0.6
2011
84
84
0.27
0.27
N/A
N/A
32.9
30.1
N/A
N/A
10.3
10.1
0.7
0.7
2010
89
90
0.30
0.30
N/A
N/A
32.4
28.4
N/A
N/A
10.9
10.7
1.0
1.0
2009
77
77
0.30
0.31
N/A
N/A
27.8
25.0
N/A
N/A
10.3
10.2
1.0
1.0
2008
99
98
0.36
0.37
N/A
N/A
32.3
29.5
N/A
N/A
12.5
12.7
1.4
1.5
2007
98
97
0.40
0.40
N/A
N/A
35.7
33.0
N/A
N/A
13.9
13.9
1.2
1.2
2006
90
89
0.44
0.43
N/A
N/A
31.9
29.3
N/A
N/A
13.5
13.5
0.9
0.9
2005
80
78
0.38
0.40
N/A
N/A
33.9
30.6
N/A
N/A
N/A
N/A
2.5
2.5
2004
82
79
0.40
0.41
N/A
N/A
28.4
27.1
N/A
N/A
N/A
N/A
2.6
2.6
2003
82
80
N/A
N/A
N/A
N/A
29.9
31.0
N/A
N/A
N/A
N/A
3.0
3.0
2002
89
89
N/A
N/A
N/A
N/A
36.1
36.5
N/A
N/A
N/A
N/A
2.6
2.6
2001
128
79
N/A
N/A
N/A
N/A
34.5
35.9
N/A
N/A
N/A
N/A
N/A
1.9
2000
115
115
0.64
0.65
N/A
N/A
34.1
36.6
N/A
N/A
N/A
N/A
N/A
N/A
Natural disasters
Type
Raleigh
Cary
Tornado activity compared to U.S. average
95.1%
94.4%
Earthquake activity compared to U.S. average
52.6%
54.1%
Natural disasters compared to U.S. average
18%
18%
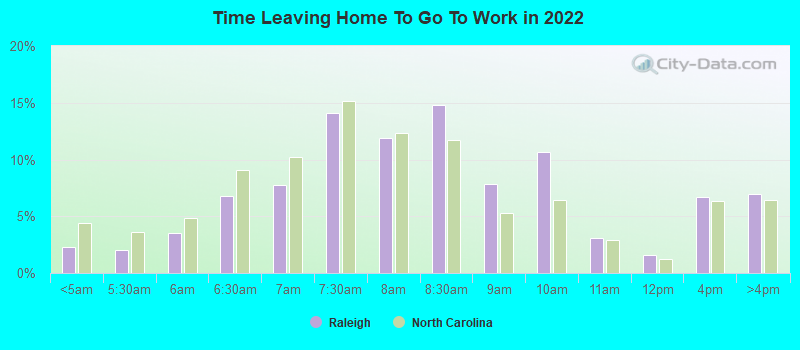
Transportation
Raleigh's transit system includes buses, an Amtrak station, and airport, offering more thorough public transportation and commuting options. Cary, while having its public transit systems and being on the Amtrak line, is indeed more car-oriented. Many Cary residents also commute to work in Raleigh and other nearby areas.
Transport
Type
Raleigh
Cary
Amtrak stations
1
1
Amtrak stations nearby
3
3
FAA registered aircraft
499
104
FAA registered aircraft manufacturers and dealers
12
0
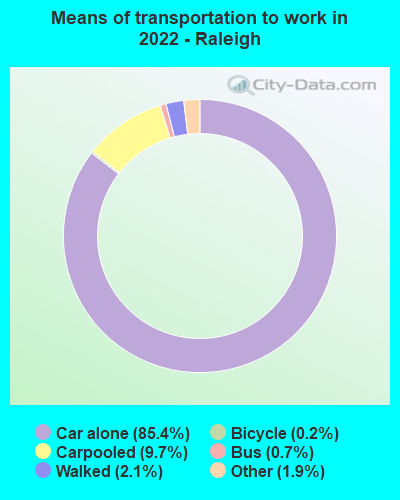
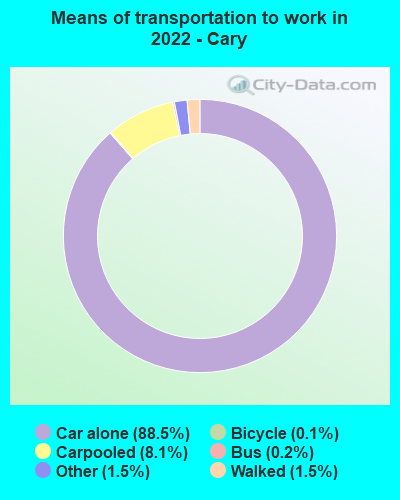
Means of transportation to work
Type
Raleigh
Cary
Bicycle
0.2%
0.1%
Bus
1.1%
0.2%
Carpooled
8.5%
9%
Car alone
87.4%
88.2%
Motorcycle
0.1%
0%
Taxicab
0.3%
0.1%
Walked
1.1%
1.4%
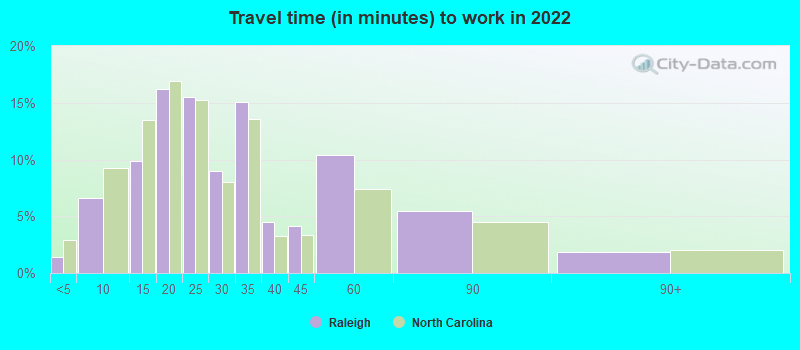
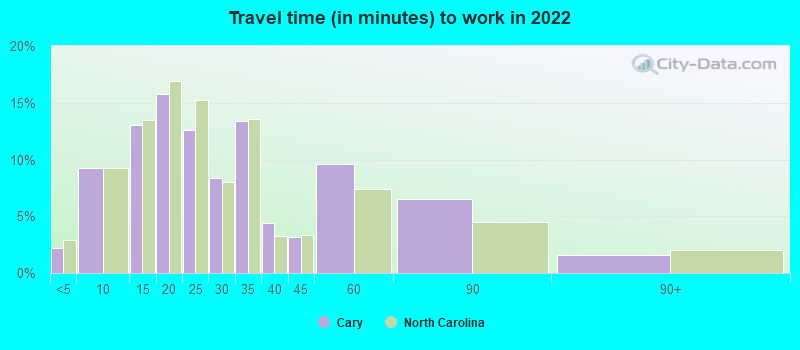
Average travel time to work
Type
Raleigh
Cary
Average
29.4 min
28.6 min
Other means
22.5 min
23.1 min
Public transportation
39.9 min
40 min
Private vehicle occupancy
Type
Raleigh
Cary
Average
1.1
1.1
Drove alone
90.1%
91.1%
In 2 person carpool
7.6%
6.8%
In 3 person carpool
1.4%
1.2%
In 4 person carpool
0.3%
0.3%
In 5-6 person carpool
0.6%
0.3%
In 7+ person carpool
0.1%
0.2%
How many people usually rode to work in the car, truck or van.
Real Estate
Real estate values are higher in Cary, with a medium home value far exceeding Raleigh. Despite that, both cities have seen significant property value growth over the past few years due to the increasing number of people seeking to relocate to these areas. Rental prices also tend to be higher in Cary.
Neighborhoods
Raleigh offers a range of neighborhoods to suit various lifestyles, from bustling downtown areas to quieter suburban communities. Cary is primarily suburban and is known for its clean, quiet, and family-friendly neighborhoods. Both cities offer neighborhoods with excellent community amenities.
Houses and residents
Type
Raleigh
Cary
Houses
217,866
69,951
Average household size (people)
2.4
2.6
Median year apartment built
1995
2003
Median year house/condo built
1995
1999
Length of stay in the house since moving in
11.5 years
11 years
Houses occupied
194,917 (89.5%)
65,254 (93.3%)
Houses occupied by owners
103,367 (53%)
44,779 (68.6%)
Houses occupied by renters
91,550 (47%)
20,475 (31.4%)
Median rent asked for vacant for-rent units
$1,740
$1,793
Median monthly housing costs
$1,298
$1,567
Median price asked for vacant for-sale houses and condos
$302,120
$475,783
Estimated median house or condo value
$340,200
$463,200
Median numbers of rooms
5.1
6.7
Median number of rooms in apartments
3.9
4.3
Median number of rooms in houses and condos
6.7
8.1
Median house price - detached houses
$446,507
$541,802
Median house price - in 2-unit structures
$403,968
$251,441
Median house price - in 3-to-4-unit structures
$170,635
$151,427
Median house price - in 5 or more unit structures
$306,998
$200,213
Median house price - mobile homes
$31,622
$34,861
Median house price - Townhouses or other attached units
$292,086
$370,857
Median house price - All housing units
$404,828
$510,030
Median house age
26
21
Renting percentage
46.5%
31.2%
Housing density (houses/condos per square mile)
1,901.1
1,661.9
House value disparities
30.8%
24.8%
Household income disparities
45.4%
38%
Median household income for houses/condes with a mortgage
$114,680
$148,018
Median household income for apartments without a mortgage
$81,716
$132,477
Housing units without a mortgage
1,689 (2.1%)
692 (2.1%)
Housing units with both a second mortgage and home equity loan
6,627 (8.2%)
4,316 (12.8%)
Housing units with a mortgage
78,923 (97.9%)
33,023 (97.9%)
Housing units with a home equity loan
0 (0%)
166 (0.5%)
Housing units with a second mortgage
7,783 (9.7%)
4,903 (14.5%)
House/condo owner moved in on average (years ago)
8
9
House/condo renter moved in on average (years ago)
1
1
Housing units lacking complete kitchen facilities
0.6%
1.1%
Housing units lacking complete plumbing facilities
0.5%
0.6%
Housing units in structures
Housing units in structures
Raleigh
Cary
One, detached
45.0%
61.2%
One, attached
14.0%
14.0%
Two
1.2%
0.6%
3 or 4
4.6%
2.0%
5 to 9
6.3%
4.5%
10 to 19
12.4%
7.2%
20 to 49
6.0%
4.6%
50 or more
9.2%
5.2%
Mobile homes
1.2%
0.8%
Median real estate property taxes paid for housing units
Self-employed workers in own not incorporated business
12,488
4,480
State government workers
19,792
5,376
Unpaid family workers
523
53
Industries and Occupations
Raleigh's major employers are in the public sector, healthcare, and education, but the city also supports a growing technology sector. Cary, as part of the Research Triangle, shows a concentration of technology and research-based occupations. Tech companies like SAS and Verizon have their strong presence in Cary.
Health diagnosing and treating practitioners and other technical occupations
7.3%
9.0%
Food preparation and serving related occupations
5.2%
3.6%
Health technologists and technicians
4.0%
3.5%
Computer and mathematical occupations
3.2%
8.8%
Life, physical, and social science occupations
2.8%
2.8%
Healthcare support occupations
2.6%
2.8%
Community and social service occupations
2.6%
3.5%
Arts, design, entertainment, sports, and media occupations
2.5%
1.2%
Production occupations
2.5%
2.4%
Building and grounds cleaning and maintenance occupations
2.5%
1.1%
Personal care and service occupations
2.5%
2.7%
Legal occupations
1.7%
1.6%
Transportation occupations
1.4%
1.3%
Architecture and engineering occupations
1.0%
2.0%
Material moving occupations
0.9%
1.5%
Health Care
Raleigh is home to several top-rated hospitals and is particularly known for WakeMed Health. Cary, despite being smaller, also offers excellent healthcare with facilities like WakeMed Cary Hospital and UNC REX Healthcare.
Raleigh’s urban infrastructure offers more high-rise buildings and a mixed-use downtown area. Good-quality roads, reliable utilities, and various public facilities characterize the city. In contrast, Cary is largely suburban, with tree-lined streets, parks, and a higher emphasis on residential areas, while still accommodating commercial areas.
Infrastructure
Type
Raleigh
Cary
Hospitals
19
4
TV stations
20
25
Bank branches located here
136
44
Bank institutions located here
27
12
Main business address for public companies
21
5
Nuclear power plants nearby
1
1
Drinking water stations with no reported violations in the past
2
42
Drinking water stations with reported violations in the past
HMDA - Conventional home purchase loans - Applications denied
Year
Raleigh
Cary
1999
1,618
340
2000
890
184
2001
557
123
2002
510
93
2003
564
103
2004
700
154
2005
1,083
190
2006
1,097
260
2007
859
208
2008
424
141
2009
253
78
Culture and Food
With a wide selection of dining options, arts and music festivals, and historical attractions, Raleigh boasts a vibrant cultural scene. Cary's culture is more low-key, but still rich with arts centers, parks, and a charming downtown area. Both cities offer a wide range of dining options with a focus on southern cuisine.
Sports Teams
Raleigh is home to professional sports teams like the NHL's Carolina Hurricanes. It also has a robust college sports scene, especially with NC State University being in town. Cary, while not having any major professional sports teams, boasts premier sports facilities, like the USA Baseball National Training Complex and WakeMed Soccer Park.


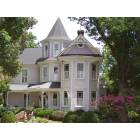


 Raleigh, NC
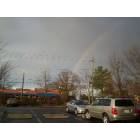
 Cary, NC