Both San Jose, CA, and Chandler, AZ, have much to offer residents and visitors alike, though they differ significantly. San Jose is a booming tech hub in the heart of Silicon Valley, offering excellent job opportunities, a high cost of living, and a diverse cultural scene. On the other hand, Chandler is a growing city known for its strong tech and manufacturing industries, lower cost of living, and warmer climate.
Distance between
San Jose, CA and
Chandler, AZ : 628.1 miles
San Jose's population is larger by 252%. Its population has grown by 88,546 people (9.9%) since 2000. The population of Chandler has grown by 102,877 people (58.3%) during that time.
Compared to national averages, both San Jose and Chandler have lower crime rates, with Chandler being slightly safer. San Jose's crime rate has been decreasing over recent years, although it remains a bit higher than Chandler's. Both cities offer safe neighborhoods appealing to families, but Chandler ranks better in terms of overall safety.
City-data.com crime index counts serious crimes and violent crime more heavily. It adjusts for the number of visitors and daily workers commuting into cities. (higher means more crime, U.S. average = 301.1)
City-data.com crime index counts serious crimes and violent crime more heavily. It adjusts for the number of visitors and daily workers commuting into cities. (higher means more crime, U.S. average = 301.1)
Sex Offenders
According to our data, there are 1,806 registered sex offenders living in San Jose and 99 registered sex offenders living in . The ratio of residents to sex offenders in San Jose is 568 to 1; the ratio in Chandler is 2,500 to 1. The number of registered sex offenders compared to the number of residents is much larger in San Jose than that in Chandler.
Cost of Living
San Jose’s cost of living is significantly higher than Chandler’s due to its prime location in Silicon Valley. Housing is the most considerable difference, as San Jose has one of the highest housing costs in the nation. Overall, Chandler provides a much more affordable cost of living than San Jose.
Income Tax
California’s progressive income tax has rates ranging from 1% to 13.3%. Arizona has lower income tax rates, ranging from 2.59% to 4.50%.
Property Tax
Property taxes in San Jose are relatively high compared to Chandler. The average property tax rate is 0.77% in San Jose, while it's at 0.56% in Chandler.
Sales Tax
San Jose residents pay a total sales tax of 9.25%, while Chandler residents pay slightly less at 8.05%.
Income
Type
San Jose
Chandler
Estimated median household income
$126,377
$94,613
Estimated per capita income
$57,357
$46,965
Cost of living index (U.S. average is 100)
127.4
101.2
If you make $50,000 in Chandler, you will have to make $62,945 in San Jose to maintain the same standard of living.
Geographical Conditions
San Jose, located in Santa Clara Valley, enjoys a Mediterranean climate, scenic views and proximity to both beaches and mountains. Chandler is situated in the Sonoran Desert and known for its picturesque sunsets, cacti, and vast open spaces.
In terms of Education, both cities boast higher than average school ratings. San Jose offers a variety of top-tier universities like San Jose State University and is nearby Stanford and Santa Clara Universities. Chandler also has strong K-12 schools and is home to the Chandler-Gilbert Community College.
San Jose, as part of Silicon Valley, has a booming economy with numerous job opportunities in tech, software, and IT services. In contrast, Chandler also has a robust economy, with strong industries in manufacturing, finance, and tech.
Biggest Employers
In San Jose, the largest employers are Cisco Systems, eBay, and Adobe. Chandler's biggest employers include Intel, Wells Fargo, and Bank of America.
There were 299 building permits issued in San Jose in 2012 (216 more than in 2011) compared to 670 building permits issued in Chandler in 2012 (5 more than in 2011).
In San Jose (Santa Clara County), 70.0% voted for Democrats and 27.1% for Republicans in 2012 Presidential Election. In Chandler (Maricopa County), 43.6% voted for Democrats and 54.3% for Republicans.
Elections
Type
Democrats
Republicans
Other
Year
San Jose
Chandler
San Jose
Chandler
San Jose
Chandler
2020
72.7%
50.2%
25.2%
48.0%
2.1%
1.8%
2016
72.7%
44.9%
20.6%
47.7%
6.7%
7.5%
2012
70.0%
43.6%
27.1%
54.3%
2.9%
2.1%
2008
69.6%
44.0%
28.6%
54.5%
1.8%
1.5%
2004
64.3%
42.4%
34.8%
57.0%
0.9%
0.6%
2000
60.7%
43.0%
34.4%
53.4%
4.9%
3.6%
1996
56.9%
44.5%
32.2%
47.2%
11.0%
8.2%
Breakdown of population affiliated with a religious congregation
Type
Adherents
Congregations
Religion
San Jose
Chandler
San Jose
Chandler
CATHOLIC CHURCH
25.1%
13.6%
6.0%
4.3%
MUSLIM ESTIMATE
1.1%
0.2%
1.8%
1.0%
SOUTHERN BAPTIST CONVENTION
0.9%
1.9%
7.7%
6.5%
EPISCOPAL CHURCH
0.5%
0.3%
2.3%
1.3%
SEVENTH DAY ADVENTIST CHURCH
0.4%
0.4%
2.6%
2.0%
EVANGELICAL LUTHERAN CHURCH IN AMERICA
0.3%
0.8%
2.3%
2.0%
LUTHERAN CHURCH
0.2%
0.5%
1.4%
1.5%
VINEYARD USA
0.0%
0.3%
0.1%
0.6%
Weather
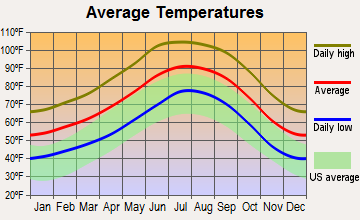
Weather in both cities is quite different: San Jose offers a Mediterranean climate with mild winters and warm summers. Chandler, in contrast, has a desert climate, with hot summers and mild winters. The high summer heat in Chandler might be off-putting to some, while others prefer the consistent warmth and plentiful sunshine.
Weather and climate
Type
San Jose
Chandler
Temperature - Average
60.9°F
71.8°F
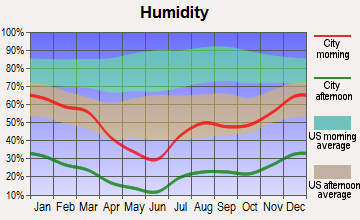
Humidity - Average morning or afternoon humidity
77.3%
37.5%
Humidity - Differences between morning and afternoon humidity
35.5%
48%
Humidity - Maximum monthly morning or afternoon humidity
87%
60%
Humidity - Minimum monthly morning or afternoon humidity
51.6%
12%
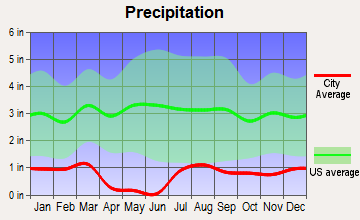
Precipitation - Yearly average
16.1 in
9.1 in
Snowfall - Yearly average
0 in
0 in
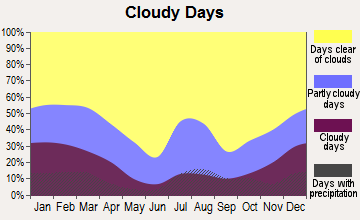
Clouds - Number of days clear of clouds
27.4%
35.3%
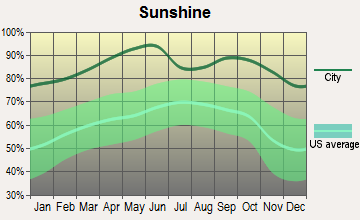
Sunshine amount - Average
73.8%
92.8%
Sunshine amount - Differences during a year
23%
16%
Sunshine amount - Maximum monthly
77.4%
95%
Sunshine amount - Minimum monthly
54.4%
79%
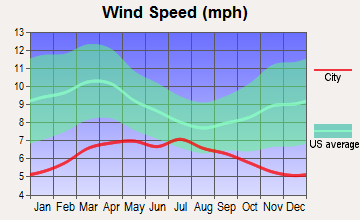
Wind speed - Average
10.3 mph
6.6 mph
Average climate in San Jose, California
Average climate in Chandler, Arizona
Air pollution
Type
AQI
CO
NO2
OZONE
PB
PM10
PM25
SO2
Year
San Jose
Chandler
San Jose
Chandler
San Jose
Chandler
San Jose
Chandler
San Jose
Chandler
San Jose
Chandler
San Jose
Chandler
2018
94
206
0.49
0.29
14.5
15.2
22.2
30.6
0.006
N/A
35.5
N/A
12.5
7.7
0.2
0.6
2017
91
132
0.50
0.36
14.6
15.9
23.5
31.2
0.004
N/A
34.0
N/A
10.2
7.8
0.2
1.4
2016
69
125
0.47
0.34
13.7
15.8
22.4
30.2
0.003
N/A
30.2
N/A
8.8
7.1
0.2
0.4
2015
84
173
0.52
0.39
15.4
17.8
22.3
29.2
0.004
N/A
24.2
N/A
9.2
7.3
0.3
0.9
2014
83
231
0.40
0.44
13.9
19.9
21.5
27.8
0.004
N/A
29.8
N/A
8.2
8.6
0.2
1.1
2013
90
148
0.41
0.32
15.2
20.1
20.8
29.8
0.005
N/A
28.9
N/A
12.4
7.5
0.3
0.9
2012
74
165
0.35
0.36
13.3
21.5
21.8
29.3
0.003
N/A
36.8
N/A
10.1
8.8
0.3
1.3
2011
83
205
0.37
0.32
14.8
19.1
20.6
30.1
0.003
N/A
40.4
N/A
12.3
9.5
0.3
0.9
2010
88
100
0.35
0.42
14.4
17.4
20.4
29.8
0.004
N/A
23.8
N/A
9.0
8.3
0.4
1.2
2009
89
109
0.40
0.40
14.7
17.6
18.2
29.8
0.004
N/A
36.1
N/A
9.3
N/A
0.3
1.1
2008
100
107
0.45
0.36
16.7
18.6
20.6
29.6
N/A
N/A
40.2
N/A
12.6
N/A
N/A
1.3
2007
92
135
0.44
0.38
16.6
20.6
20.0
28.5
0.009
N/A
50.2
N/A
11.1
N/A
N/A
1.9
2006
100
138
0.46
0.46
18.0
23.1
21.8
29.5
N/A
N/A
56.3
N/A
11.1
N/A
N/A
1.9
2005
95
109
0.68
0.56
18.6
23.6
20.0
26.6
N/A
N/A
48.7
N/A
11.6
N/A
N/A
1.8
2004
98
97
0.63
0.56
18.5
23.3
20.4
25.9
N/A
N/A
33.7
N/A
9.9
N/A
N/A
1.4
2003
87
100
0.73
0.58
20.6
24.6
19.1
27.3
N/A
N/A
42.6
N/A
N/A
N/A
N/A
1.4
2002
78
111
0.65
0.66
19.5
25.5
18.0
27.1
0.006
N/A
41.8
N/A
N/A
N/A
N/A
1.6
2001
75
105
0.61
0.68
18.5
24.3
16.8
26.3
0.008
N/A
37.8
N/A
N/A
N/A
N/A
1.5
2000
65
117
0.66
0.69
18.9
29.6
15.6
26.8
0.009
N/A
45.6
N/A
N/A
N/A
N/A
1.7
Natural disasters
Type
San Jose
Chandler
Tornado activity compared to U.S. average
9%
18.5%
Earthquake activity compared to U.S. average
7,785.3%
2,391%
Natural disasters compared to U.S. average
19%
16%
Transportation
San Jose offers a variety of commuting options, from trains and buses to bike lanes. Chandler, in contrast, is predominantly car-dependent, with a less extensive public transit system.
Transport
Type
San Jose
Chandler
Amtrak stations
1
0
Amtrak stations nearby
3
2
FAA registered aircraft
553
438
FAA registered aircraft manufacturers and dealers
13
5
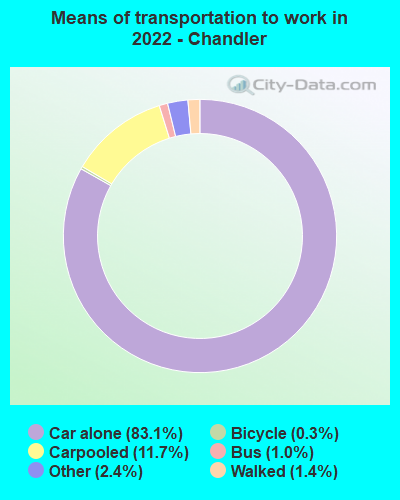
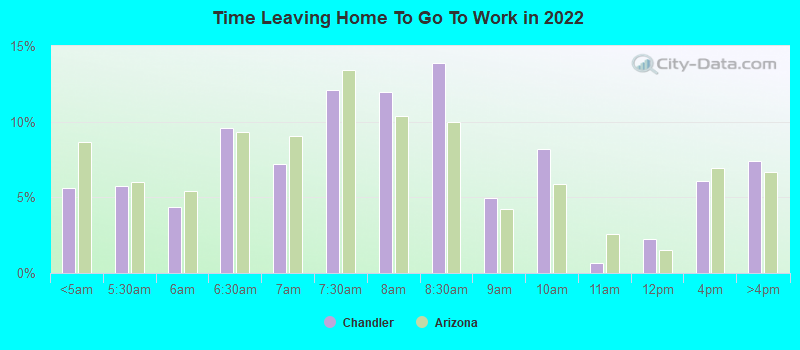
Means of transportation to work
Type
San Jose
Chandler
Bicycle
1%
0.4%
Bus
1.1%
0.3%
Carpooled
11.4%
10.6%
Car alone
80.5%
84.8%
Motorcycle
0.2%
0.5%
Railroad
0.2%
0.1%
Subway
0.2%
0.1%
Walked
3.3%
2.2%
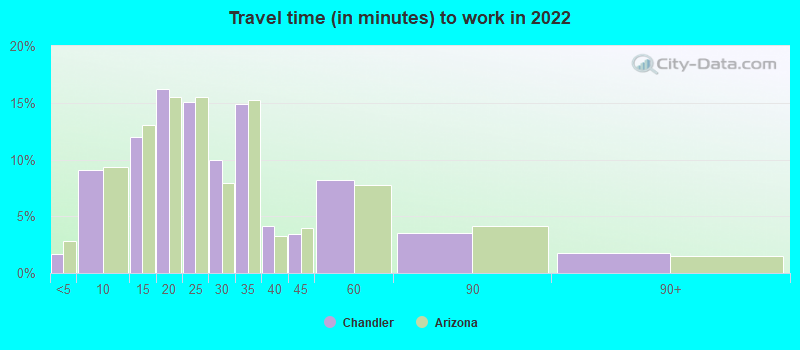
Average travel time to work
Type
San Jose
Chandler
Average
29.2 min
25.7 min
Other means
27.9 min
26.3 min
Public transportation
48.5 min
50.1 min
Private vehicle occupancy
Type
San Jose
Chandler
Average
1.2
1.2
Drove alone
87.3%
89.3%
In 2 person carpool
8.9%
8%
In 3 person carpool
1.9%
1%
In 4 person carpool
1.1%
0.7%
In 5-6 person carpool
0.6%
0.9%
In 7+ person carpool
0.2%
0.1%
How many people usually rode to work in the car, truck or van.
Real Estate
Real estate in San Jose is seen as a good investment due to the tech industry's impact. However, homes in Chandler are significantly more affordable, making it a more attainable market for many families.
Neighborhoods
San Jose boasts a diverse range of neighborhoods from the upscale Willow Glen and Silver Creek to the more affordable East San Jose. Chandler offers a mix of family-friendly suburban neighborhoods like Ocotillo and Downtown Chandler, which offers a more urban lifestyle.
Houses and residents
Type
San Jose
Chandler
Houses
340,561
112,136
Average household size (people)
3.1
2.7
Median year apartment built
1979
1997
Median year house/condo built
1973
1997
Length of stay in the house since moving in
15.6 years
10.6 years
Houses occupied
322,881 (94.8%)
107,668 (96%)
Houses occupied by owners
179,797 (55.7%)
71,036 (66%)
Houses occupied by renters
143,084 (44.3%)
36,632 (34%)
Median rent asked for vacant for-rent units
$3,214
$2,338
Median monthly housing costs
$2,463
$1,573
Median price asked for vacant for-sale houses and condos
$1,197,016
$461,127
Estimated median house or condo value
Over $1,000,000
$435,100
Median numbers of rooms
4.9
5.5
Median number of rooms in apartments
3.6
4.2
Median number of rooms in houses and condos
6
6.3
Median house price - detached houses
Over $1,000,000
$493,497
Median house price - in 2-unit structures
$753,788
$583,625
Median house price - in 3-to-4-unit structures
$680,453
$260,715
Median house price - in 5 or more unit structures
$688,625
$287,805
Median house price - mobile homes
$240,963
$81,606
Median house price - occupied boats, rvs, vans etc.
$55,872
$36,427
Median house price - Townhouses or other attached units
$892,629
$316,438
Median house price - All housing units
Over $1,000,000
$471,395
Median house age
45
24
Renting percentage
41.5%
33.7%
Housing density (houses/condos per square mile)
1,947.6
1,937.2
House value disparities
21.2%
22.8%
Household income disparities
38.3%
38.9%
Median household income for houses/condes with a mortgage
$197,583
$122,158
Median household income for apartments without a mortgage
$103,711
$78,975
Housing units without a mortgage
2,632 (2.1%)
907 (1.6%)
Housing units with both a second mortgage and home equity loan
13,499 (10.6%)
3,763 (6.8%)
Housing units with a mortgage
124,224 (97.9%)
54,712 (98.4%)
Housing units with a home equity loan
346 (0.3%)
0 (0%)
Housing units with a second mortgage
16,249 (12.8%)
4,390 (7.9%)
House/condo owner moved in on average (years ago)
14
8
House/condo renter moved in on average (years ago)
3
1
Housing units lacking complete kitchen facilities
1.2%
1.1%
Housing units lacking complete plumbing facilities
0.6%
0.4%
Housing units in structures
Housing units in structures
San Jose
Chandler
One, detached
50.9%
68.7%
One, attached
11.5%
5.5%
Two
1.1%
1.2%
3 or 4
5.0%
4.5%
5 to 9
5.1%
4.7%
10 to 19
4.5%
4.8%
20 to 49
4.5%
1.8%
50 or more
14.2%
7.5%
Mobile homes
3.1%
1.3%
Boats, RVs, vans, etc.
0.1%
0.0%
Median real estate property taxes paid for housing units
Self-employed workers in own not incorporated business
28,517
8,781
State government workers
10,222
4,501
Unpaid family workers
472
180
Industries and Occupations
In San Jose, the dominant industries are technology, software services, and international trade. Chandler's economy revolves around manufacturing, finance, health care, and retail trade.
San Jose is known for high-quality healthcare services, including the renowned Stanford Health Care. Chandler also boasts reputable healthcare facilities, such as Chandler Regional Medical Center.
Health (county statistics)
Type
San Jose
Chandler
General health status score of residents in this county from 1 (poor) to 5 (excellent)
Both cities have well-developed infrastructures, but San Jose has more public transportation options, including trains, trams, buses, and bike lanes. Chandler, meanwhile, is a car-dependent city with fewer public transportation options.
Infrastructure
Type
San Jose
Chandler
Hospitals
20
2
TV stations
9
20
Bank branches located here
145
59
Bank institutions located here
25
20
Main business address for public companies
74
1
Drinking water stations with no reported violations in the past
21
1
Drinking water stations with reported violations in the past
HMDA - Conventional home purchase loans - Applications denied
Year
San Jose
Chandler
1999
3,839
879
2000
2,577
790
2001
1,953
513
2002
1,908
487
2003
3,578
854
2004
5,489
1,296
2005
6,994
1,916
2006
6,324
1,705
2007
4,298
949
2008
2,419
374
2009
1,631
249
Culture and Food
San Jose offers a rich cultural scene and diverse food offerings, with influences from various international cuisines. Chandler's food scene is dominated by American, Mexican, and some Asian cuisines and has a lively arts and culture scene.
Sports Teams
San Jose has various pro sports teams, including the NHL's San Jose Sharks and MLS's San Jose Earthquakes. While Chandler does not have its own sports teams, it’s located near Phoenix, home to teams like the Phoenix Suns(NBA) and the Arizona Cardinals(NFL).


 San Jose, CA
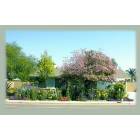
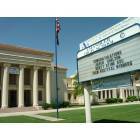
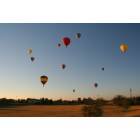
 Chandler, AZ