Both San Jose, the largest city in the Silicon Valley, and Irvine, a city in Orange County, California, offer unique benefits for residents and tourists. San Jose's vibrant tech influx and rich cultural history collide, creating a dynamic, diverse landscape. Irvine, on the other hand, is a master-planned city known for its high standard of living, safety, and premier schools. Comparing these cities entails exploring aspects such as crime/safety, weather, cost of living, education, and many more.
Distance between
San Jose, CA and
Irvine, CA : 339.4 miles
San Jose's population is larger by 218%. Its population has grown by 88,546 people (9.9%) since 2000. The population of Irvine has grown by 165,959 people (116.0%) during that time.
Irvine is renowned for its lower crime rates, regularly earning the title of America's Safest City. San Jose, a bigger metropolitan city, has a slightly higher crime rate, but still remains relatively safe compared to other US cities of similar scale. Both cities have vigilant local law enforcement agencies and community safety initiatives.
City-data.com crime index counts serious crimes and violent crime more heavily. It adjusts for the number of visitors and daily workers commuting into cities. (higher means more crime, U.S. average = 301.1)
City-data.com crime index counts serious crimes and violent crime more heavily. It adjusts for the number of visitors and daily workers commuting into cities. (higher means more crime, U.S. average = 301.1)
Sex Offenders
According to our data, there are 1,806 registered sex offenders living in San Jose and 44 registered sex offenders living in . The ratio of residents to sex offenders in San Jose is 568 to 1; the ratio in Irvine is 6,048 to 1. The number of registered sex offenders compared to the number of residents is much larger in San Jose than that in Irvine.
Cost of Living
San Jose, being a major hub in the tech-heavy Silicon Valley, has a higher cost of living, especially in housing. Irvine also has a high cost of living, but somewhat less than San Jose due to lower housing costs. Both cities have higher costs of goods and services compared to the national average, aligning with California's general higher living cost.
Income Tax
Both cities fall under California's state income tax, which is built on a progressive structure with rates ranging from 1% to 13.3%. There are no separate city income taxes.
Property Tax
California's average property tax rate is 0.73%, and this rate applies to both cities. Property taxes vary based on the assessed value of the home.
Sales Tax
In terms of sales tax, as of 2021, San Jose has a rate of 9.25% and Irvine has a slightly lower rate of 7.75%. Both rates are influenced by the California base state sales tax of 7.25%.
Income
Type
San Jose
Irvine
Estimated median household income
$126,377
$105,774
Estimated per capita income
$57,357
$54,053
Cost of living index (U.S. average is 100)
127.4
89.8
If you make $50,000 in Irvine, you will have to make $70,935 in San Jose to maintain the same standard of living.
Geographical Conditions
San Jose is situated in the Santa Clara Valley, surrounded by rolling hills and the San Francisco Bay. Irvine is a flat city and closer to the coastline, benefiting from the Pacific Ocean's cooling effects.
Education is a stand-out feature in both cities. Irvine is known for its top-rated schools and is home to the University of California Irvine (UCI). San Jose also boasts highly rated K-12 schools and houses prestigious higher education institutions, including San Jose State University (SJSU) and a campus for the University of California.
San Jose is at the heart of Silicon Valley, making it a top player in the tech industry, while Irvine has a diversified economy with a significant presence of technology, education, and health sectors. Both cities have strong job markets, although San Jose's tech emphasis leads to slightly higher average salaries.
Biggest Employers
San Jose's largest employers are tech giants like Cisco Systems, eBay, and Adobe Systems. For Irvine, the biggest employers are UCI, Blizzard Entertainment, and Broadcom Corporation - a mix of education and tech.
There were 299 building permits issued in San Jose in 2012 (216 more than in 2011) compared to 1,129 building permits issued in Irvine in 2012 (272 more than in 2011).
In San Jose (Santa Clara County), 70.0% voted for Democrats and 27.1% for Republicans in 2012 Presidential Election. In Irvine (Orange County), 45.8% voted for Democrats and 52.0% for Republicans.
Elections
Type
Democrats
Republicans
Other
Year
San Jose
Irvine
San Jose
Irvine
San Jose
Irvine
2020
72.7%
53.6%
25.2%
44.6%
2.1%
1.8%
2016
72.7%
50.9%
20.6%
42.4%
6.7%
6.7%
2012
70.0%
45.8%
27.1%
52.0%
2.9%
2.3%
2008
69.6%
47.8%
28.6%
50.3%
1.8%
1.9%
2004
64.3%
39.3%
34.8%
60.2%
0.9%
0.5%
2000
60.7%
40.4%
34.4%
55.9%
4.9%
3.7%
1996
56.9%
37.9%
32.2%
51.7%
11.0%
10.5%
Breakdown of population affiliated with a religious congregation
Type
Adherents
Congregations
Religion
San Jose
Irvine
San Jose
Irvine
CATHOLIC CHURCH
25.1%
26.5%
6.0%
4.4%
MUSLIM ESTIMATE
1.1%
0.8%
1.8%
1.3%
SOUTHERN BAPTIST CONVENTION
0.9%
2.3%
7.7%
8.8%
EPISCOPAL CHURCH
0.5%
0.4%
2.3%
1.4%
SEVENTH DAY ADVENTIST CHURCH
0.4%
0.4%
2.6%
1.3%
EVANGELICAL LUTHERAN CHURCH IN AMERICA
0.3%
0.4%
2.3%
2.3%
LUTHERAN CHURCH
0.2%
0.6%
1.4%
2.0%
REFORMED CHURCH IN AMERICA
0.1%
0.3%
0.2%
0.2%
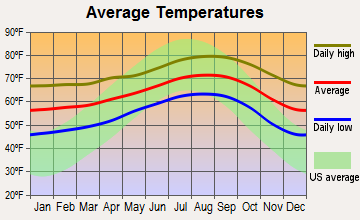
Weather
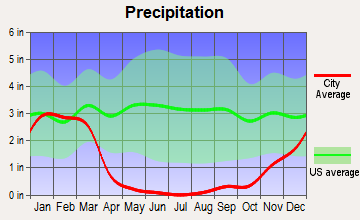
Both cities have a Mediterranean climate. However, Irvine, situated closer to the coastline, has more mild temperatures year-round, while San Jose can experience hotter summers and colder winters. Both cities receive minimal snowfall, if any, and heavy rainfall is uncommon.
Weather and climate
Type
San Jose
Irvine
Temperature - Average
60.9°F
63.6°F
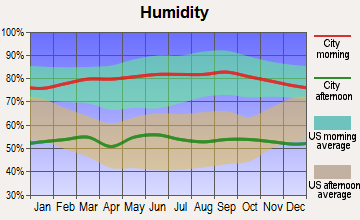
Humidity - Average morning or afternoon humidity
77.3%
69.5%
Humidity - Differences between morning and afternoon humidity
35.5%
25.7%
Humidity - Maximum monthly morning or afternoon humidity
87%
77.7%
Humidity - Minimum monthly morning or afternoon humidity
51.6%
52%
Precipitation - Yearly average
16.1 in
13.1 in
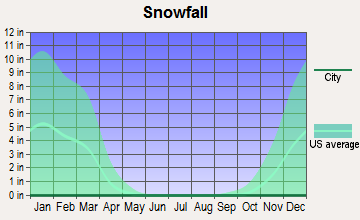
Snowfall - Yearly average
0 in
0 in
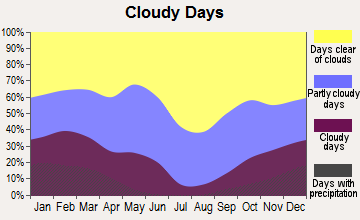
Clouds - Number of days clear of clouds
27.4%
26.6%
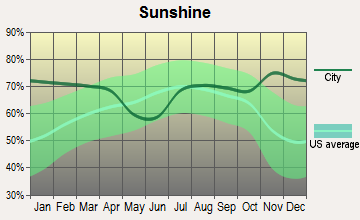
Sunshine amount - Average
73.8%
78.3%
Sunshine amount - Differences during a year
23%
21.7%
Sunshine amount - Maximum monthly
77.4%
84.4%
Sunshine amount - Minimum monthly
54.4%
62.7%
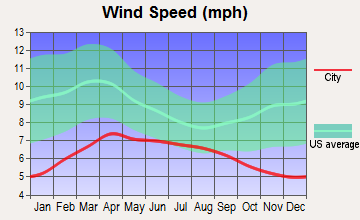
Wind speed - Average
10.3 mph
5.7 mph
Average climate in San Jose, California
Average climate in Irvine, California
Air pollution
Type
AQI
CO
NO2
OZONE
PB
PM10
PM25
SO2
Year
San Jose
Irvine
San Jose
Irvine
San Jose
Irvine
San Jose
Irvine
San Jose
Irvine
Irvine
San Jose
Irvine
San Jose
Irvine
2018
94
119
0.49
0.25
14.5
13.5
22.2
31.5
0.006
N/A
27.5
N/A
12.5
12.5
0.2
N/A
2017
91
116
0.50
0.27
14.6
13.1
23.5
32.5
0.004
N/A
26.7
N/A
10.2
13.7
0.2
N/A
2016
69
102
0.47
0.24
13.7
11.6
22.4
31.6
0.003
N/A
24.1
N/A
8.8
12.6
0.2
0.1
2015
84
104
0.52
0.21
15.4
12.6
22.3
31.3
0.004
N/A
25.0
N/A
9.2
14.6
0.3
0.1
2014
83
109
0.40
0.20
13.9
12.3
21.5
30.1
0.004
N/A
26.7
N/A
8.2
15.8
0.2
0.3
2013
90
107
0.41
0.25
15.2
13.1
20.8
28.8
0.005
0.003
29.2
N/A
12.4
14.1
0.3
0.2
2012
74
103
0.35
0.28
13.3
12.1
21.8
28.1
0.003
0.004
27.9
N/A
10.1
14.4
0.3
0.1
2011
83
109
0.37
0.24
14.8
13.8
20.6
28.6
0.003
0.006
27.6
N/A
12.3
15.9
0.3
0.3
2010
88
102
0.35
0.27
14.4
13.4
20.4
28.4
0.004
0.011
23.6
N/A
9.0
14.3
0.4
0.6
2009
89
118
0.40
0.26
14.7
15.3
18.2
29.3
0.004
0.009
24.3
N/A
9.3
14.7
0.3
1.1
2008
100
124
0.45
0.33
16.7
16.0
20.6
29.8
N/A
0.008
29.7
N/A
12.6
21.6
N/A
1.1
2007
92
100
0.44
0.31
16.6
15.9
20.0
28.6
0.009
0.010
N/A
N/A
11.1
N/A
N/A
0.8
2006
100
109
0.46
0.36
18.0
16.7
21.8
28.1
N/A
0.005
N/A
N/A
11.1
N/A
N/A
1.3
2005
95
91
0.68
0.35
18.6
17.0
20.0
28.8
N/A
0.011
N/A
N/A
11.6
N/A
N/A
1.3
2004
98
118
0.63
0.42
18.5
18.3
20.4
31.8
N/A
0.012
N/A
N/A
9.9
N/A
N/A
1.6
2003
87
116
0.73
0.53
20.6
21.1
19.1
29.9
N/A
0.046
N/A
N/A
N/A
N/A
N/A
1.1
2002
78
103
0.65
0.54
19.5
20.7
18.0
26.5
0.006
0.010
N/A
N/A
N/A
N/A
N/A
1.6
2001
75
109
0.61
0.65
18.5
20.7
16.8
26.5
0.008
0.011
N/A
N/A
N/A
N/A
N/A
1.4
2000
65
116
0.66
0.67
18.9
23.6
15.6
24.1
0.009
0.016
N/A
N/A
N/A
N/A
N/A
1.9
Natural disasters
Type
San Jose
Irvine
Tornado activity compared to U.S. average
9%
18.7%
Earthquake activity compared to U.S. average
7,785.3%
6,900.9%
Natural disasters compared to U.S. average
19%
32%
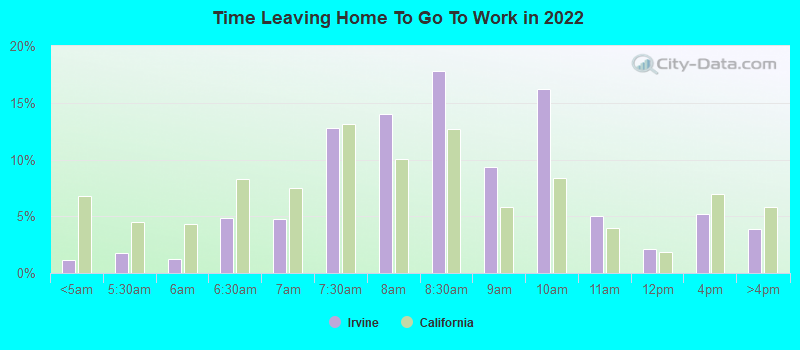
Transportation
Both cities have strong public transportation systems. San Jose has the VTA bus system, light rail, and Caltrain for commuting to other Bay Area locations, while Irvine offers the OCTA bus service and Metrolink train service. Both cities are serviced by major airports.
Transport
Type
San Jose
Irvine
Amtrak stations
1
1
Amtrak stations nearby
3
3
FAA registered aircraft
553
173
FAA registered aircraft manufacturers and dealers
13
2
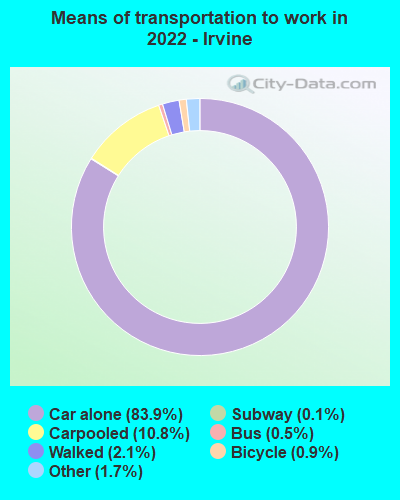
Means of transportation to work
Type
San Jose
Irvine
Bicycle
1%
1.2%
Bus
1.1%
0.2%
Carpooled
11.4%
9.5%
Car alone
80.5%
84.4%
Motorcycle
0.2%
0.2%
Railroad
0.2%
0.1%
Subway
0.2%
0.1%
Walked
3.3%
2.2%
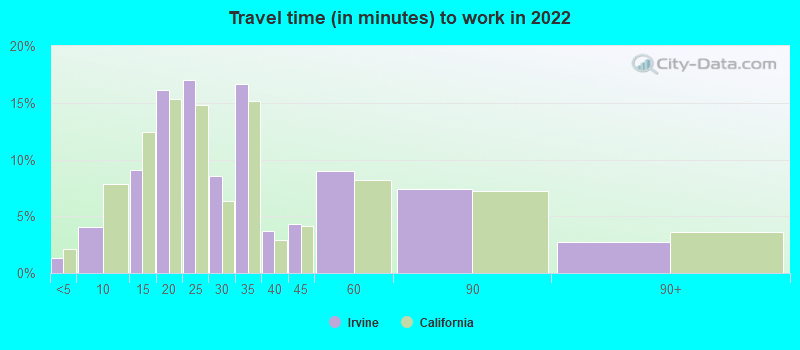
Average travel time to work
Type
San Jose
Irvine
Average
29.2 min
30.7 min
Other means
27.9 min
23.7 min
Public transportation
48.5 min
42.7 min
Private vehicle occupancy
Type
San Jose
Irvine
Average
1.2
1.1
Drove alone
87.3%
90.2%
In 2 person carpool
8.9%
7.8%
In 3 person carpool
1.9%
1.2%
In 4 person carpool
1.1%
0.4%
In 5-6 person carpool
0.6%
0.3%
In 7+ person carpool
0.2%
0.1%
How many people usually rode to work in the car, truck or van.
Real Estate
Real estate prices are high in both cities, influenced by California's booming housing market. San Jose's prices are generally higher, but both cities offer a range of options from high-end luxury homes to more affordable suburban developments.
Neighborhoods
San Jose's diverse neighborhoods range from historic areas like Japantown and the Rose Garden to upscale regions like Silver Creek Valley. Irvine is known for its master-planned neighborhoods - each with amenities like shopping centers, schools, and parks within close reach.
Houses and residents
Type
San Jose
Irvine
Houses
340,561
122,260
Average household size (people)
3.1
2.6
Median year apartment built
1979
2000
Median year house/condo built
1973
1996
Length of stay in the house since moving in
15.6 years
11.4 years
Houses occupied
322,881 (94.8%)
111,648 (91.3%)
Houses occupied by owners
179,797 (55.7%)
49,861 (44.7%)
Houses occupied by renters
143,084 (44.3%)
61,787 (55.3%)
Median rent asked for vacant for-rent units
$3,214
$3,151
Median monthly housing costs
$2,463
$2,500
Median price asked for vacant for-sale houses and condos
$1,197,016
$948,000
Estimated median house or condo value
Over $1,000,000
$970,500
Median numbers of rooms
4.9
4.5
Median number of rooms in apartments
3.6
3.8
Median number of rooms in houses and condos
6
5.9
Median house price - detached houses
Over $1,000,000
Over $1,000,000
Median house price - in 2-unit structures
$753,788
$860,411
Median house price - in 3-to-4-unit structures
$680,453
$621,769
Median house price - in 5 or more unit structures
$688,625
$678,675
Median house price - mobile homes
$240,963
$398,841
Median house price - Townhouses or other attached units
$892,629
$825,112
Median house price - All housing units
Over $1,000,000
Over $1,000,000
Median house age
45
21
Renting percentage
41.5%
49.8%
Housing density (houses/condos per square mile)
1,947.6
2,647.3
House value disparities
21.2%
18.8%
Household income disparities
38.3%
41.8%
Median household income for houses/condes with a mortgage
$197,583
$185,171
Median household income for apartments without a mortgage
$103,711
$97,123
Housing units without a mortgage
2,632 (2.1%)
316 (1%)
Housing units with both a second mortgage and home equity loan
13,499 (10.6%)
2,738 (8.4%)
Housing units with a mortgage
124,224 (97.9%)
32,261 (99%)
Housing units with a home equity loan
346 (0.3%)
0 (0%)
Housing units with a second mortgage
16,249 (12.8%)
3,066 (9.4%)
House/condo owner moved in on average (years ago)
14
8
House/condo renter moved in on average (years ago)
3
1
Housing units lacking complete kitchen facilities
1.2%
2.2%
Housing units lacking complete plumbing facilities
0.6%
0.1%
Housing units in structures
Housing units in structures
San Jose
Irvine
One, detached
50.9%
37.3%
One, attached
11.5%
20.1%
Two
1.1%
1.1%
3 or 4
5.0%
4.5%
5 to 9
5.1%
5.9%
10 to 19
4.5%
5.1%
20 to 49
4.5%
5.0%
50 or more
14.2%
20.0%
Mobile homes
3.1%
0.8%
Boats, RVs, vans, etc.
0.1%
0.1%
Median real estate property taxes paid for housing units
Self-employed workers in own not incorporated business
28,517
9,200
State government workers
10,222
9,735
Unpaid family workers
472
399
Industries and Occupations
While both cities have strong professionals, technical, and managerial sectors, San Jose leans heavily towards occupations in the tech industry. Irvine, with its strong education and medical sectors, offers more diversity in occupations, including academia and health care emphases.
Both cities offer high-quality healthcare services. San Jose is home to reputed hospitals like the Santa Clara Valley Medical Center, while Irvine has the UCI Medical Center and multiple well-rated hospitals within and nearby.
Health (county statistics)
Type
San Jose
Irvine
General health status score of residents in this county from 1 (poor) to 5 (excellent)
In terms of infrastructure, both cities are highly modernized. San Jose, being larger, has a denser public infrastructure including a multitude of parks, libraries, and community centers. Irvine, though smaller, is well-planned with a large number of parks, open spaces, and a balanced commercial-residential layout.
Infrastructure
Type
San Jose
Irvine
Hospitals
20
4
TV stations
9
2
Arenas or stadiums
2
1
Bank branches located here
145
98
Bank institutions located here
25
47
Main business address for public companies
74
65
Nuclear power plants nearby
0
2
Drinking water stations with no reported violations in the past
21
0
Drinking water stations with reported violations in the past
HMDA - Conventional home purchase loans - Applications denied
Year
San Jose
Irvine
1999
3,839
704
2000
2,577
417
2001
1,953
271
2002
1,908
242
2003
3,578
609
2004
5,489
835
2005
6,994
899
2006
6,324
897
2007
4,298
576
2008
2,419
344
2009
1,631
210
Culture and Food
Both cities have vibrant cultural scenes. San Jose, ethnically diverse, boasts various cultural events and a broad range of international cuisine. Irvine also values multiculturalism, hosting cultural festivals and sporting diverse eateries, emphasizing Asian and Middle Eastern cuisine.
Sports Teams
San Jose holds several professional teams, including the San Jose Sharks (NHL), and the Earthquakes (MLS). Irvine, while not having major professional sports teams itself, is near Anaheim and Los Angeles, which host a variety of sports teams.


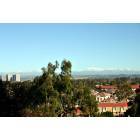


 San Jose, CA
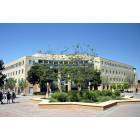
 Irvine, CA