San Jose, California, and Paradise, Nevada, are diverse and thriving regions each offering different attractions and qualities of life. San Jose, located in Silicon Valley, is known for its booming tech industry, sunny weather, and high cost of living. Paradise, Nevada, on the other hand, encompasses most of the Las Vegas Strip, boasting top-notch entertainment, gambling, and night life. Both cities offer unique living experiences, attracting tourists and residents alike.
Distance between
San Jose, CA and
Paradise, NV : 383.2 miles
San Jose's population is larger by 429%. Its population has grown by 88,546 people (9.9%) since 2000. The population of Paradise has decreased by 221 people (0.1%) during that time.
Both San Jose and Paradise experience higher crime rates than the US average, with Paradise having significantly higher rates largely due to its bustling tourist industry. However, San Jose's safety index is better than Paradise's. Specific neighborhoods in both locations vary in crime rates, and it's advisable to research these areas thoroughly. Despite these statistics, many residents and visitors feel safe in both cities, especially in well-trafficked areas during the day.
Cost of Living
San Jose is one of the most expensive cities in the US, significantly higher than the national average, primarily due to its housing costs. Paradise's cost of living is lower than San Jose's, but slightly higher than the national average. The main contributing factor in Paradise is entertainment and food costs with the prevalent tourist activities.
Income Tax
California's income tax rates are among the highest in the nation, affecting San Jose residents. On the other hand, Nevada, and by extension Paradise, has no state income tax, marking a significant difference between the two locations.
Property Tax
While homes in San Jose are more expensive, California’s effective property tax rate is lower. Nevada’s effective property tax rate is higher, but due to lower property values, the overall property tax burden may be less in Paradise.
Sales Tax
San Jose, situated in California, imposes a higher sales tax rate than Paradise, Nevada. Those planning a move or running a business may want to consider tax implications in their plans.
Income
Type
San Jose
Paradise
Estimated median household income
$126,377
$50,096
Estimated per capita income
$57,357
$28,275
Cost of living index (U.S. average is 100)
127.4
99.3
If you make $50,000 in Paradise, you will have to make $64,149 in San Jose to maintain the same standard of living.
Geographical Conditions
San Jose resides in a valley surrounded by rolling hills in Northern California. With proximity to both beaches and mountains, outdoor activities are abundantly available. Paradise is situated in the arid Mojave Desert, offering a stark yet compelling landscape.
San Jose is home to many highly ranked schools and prestigious institutions like San Jose State University and branches of University of California. Paradise, while not housing many institutions of its own, is close to the educational resources of Las Vegas, including the University of Nevada, Las Vegas.
San Jose's economy is driven by the tech industry with many tech giants based in and around the city. Paradise's economy, in contrast, is primarily driven by the entertainment and hospitality industries due to the popular Las Vegas Strip.
Biggest Employers
Some of the biggest employers in San Jose include Apple, Google, and Cisco Systems. In Paradise, top employers include MGM Resorts and Caesars Entertainment.
In San Jose (Santa Clara County), 70.0% voted for Democrats and 27.1% for Republicans in 2012 Presidential Election. In Paradise (Clark County), 56.4% voted for Democrats and 41.8% for Republicans.
Elections
Type
Democrats
Republicans
Other
Year
San Jose
Paradise
San Jose
Paradise
San Jose
Paradise
2020
72.7%
53.7%
25.2%
44.3%
2.1%
2.0%
2016
72.7%
52.4%
20.6%
41.7%
6.7%
5.8%
2012
70.0%
56.4%
27.1%
41.8%
2.9%
1.8%
2008
69.6%
58.5%
28.6%
39.5%
1.8%
2.0%
2004
64.3%
51.8%
34.8%
46.9%
0.9%
1.3%
2000
60.7%
51.4%
34.4%
44.8%
4.9%
3.8%
1996
56.9%
75.5%
32.2%
18.8%
11.0%
5.7%
Breakdown of population affiliated with a religious congregation
Type
Adherents
Congregations
Religion
San Jose
Paradise
San Jose
Paradise
CATHOLIC CHURCH
25.1%
18.1%
6.0%
4.0%
MUSLIM ESTIMATE
1.1%
0.1%
1.8%
0.6%
SOUTHERN BAPTIST CONVENTION
0.9%
1.6%
7.7%
11.2%
EPISCOPAL CHURCH
0.5%
0.1%
2.3%
1.1%
SEVENTH DAY ADVENTIST CHURCH
0.4%
0.2%
2.6%
1.6%
EVANGELICAL LUTHERAN CHURCH IN AMERICA
0.3%
0.4%
2.3%
1.6%
Weather
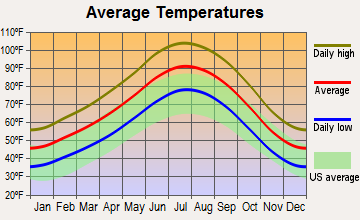
San Jose experiences a Mediterranean climate with warm, dry summers and mild, wet winters. Paradise, on the other hand, presents a Mojave Desert climate, characterized by very hot summers and relatively mild winters. Both cities enjoy plenty of sunshine round the year, making outdoor activities a popular pastime.
Weather and climate
Type
San Jose
Paradise
Temperature - Average
60.9°F
68°F
Humidity - Average morning or afternoon humidity
77.3%
30.7%
Humidity - Differences between morning and afternoon humidity
35.5%
42%
Humidity - Maximum monthly morning or afternoon humidity
87%
52%
Humidity - Minimum monthly morning or afternoon humidity
51.6%
10%
Precipitation - Yearly average
16.1 in
4.6 in
Snowfall - Yearly average
0 in
1.6 in
Clouds - Number of days clear of clouds
27.4%
35.1%
Sunshine amount - Average
73.8%
91.8%
Sunshine amount - Differences during a year
23%
16%
Sunshine amount - Maximum monthly
77.4%
92%
Sunshine amount - Minimum monthly
54.4%
76%
Wind speed - Average
10.3 mph
9.2 mph
Average climate in San Jose, California
Average climate in Paradise, Nevada
Air pollution
Type
AQI
CO
NO2
OZONE
PB
PM10
PM25
SO2
Year
San Jose
Paradise
San Jose
Paradise
San Jose
Paradise
San Jose
Paradise
San Jose
Paradise
San Jose
Paradise
San Jose
Paradise
2018
94
102
0.49
0.42
14.5
15.6
22.2
34.6
0.006
N/A
29.8
N/A
12.5
7.6
0.2
0.7
2017
91
102
0.50
0.34
14.6
16.0
23.5
33.0
0.004
N/A
23.5
N/A
10.2
7.1
0.2
0.8
2016
69
107
0.47
0.39
13.7
14.1
22.4
32.2
0.003
N/A
24.0
N/A
8.8
8.1
0.2
0.8
2015
84
92
0.52
0.40
15.4
14.6
22.3
31.3
0.004
N/A
22.1
N/A
9.2
8.4
0.3
1.2
2014
83
92
0.40
0.42
13.9
12.8
21.5
29.9
0.004
N/A
25.1
N/A
8.2
9.0
0.2
1.4
2013
90
103
0.41
0.43
15.2
12.7
20.8
30.9
0.005
N/A
24.5
N/A
12.4
7.9
0.3
1.5
2012
74
96
0.35
0.47
13.3
6.6
21.8
32.8
0.003
N/A
25.6
N/A
10.1
7.4
0.3
1.4
2011
83
85
0.37
0.45
14.8
5.3
20.6
32.2
0.003
N/A
19.8
N/A
12.3
6.6
0.3
1.2
2010
88
83
0.35
0.50
14.4
5.7
20.4
31.8
0.004
N/A
17.4
N/A
9.0
6.1
0.4
N/A
2009
89
87
0.40
0.57
14.7
6.0
18.2
30.0
0.004
N/A
22.8
N/A
9.3
7.2
0.3
N/A
2008
100
83
0.45
0.61
16.7
8.2
20.6
29.3
N/A
N/A
N/A
N/A
12.6
7.5
N/A
N/A
2007
92
98
0.44
0.51
16.6
14.0
20.0
27.7
0.009
N/A
N/A
N/A
11.1
7.4
N/A
0.1
2006
100
102
0.46
0.69
18.0
16.4
21.8
29.6
N/A
N/A
N/A
N/A
11.1
8.4
N/A
0.8
2005
95
102
0.68
0.72
18.6
17.7
20.0
27.9
N/A
N/A
N/A
N/A
11.6
8.3
N/A
5.3
2004
98
88
0.63
0.71
18.5
17.6
20.4
28.8
N/A
N/A
N/A
N/A
9.9
N/A
N/A
1.6
2003
87
100
0.73
0.63
20.6
18.5
19.1
28.3
N/A
N/A
N/A
N/A
N/A
N/A
N/A
0.9
2002
78
96
0.65
0.58
19.5
18.1
18.0
28.0
0.006
N/A
N/A
N/A
N/A
N/A
N/A
0.7
2001
75
96
0.61
0.63
18.5
18.9
16.8
26.9
0.008
N/A
N/A
N/A
N/A
N/A
N/A
1.0
2000
65
96
0.66
0.73
18.9
18.1
15.6
27.0
0.009
N/A
N/A
N/A
N/A
N/A
N/A
0.4
Natural disasters
Type
San Jose
Paradise
Tornado activity compared to U.S. average
9%
2.3%
Earthquake activity compared to U.S. average
7,785.3%
6,005.3%
Natural disasters compared to U.S. average
19%
12%
Transportation
Public transportation is more extensive in San Jose with the VTA providing bus and light rail services. Paradise relies heavily on monorails, buses, and taxis, especially along the Las Vegas Strip, but doesn't match San Jose in regard to commuter-friendly transit.
Transport
Type
San Jose
Paradise
Amtrak stations
1
0
Amtrak stations nearby
3
1
FAA registered aircraft
553
0
FAA registered aircraft manufacturers and dealers
13
0
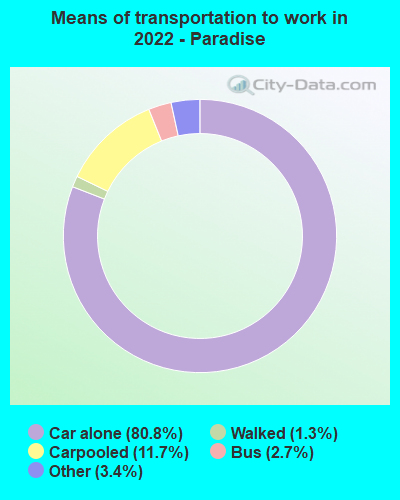
Means of transportation to work
Type
San Jose
Paradise
Bicycle
1%
0.3%
Bus
1.1%
2.3%
Carpooled
11.4%
11.5%
Car alone
80.5%
82.3%
Motorcycle
0.2%
0.3%
Railroad
0.2%
0%
Subway
0.2%
0%
Taxicab
0%
0.2%
Walked
3.3%
1.1%
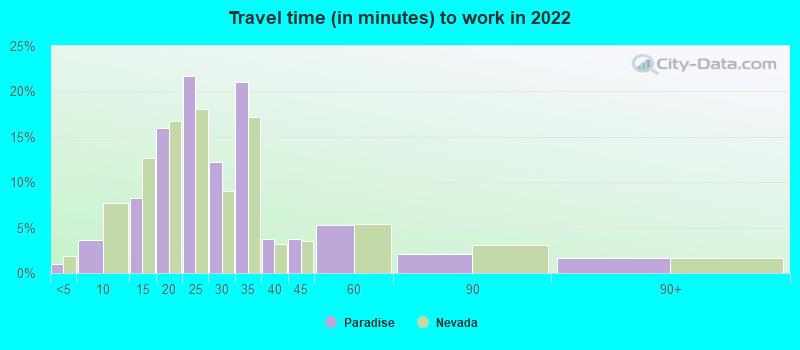
Average travel time to work
Type
San Jose
Paradise
Average
29.2 min
27.5 min
Other means
27.9 min
20.4 min
Public transportation
48.5 min
43.9 min
Private vehicle occupancy
Type
San Jose
Paradise
Average
1.2
1.2
Drove alone
87.3%
84.5%
In 2 person carpool
8.9%
13.8%
In 3 person carpool
1.9%
0.8%
In 4 person carpool
1.1%
0.4%
In 5-6 person carpool
0.6%
0.4%
In 7+ person carpool
0.2%
0.1%
How many people usually rode to work in the car, truck or van.
Real Estate
Real estate in San Jose is significantly more expensive than in Paradise due to its prime Silicon Valley location. Paradise offers far more affordable housing, albeit with pricing variability due to proximity to tourist hotspots.
Neighborhoods
San Jose is a blend of peaceful residential areas and bustling downtown hotspots. Paradise is typically divided into residential areas and tourist-attraction areas like the Las Vegas Strip.
Houses and residents
Type
San Jose
Paradise
Houses
340,561
95,898
Average household size (people)
3.1
2.5
Median year apartment built
1979
1984
Median year house/condo built
1973
1985
Length of stay in the house since moving in
15.6 years
11.6 years
Houses occupied
322,881 (94.8%)
78,005 (81.3%)
Houses occupied by owners
179,797 (55.7%)
33,900 (43.5%)
Houses occupied by renters
143,084 (44.3%)
44,105 (56.5%)
Median rent asked for vacant for-rent units
$3,214
$4,622
Median monthly housing costs
$2,463
$1,126
Median price asked for vacant for-sale houses and condos
$1,197,016
$238,007
Estimated median house or condo value
Over $1,000,000
$334,500
Median numbers of rooms
4.9
4.2
Median number of rooms in apartments
3.6
3.6
Median number of rooms in houses and condos
6
6.1
Median house price - detached houses
Over $1,000,000
$376,914
Median house price - in 2-unit structures
$753,788
$134,611
Median house price - in 3-to-4-unit structures
$680,453
$160,124
Median house price - in 5 or more unit structures
$688,625
$488,432
Median house price - mobile homes
$240,963
$56,551
Median house price - Townhouses or other attached units
$892,629
$247,245
Median house price - All housing units
Over $1,000,000
$351,599
Median house age
45
34
Renting percentage
41.5%
56.8%
Housing density (houses/condos per square mile)
1,947.6
2,034.4
House value disparities
21.2%
28.9%
Household income disparities
38.3%
46.6%
Median household income for houses/condes with a mortgage
$197,583
$80,528
Median household income for apartments without a mortgage
$103,711
$61,867
Housing units without a mortgage
2,632 (2.1%)
463 (2%)
Housing units with both a second mortgage and home equity loan
13,499 (10.6%)
800 (3.4%)
Housing units with a mortgage
124,224 (97.9%)
23,132 (98%)
Housing units with a home equity loan
346 (0.3%)
0 (0%)
Housing units with a second mortgage
16,249 (12.8%)
1,130 (4.8%)
House/condo owner moved in on average (years ago)
14
9
House/condo renter moved in on average (years ago)
3
1
Housing units lacking complete kitchen facilities
1.2%
4.5%
Housing units lacking complete plumbing facilities
0.6%
0.7%
Housing units in structures
Housing units in structures
San Jose
Paradise
One, detached
50.9%
35.3%
One, attached
11.5%
5.9%
Two
1.1%
0.9%
3 or 4
5.0%
9.6%
5 to 9
5.1%
7.8%
10 to 19
4.5%
10.3%
20 to 49
4.5%
7.2%
50 or more
14.2%
21.6%
Mobile homes
3.1%
1.4%
Boats, RVs, vans, etc.
0.1%
0.0%
Median real estate property taxes paid for housing units
Self-employed workers in own not incorporated business
28,517
3,926
State government workers
10,222
2,160
Unpaid family workers
472
187
Industries and Occupations
In San Jose, the dominant industries are tech and IT services. Major occupations include computer and mathematical roles. Paradise, on the other hand, is dominated by entertainment, hospitality, and food service sectors, with a large portion of jobs in these industries.
Both San Jose and Paradise, NV have numerous hospitals and medical facilities. San Jose, due to its larger population and area, has more health facilities including two trauma centers. Paradise shares many of its healthcare facilities with nearby Las Vegas.
Health (county statistics)
Type
San Jose
Paradise
General health status score of residents in this county from 1 (poor) to 5 (excellent)
San Jose boasts well-developed infrastructure, including high-speed internet and public utilities, essential for its tech-centric population. Paradise, primarily catering to tourists, emphasizes entertainment and hospitality infrastructure. Both cities have robust healthcare systems to cater to their residents and visitors.
HMDA - Conventional home purchase loans - Applications denied
Year
San Jose
Paradise
1999
3,839
974
2000
2,577
81
2001
1,953
104
2002
1,908
78
2003
3,578
1,227
2004
5,489
1,912
2005
6,994
3,008
2006
6,324
3,071
2007
4,298
1,731
2008
2,419
786
2009
1,631
285
Culture and Food
San Jose offers a diverse cultural scene with its museums, arts scene, and a variety of cuisines reflecting its multicultural population. Paradise is unmatched in its variety of entertainment and dining options, drawing millions of tourists each year.
Sports Teams
San Jose residents enjoy games from their local teams like the San Jose Sharks (NHL) and the San Francisco 49ers (NFL). Paradise does not have its own sports team but is close to the Las Vegas teams like the Las Vegas Raiders (NFL) and the Vegas Golden Knights (NHL).


 San Jose, CA
 Paradise, NV