Southwest San Gabriel Valley, CA vs Baldwin Park, CA
Southwest San Gabriel Valley and Baldwin Park, both located in California, present unique offerings in terms of lifestyle, cost of living, public services, local economy, education, and cultural diversity. Both regions have their own pros and cons, each offering a range of features desired by both visitors and permanent residents. This comparison takes a detailed look at essential components such as crime and safety, cost of living, weather, education, economy, infrastructure, city tax regime, cultural and food scenes, sports teams, geographical conditions, and healthcare systems.
The crime rate in Baldwin Park is slightly higher than the national average, although the city is home to many safe suburban neighborhoods. Southwest San Gabriel Valley reportedly has slightly less crime, but like Baldwin Park, the crime rate is close to that of the national average. Both places maintain effective police departments, and community involvement programs are in place to enhance safety.
Cost of Living
Living in Southwest San Gabriel Valley is comparatively more expensive than Baldwin Park, mainly due to higher real-estate prices. The difference in cost of general goods and services is not stark between the two regions.
Income Tax
In terms of income tax, both Baldwin Park and Southwest San Gabriel Valley follow the California state tax structure, which has increasing rates based on income brackets.
Property Tax
Considering property tax, homeowners in Southwest San Gabriel Valley tend to pay more due to higher property values compared to Baldwin Park.
Sales Tax
The sales tax for both Baldwin Park and Southwest San Gabriel Valley is similar, hovering around the 9.5% mark, which is on par with the California state average.
Income
Type
Southwest San Gabriel Valley
Baldwin Park
Estimated median household income
$73,720
$69,854
Estimated per capita income
$29,945
$25,416
Cost of living index (U.S. average is 100)
161.2
137.8
If you make $50,000 in Baldwin Park, you will have to make $58,491 in Southwest San Gabriel Valley to maintain the same standard of living.
Geographical Conditions
Southwest San Gabriel Valley benefits from a varied terrain with mountains and valleys giving it a slightly more scenic vibe compared to Baldwin Park. However, both areas enjoy pleasant weather and a beautiful natural environment.
Geographical information
Type
Southwest San Gabriel Valley
Baldwin Park
Land area
35.3 sq. miles
6.7 sq. miles
Population density
9,252.7 people per sq. mile
10,598 people per sq. mile
Relative area comparison
Southwest San Gabriel Valley, CA Baldwin Park, CA
Education
Both Southwest San Gabriel Valley and Baldwin Park offer good quality public and private schools. In addition, the regions have community colleges providing higher education. Baldwin Park, however, has a slightly higher graduation rate.
The Southwest San Gabriel Valley has a diversified economy with industries such as retail trade, health care, and educational services leading the way. Baldwin Park also has a robust economy, but leans more heavily on manufacturing, retail trade, and transportation.
Biggest Employers
The biggest employers in Baldwin Park includes Kaiser Permanente, Baldwin Park Unified School District and Walmart. In Southwest San Gabriel Valley, the largest employers are the health care and educational sectors.
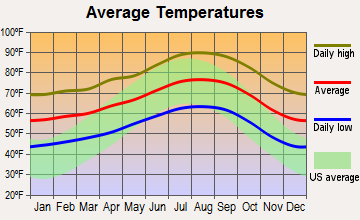
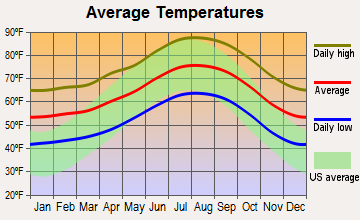
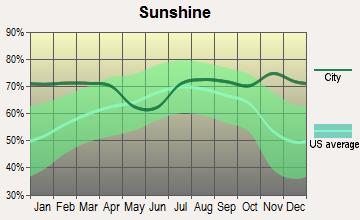
Weather
Weather conditions in both areas are quite favorable with a pleasant Mediterranean climate. Southwest San Gabriel Valley experiences less heat than Baldwin Park due to its proximity to the mountains which provide some relief in summer months. However, both places enjoy plenty of sunshine, low humidity, and mild winters, making them great spots for outdoor activities.
Weather and climate
Type
Southwest San Gabriel Valley
Baldwin Park
Temperature - Average
66.3°F
63.7°F
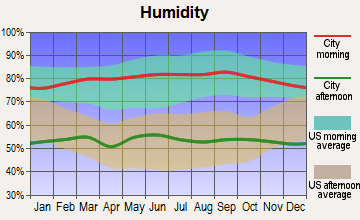
Humidity - Average morning or afternoon humidity
61.4%
63%
Humidity - Differences between morning and afternoon humidity
16.5%
18%
Humidity - Maximum monthly morning or afternoon humidity
65.8%
68.1%
Humidity - Minimum monthly morning or afternoon humidity
49.3%
50.1%
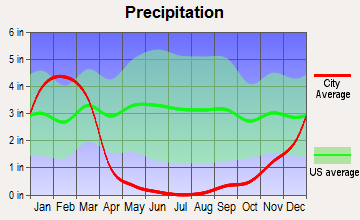
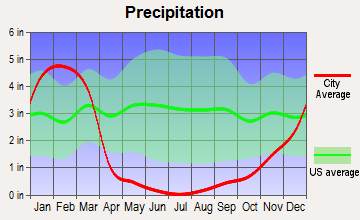
Precipitation - Yearly average
17.6 in
20 in
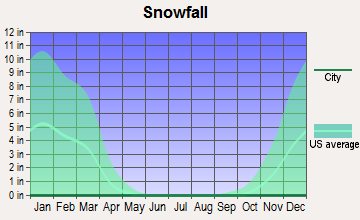
Snowfall - Yearly average
0 in
0 in
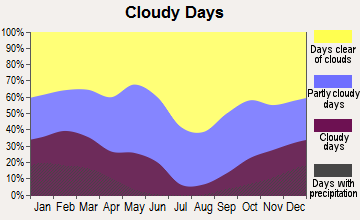
Clouds - Number of days clear of clouds
30.1%
28.9%
Sunshine amount - Average
78.4%
78.4%
Sunshine amount - Differences during a year
22%
22%
Sunshine amount - Maximum monthly
85%
85%
Sunshine amount - Minimum monthly
63%
63%
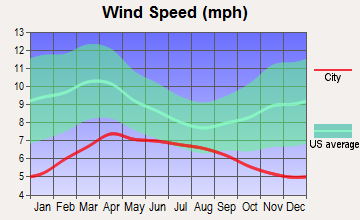
Wind speed - Average
2.3 mph
2.9 mph
Average climate in Southwest San Gabriel Valley, California
Average climate in Baldwin Park, California
Air pollution
Type
AQI
CO
NO2
OZONE
PB
PM10
PM25
SO2
Year
Southwest San Gabriel Valley
Baldwin Park
Southwest San Gabriel Valley
Baldwin Park
Southwest San Gabriel Valley
Baldwin Park
Southwest San Gabriel Valley
Baldwin Park
Southwest San Gabriel Valley
Baldwin Park
Southwest San Gabriel Valley
Baldwin Park
Southwest San Gabriel Valley
Baldwin Park
Southwest San Gabriel Valley
Baldwin Park
2018
140
142
0.39
0.36
14.2
14.2
26.6
29.5
0.008
0.007
27.5
28.5
15.1
13.6
0.4
0.4
2017
142
146
0.38
0.37
15.1
15.0
27.8
30.7
0.007
0.007
30.2
31.3
15.3
13.3
0.5
0.5
2016
128
136
0.36
0.33
15.2
15.7
26.5
29.0
0.007
0.007
27.8
28.8
14.3
12.4
0.4
0.5
2015
137
143
0.36
0.34
15.3
15.2
26.7
29.6
0.006
0.007
27.6
28.6
16.4
14.8
0.3
0.3
2014
138
141
0.39
0.36
16.3
16.9
26.8
28.7
0.007
0.007
29.9
31.7
18.0
13.4
0.4
0.5
2013
140
144
0.44
0.38
17.5
17.1
25.2
27.2
0.007
0.007
28.3
29.8
17.0
13.1
0.4
0.5
2012
144
148
0.47
0.40
17.7
18.6
25.0
26.2
0.007
0.005
27.6
29.2
18.1
15.7
0.5
0.5
2011
142
146
0.50
0.44
19.3
18.6
23.6
25.5
0.008
0.008
29.8
28.9
17.6
17.3
0.4
0.6
2010
128
133
0.52
0.44
19.4
19.0
22.9
25.5
0.020
0.009
30.0
26.1
16.3
15.0
0.5
0.5
2009
150
153
0.43
0.38
21.5
20.4
23.5
26.7
0.011
0.010
40.0
28.6
18.0
16.7
0.5
0.4
2008
152
154
0.53
0.52
23.5
22.8
22.8
26.2
0.014
0.013
39.1
29.3
18.3
16.1
0.6
0.6
2007
128
135
0.58
0.50
24.2
24.8
21.8
23.9
0.017
0.015
N/A
N/A
N/A
N/A
1.1
1.0
2006
125
128
0.63
0.51
24.6
25.0
22.1
23.1
0.009
0.009
N/A
N/A
N/A
N/A
1.7
1.5
2005
123
128
0.66
0.55
25.6
25.5
20.5
21.7
0.015
0.015
N/A
N/A
N/A
N/A
2.1
1.7
2004
132
134
0.77
0.64
27.7
24.8
22.9
24.0
0.019
0.018
N/A
N/A
N/A
N/A
2.4
2.4
2003
143
139
0.98
0.79
31.8
30.3
22.0
23.7
0.027
0.025
N/A
N/A
N/A
N/A
1.8
1.8
2002
137
136
1.00
0.82
33.0
32.2
21.1
22.1
0.025
0.021
N/A
N/A
N/A
N/A
2.4
2.3
2001
143
143
1.11
0.98
34.2
32.7
18.9
20.4
0.039
0.028
N/A
N/A
N/A
N/A
2.4
2.0
2000
147
151
1.12
1.01
33.4
34.6
18.9
20.2
0.033
0.024
N/A
N/A
N/A
N/A
1.4
1.1
Natural disasters
Type
Southwest San Gabriel Valley
Baldwin Park
Tornado activity compared to U.S. average
18%
18.3%
Earthquake activity compared to U.S. average
7,182.3%
7,262.2%
Natural disasters compared to U.S. average
57%
57%
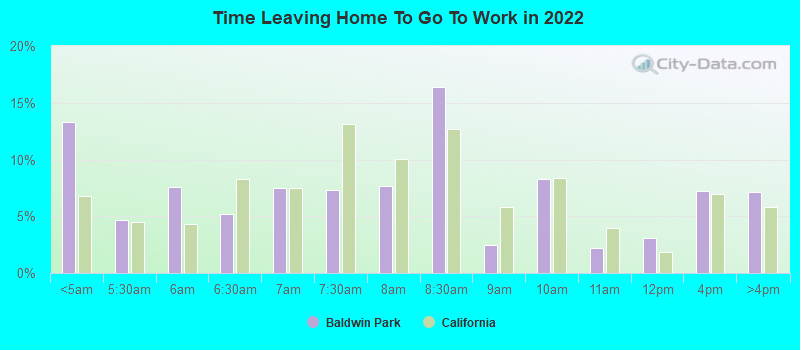
Transportation
Public transit is well developed in both areas, with a network of buses and trains ensuring easy connectivity to nearby cities. Commuting is relatively straightforward in both cities, although Southwest San Gabriel Valley scores slightly higher due to its closeness to Los Angeles.
Transport
Type
Southwest San Gabriel Valley
Baldwin Park
Amtrak stations nearby
3
3
FAA registered aircraft
0
92
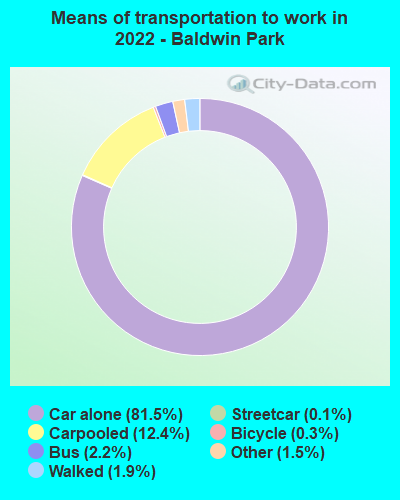
Means of transportation to work
Type
Southwest San Gabriel Valley
Baldwin Park
Bicycle
0.5%
0.6%
Bus
4.7%
2.6%
Carpooled
16.1%
13.3%
Car alone
73%
80.2%
Railroad
0%
0.3%
Streetcar
0%
0.2%
Walked
2.5%
2.3%
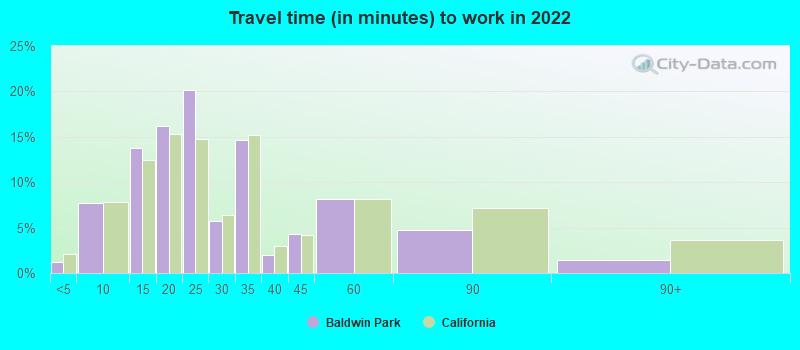
Average travel time to work
Type
Southwest San Gabriel Valley
Baldwin Park
Average
29.1 min
29.4 min
Real Estate
Real estate prices in Southwest San Gabriel Valley are relatively higher compared to Baldwin Park, which translates to higher rental rates too. Both places offer a variety of housing options, with Southwest San Gabriel Valley being nearer to upmarket areas.
Neighborhoods
Both Baldwin Park and Southwest San Gabriel Valley boast quiet, family-friendly neighborhoods. Southwest San Gabriel Valley is slightly more desirable due to its scenic attributes and proximity to Los Angeles.
Houses and residents
Type
Southwest San Gabriel Valley
Baldwin Park
Houses
102,656
19,605
Average household size (people)
3.1
4.4
Houses occupied
99,543 (97%)
19,112 (97.5%)
Houses occupied by owners
47,333 (47.6%)
12,751 (66.7%)
Houses occupied by renters
52,210 (52.5%)
6,361 (33.3%)
Median rent asked for vacant for-rent units
$1,828
$1,786
Median price asked for vacant for-sale houses and condos
$1,138,428
$459,588
Estimated median house or condo value
$723,161
$536,500
Median number of rooms in apartments
3.7
4.2
Median number of rooms in houses and condos
5.9
5.3
Renting percentage
51.7%
39.8%
Housing density (houses/condos per square mile)
2,909.6
2,941.7
Household income disparities
44%
40.9%
Housing units without a mortgage
13,166 (31.1%)
91 (1%)
Housing units with both a second mortgage and home equity loan
88 (0.2%)
251 (2.7%)
Housing units with a mortgage
29,118 (68.9%)
9,241 (99%)
Housing units with a home equity loan
2,557 (6%)
28 (0.3%)
Housing units with a second mortgage
2,975 (7%)
505 (5.4%)
Housing units lacking complete kitchen facilities
1.5%
2.7%
Housing units lacking complete plumbing facilities
Self-employed workers in own not incorporated business
8,660
2,437
State government workers
4,158
758
Unpaid family workers
639
0
Industries and Occupations
Baldwin Park is known for its manufacturing, transportation, and retail trade industries. In contrast, Southwest San Gabriel Valley has a more diversified job market with management, business, science, and arts occupations leading the way.
Health Care
Both Southwest San Gabriel Valley and Baldwin Park have access to quality healthcare facilities. Given its size and proximity to LA, Southwest San Gabriel Valley boasts more hospitals and specialized healthcare services.
Infrastructure
Infrastructure in both areas is well-developed with good road networks, public facilities, and utilities. Southwest San Gabriel Valley benefits from its proximity to major cities like Los Angeles, thus offering more robust infrastructure support.
Infrastructure
Type
Southwest San Gabriel Valley
Baldwin Park
TV stations
26
28
Culture and Food
Both areas boast a vibrant culture and food scene owing to their diverse demographics. Southwest San Gabriel Valley, however, edges ahead with a slightly more lively arts scene and a wider variety of dining options due to its proximity to Los Angeles.
Sports Teams
Neither of the areas house major sports teams, but due to their locations in the Los Angeles metro area, they both have access to major LA sports teams such as the Dodgers (baseball), Lakers (basketball), and Rams (football).
 Southwest San Gabriel Valley, CA
 Baldwin Park, CA