Southwest San Gabriel Valley and Torrance are both cities located in the heart of Southern California. Each city offers a unique blend of vibrant culture, engaging industries, and attractive geographical conditions. This report is a comprehensive comparison of these two areas, focusing on key aspects such as crime and safety, weather, cost of living, and many more, to aid individuals in exploring relocation option or just looking for a place to visit.
Torrance is generally considered safer than the Southwest San Gabriel Valley area. The violent crime rate in Torrance is considerably lower, making it an attractive place for families and tourists alike. However, it's still crucial to take precautions and stay informed about the neighborhood you're in. Southwest San Gabriel Valley, while higher in crime rate, continues to see improvements as local authorities implement more effective safety measures.
Cost of Living
The cost of living in Torrance is generally higher than in the Southwest San Gabriel Valley. This is primarily due to housing prices, which are notably more expensive in Torrance. Other costs, such as groceries, health care, and utilities, are comparable in both areas but slightly higher in Torrance.
Income Tax
Both locations are subject to California's state income tax, which varies from 1% to 13.3% depending on income levels. As of now, neither city imposes an additional local income tax.
Property Tax
The average property tax in Torrance is slightly higher than Southwest San Gabriel Valley, reflective of its higher property values.
Sales Tax
Torrance has a combined sales tax rate of 9.5%, while Southwest San Gabriel Valley has a sales tax rate of 7.75%, both rates inclusive of the California state sales tax rate.
Income
Type
Southwest San Gabriel Valley
Torrance
Estimated median household income
$73,720
$100,392
Estimated per capita income
$29,945
$52,528
Cost of living index (U.S. average is 100)
161.2
142.7
If you make $50,000 in Torrance, you will have to make $56,482 in Southwest San Gabriel Valley to maintain the same standard of living.
Geographical Conditions
Torrance, being a coastal city, offers beautiful beach sceneries and a cooler climate. Southwest San Gabriel Valley, located inland and surrounded by mountainous terrain, has hot summers and offers numerous hiking and outdoor activities.
Geographical information
Type
Southwest San Gabriel Valley
Torrance
Land area
35.3 sq. miles
20.5 sq. miles
Population density
9,252.7 people per sq. mile
6,990.9 people per sq. mile
Relative area comparison
Southwest San Gabriel Valley, CA Torrance, CA
Education
Both areas offer good quality education with multiple public and private schools. However, Torrance schools generally record higher test scores and have better-funded programs. Southwest San Gabriel Valley, while offering competitive programs, has schools that perform a bit below the state average in test scores.
Torrance's economy is diverse with strong sectors in healthcare, retail, manufacturing, and professional services. Jobs are abundant, with a low unemployment rate. On the other hand, Southwest San Gabriel Valley has a more service-oriented economy with jobs primarily in healthcare, retail, and education sectors. The unemployment rate is comparable to Torrance.
Biggest Employers
In Torrance, some of the largest employers include Honda, Honeywell, and Torrance Memorial Medical Center. The Southwest San Gabriel Valley counts Southern California Edison and Los Angeles County Department of Health Services among its largest employers.
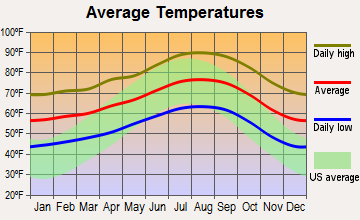
Weather
Both locations enjoy a typical Southern Californian climate characterized by warm, dry summers and mild, wet winters. Torrance, being closer to the coast, tends to have slightly lower temperatures, especially during the summer, making it a haven for tourists seeking to escape the heat. Southwest San Gabriel Valley is further inland and experiences warmer temperatures but is still comfortable for residents and visitors.
Weather and climate
Type
Southwest San Gabriel Valley
Torrance
Temperature - Average
66.3°F
63°F
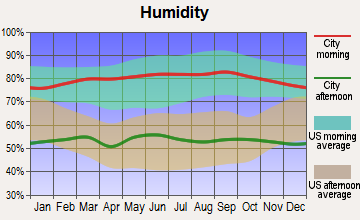
Humidity - Average morning or afternoon humidity
61.4%
68.6%
Humidity - Differences between morning and afternoon humidity
16.5%
24.4%
Humidity - Maximum monthly morning or afternoon humidity
65.8%
76.4%
Humidity - Minimum monthly morning or afternoon humidity
49.3%
52%
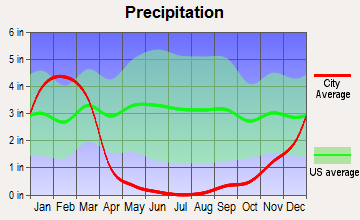
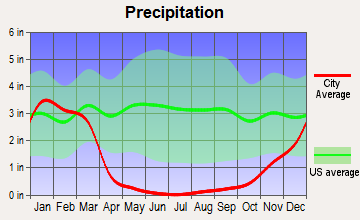
Precipitation - Yearly average
17.6 in
14.3 in
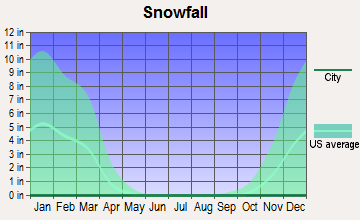
Snowfall - Yearly average
0 in
0 in
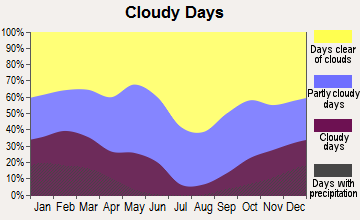
Clouds - Number of days clear of clouds
30.1%
26%
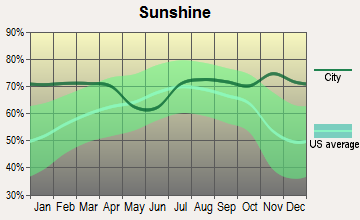
Sunshine amount - Average
78.4%
78.4%
Sunshine amount - Differences during a year
22%
22%
Sunshine amount - Maximum monthly
85%
85%
Sunshine amount - Minimum monthly
63%
63%
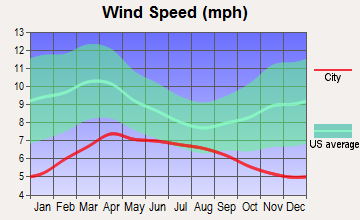
Wind speed - Average
2.3 mph
5.3 mph
Average climate in Southwest San Gabriel Valley, California
Average climate in Torrance, California
Air pollution
Type
AQI
CO
NO2
OZONE
PB
PM10
PM25
SO2
Year
Southwest San Gabriel Valley
Torrance
Southwest San Gabriel Valley
Torrance
Southwest San Gabriel Valley
Torrance
Southwest San Gabriel Valley
Torrance
Southwest San Gabriel Valley
Torrance
Southwest San Gabriel Valley
Torrance
Southwest San Gabriel Valley
Torrance
Southwest San Gabriel Valley
Torrance
2018
140
124
0.39
0.38
14.2
14.5
26.6
25.2
0.008
0.008
27.5
27.5
15.1
13.9
0.4
0.6
2017
142
122
0.38
0.40
15.1
15.6
27.8
25.7
0.007
0.007
30.2
26.7
15.3
14.7
0.5
0.7
2016
128
115
0.36
0.41
15.2
15.2
26.5
25.4
0.007
0.007
27.8
24.1
14.3
12.6
0.4
0.7
2015
137
111
0.36
0.40
15.3
16.2
26.7
26.0
0.006
0.005
27.6
25.0
16.4
14.8
0.3
0.7
2014
138
128
0.39
0.46
16.3
16.3
26.8
25.5
0.007
0.007
29.9
26.5
18.0
15.8
0.4
0.8
2013
140
127
0.44
0.48
17.5
17.3
25.2
25.7
0.007
0.005
28.3
30.4
17.0
15.2
0.4
0.7
2012
144
132
0.47
0.47
17.7
17.0
25.0
25.4
0.007
0.005
27.6
29.7
18.1
15.2
0.5
0.6
2011
142
124
0.50
0.41
19.3
18.3
23.6
24.1
0.008
0.007
29.8
28.6
17.6
16.1
0.4
0.8
2010
128
117
0.52
0.46
19.4
18.5
22.9
22.8
0.020
0.014
30.0
25.5
16.3
13.6
0.5
0.6
2009
150
136
0.43
0.50
21.5
19.8
23.5
23.9
0.011
0.009
40.0
33.3
18.0
15.0
0.5
1.3
2008
152
129
0.53
0.48
23.5
21.7
22.8
23.2
0.014
0.009
39.1
30.8
18.3
21.3
0.6
1.2
2007
128
111
0.58
0.48
24.2
21.4
21.8
23.2
0.017
0.012
N/A
N/A
N/A
N/A
1.1
2.2
2006
125
120
0.63
0.52
24.6
22.1
22.1
23.7
0.009
0.006
N/A
N/A
N/A
N/A
1.7
1.8
2005
123
111
0.66
0.53
25.6
22.6
20.5
23.1
0.015
0.012
N/A
N/A
N/A
N/A
2.1
4.3
2004
132
128
0.77
0.58
27.7
25.3
22.9
25.5
0.019
0.013
N/A
N/A
N/A
N/A
2.4
2.4
2003
143
131
0.98
0.80
31.8
26.8
22.0
21.5
0.027
0.025
N/A
N/A
N/A
N/A
1.8
0.8
2002
137
123
1.00
0.83
33.0
27.8
21.1
22.6
0.025
0.017
N/A
N/A
N/A
N/A
2.4
2.1
2001
143
126
1.11
0.83
34.2
29.1
18.9
21.5
0.039
0.031
N/A
N/A
N/A
N/A
2.4
3.7
2000
147
140
1.12
0.87
33.4
30.9
18.9
19.7
0.033
0.030
N/A
N/A
N/A
N/A
1.4
2.3
Natural disasters
Type
Southwest San Gabriel Valley
Torrance
Tornado activity compared to U.S. average
18%
17%
Earthquake activity compared to U.S. average
7,182.3%
6,816.1%
Natural disasters compared to U.S. average
57%
57%
Transportation
Public transit in Torrance is reliable with multiple bus and train lines offering convenient commuting options to and from downtown Los Angeles. Southwest San Gabriel Valley also offers multiple transit options but has lesser connectivity to downtown.
Transport
Type
Southwest San Gabriel Valley
Torrance
Amtrak stations nearby
3
3
FAA registered aircraft
0
284
FAA registered aircraft manufacturers and dealers
0
17
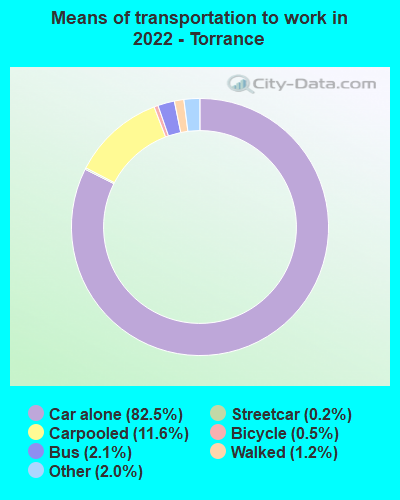
Means of transportation to work
Type
Southwest San Gabriel Valley
Torrance
Bicycle
0.5%
1.1%
Bus
4.7%
1.2%
Carpooled
16.1%
8.8%
Car alone
73%
85.2%
Motorcycle
0.1%
0.3%
Walked
2.5%
0.9%
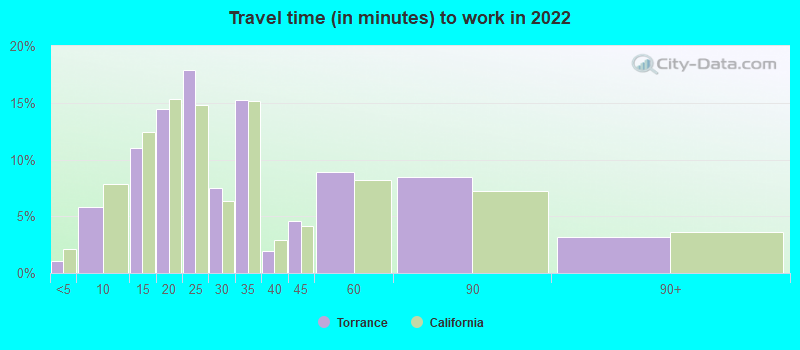
Average travel time to work
Type
Southwest San Gabriel Valley
Torrance
Average
29.1 min
29.5 min
Real Estate
Real estate in Torrance is considerably pricier due to its developed neighborhoods and close proximity to the beach. Southwest San Gabriel Valley offers more affordable housing options, making it more attractive to young families and first-time home buyers.
Neighborhoods
Torrance neighborhoods offer a blend of suburban and city life and are notably safer and cleaner. Neighborhoods in Southwest San Gabriel Valley are more densely populated and have more diversity but vary widely in safety, cleanliness, and development.
Houses and residents
Type
Southwest San Gabriel Valley
Torrance
Houses
102,656
60,220
Average household size (people)
3.1
2.6
Houses occupied
99,543 (97%)
57,584 (95.6%)
Houses occupied by owners
47,333 (47.6%)
32,109 (55.8%)
Houses occupied by renters
52,210 (52.5%)
25,475 (44.2%)
Median rent asked for vacant for-rent units
$1,828
$1,147
Median price asked for vacant for-sale houses and condos
$1,138,428
$1,098,324
Estimated median house or condo value
$723,161
$930,500
Median number of rooms in apartments
3.7
3.6
Median number of rooms in houses and condos
5.9
5.9
Renting percentage
51.7%
43.5%
Housing density (houses/condos per square mile)
2,909.6
2,931.7
Household income disparities
44%
40.9%
Housing units without a mortgage
13,166 (31.1%)
332 (1.6%)
Housing units with both a second mortgage and home equity loan
88 (0.2%)
1,364 (6.5%)
Housing units with a mortgage
29,118 (68.9%)
20,690 (98.4%)
Housing units with a home equity loan
2,557 (6%)
44 (0.2%)
Housing units with a second mortgage
2,975 (7%)
1,820 (8.7%)
Housing units lacking complete kitchen facilities
1.5%
2.2%
Housing units lacking complete plumbing facilities
Self-employed workers in own not incorporated business
8,660
5,274
State government workers
4,158
1,875
Unpaid family workers
639
270
Industries and Occupations
In Torrance, the most common industries are health care, retail trade, and manufacturing. Southwest San Gabriel Valley has a similar trend with Health care, retail trade, and educational services being the most prominent industries.
Health Care
Torrance comes out ahead with several highly-rated hospitals within and surrounding the city, providing excellent healthcare services. Southwest San Gabriel Valley, while having access to decent healthcare, does not match up to Torrance in terms of quality and accessibility.
Infrastructure
Torrance is greatly developed with a robust infrastructure that includes multiple hospitals, schools, parks, and shopping plazas. Southwest San Gabriel Valley has seen significant improvement in its infrastructure over the years, but still lags behind Torrance in terms of development.
Infrastructure
Type
Southwest San Gabriel Valley
Torrance
TV stations
26
3
Culture and Food
Torrance boasts a rich culture, reflected in its many festivals, art galleries, and diverse food scene. Southwest San Gabriel Valley, while having its own cultural uniqueness, is particularly notable for its Asian-American cultural and culinary influences.
Sports Teams
Neither Torrance nor Southwest San Gabriel Valley are home to major sports teams, but their proximity to Los Angeles ensures fans are never too far from the action.
 Southwest San Gabriel Valley, CA
 Torrance, CA