Staten Island and Yonkers, NY both offer unique living experiences with their own respective allure and charm. Despite both being apart of greater New York City's sprawling metropolis, they each have a distinctive set of characteristics including crime rates, cost of living, health care, and more which are beneficial to consider when thinking about relocation or tourism. This comparison aims to cover areas including crime/safety, weather, cost of living, education, work and economy, amongst others to give a comprehensive comparison of life in Staten Island versus Yonkers.
In comparison to Yonkers, Staten Island maintains a relatively lower crime rate. While crime exists in both areas, Staten Island is generally considered safer with a lower reported violent crime and property crime rate. However, it's always crucial to investigate specific neighborhoods for a more precise view.
Cost of Living
The cost of living in Staten Island is generally higher in comparison to living in Yonkers. This includes necessities like housing, groceries, utilities, and other household expenses. The higher cost of living is often justified by better safety, greater amenities, and closer proximity to Manhattan.
Income Tax
City and state income tax are identical in Yonkers and Staten Island, as both are subject to New York state and city income tax. The rate can range from 4% to 8.82% for the state and 3.078% to 3.876% for the city, depending on taxable income.
Property Tax
Property tax rates vary between Yonkers and Staten Island. Yonkers has a significantly higher property tax rate, which could be a serious consideration if you're planning to buy property.
Sales Tax
Both Staten Island and Yonkers have the same sales tax rate, attributed to the New York state sales tax of 4% alongside the city sales tax of 4.5%, summing up to a total of 8.5%.
Income
Type
Staten Island
Yonkers
Estimated median household income
$86,054
$66,395
Estimated per capita income
$38,678
$37,977
Cost of living index (U.S. average is 100)
164.1
152.2
If you make $50,000 in Yonkers, you will have to make $53,909 in Staten Island to maintain the same standard of living.
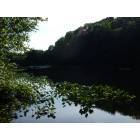
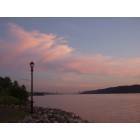
Geographical Conditions
While both Staten Island and Yonkers are along waterways, Staten Island, located in New York Harbor, has a more maritime influence. Yonkers, on the other hand, is located inland along the Hudson River and enjoys slightly hilly terrain.
Geographical information
Type
Staten Island
Yonkers
Land area
58.5 sq. miles
18.1 sq. miles
Population density
8,225.7 people per sq. mile
11,591 people per sq. mile
Relative area comparison
Staten Island, NY Yonkers, NY
Education
Both Staten Island and Yonkers are served by excellent public and private schools, offering good education to all age groups. For higher education, Staten Island is home to the College of Staten Island, Wagner College, and St. John’s University while Yonkers hosts Sarah Lawrence College, one of the nation’s top liberal arts colleges.
Yonkers' economy is characterized by sectors like healthcare, education, and retail, whereas in Staten Island, healthcare, retail trade, and construction dominate. The unemployment rate is relatively similar in both cities with Staten Island slightly lower.
Biggest Employers
On Staten Island, some of the biggest employers include Staten Island University Hospital, Richmond University Medical Center, and the City of New York. In Yonkers, the major employers are Montefiore Health System, Empire City Casino, and the Yonkers Board of Education.
In Staten Island (Richmond County), 50.8% voted for Democrats and 48.3% for Republicans in 2012 Presidential Election. In Yonkers (Westchester County), 62.1% voted for Democrats and 36.9% for Republicans.
Elections
Type
Democrats
Republicans
Other
Year
Staten Island
Yonkers
Staten Island
Yonkers
Staten Island
Yonkers
2020
42.2%
67.8%
57.1%
31.4%
0.7%
0.8%
2016
41.0%
65.0%
56.1%
31.2%
2.9%
3.8%
2012
50.8%
62.1%
48.3%
36.9%
0.9%
0.9%
2008
47.8%
63.7%
51.9%
36.0%
0.4%
0.3%
2004
42.8%
58.2%
56.5%
40.4%
0.7%
1.4%
2000
52.1%
58.9%
45.1%
37.6%
2.9%
3.5%
1996
50.5%
56.9%
40.8%
35.9%
8.7%
7.2%
Breakdown of population affiliated with a religious congregation
Type
Adherents
Congregations
Religion
Staten Island
Yonkers
Staten Island
Yonkers
CATHOLIC CHURCH
54.2%
45.9%
20.6%
15.3%
MUSLIM ESTIMATE
1.7%
1.4%
3.0%
1.5%
AMERICAN BAPTIST CHURCHES IN THE USA
0.6%
0.6%
1.0%
3.4%
EVANGELICAL LUTHERAN CHURCH IN AMERICA
0.6%
0.5%
4.0%
2.5%
COPTIC ORTHODOX CHURCH
0.5%
0.0%
1.0%
0.2%
EPISCOPAL CHURCH
0.4%
1.5%
5.0%
7.5%
REFORMED CHURCH IN AMERICA
0.1%
0.3%
2.5%
1.7%
SEVENTH DAY ADVENTIST CHURCH
0.1%
0.4%
2.5%
3.5%
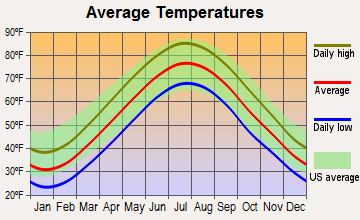
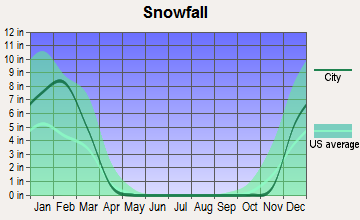
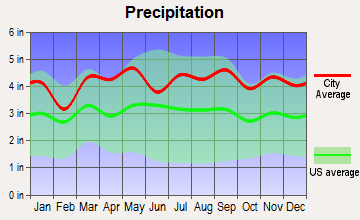
Weather
Weather in both Staten Island and Yonkers display typical northeastern climates. This involves hot and humid summers, mild to chilly falls and springs, and potentially harsh, snow-filled winters. There's very little deviation in weather patterns between the two places due to their close geographical proximity.
Weather and climate
Type
Staten Island
Yonkers
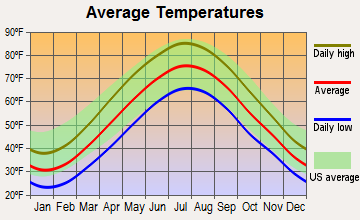
Temperature - Average
54.1°F
53.5°F
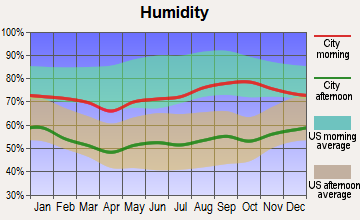
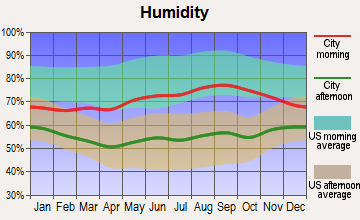
Humidity - Average morning or afternoon humidity
67.4%
67.4%
Humidity - Differences between morning and afternoon humidity
29.9%
26.9%
Humidity - Maximum monthly morning or afternoon humidity
77%
75.9%
Humidity - Minimum monthly morning or afternoon humidity
47.2%
49%
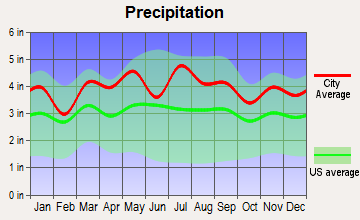
Precipitation - Yearly average
47.4 in
50.1 in
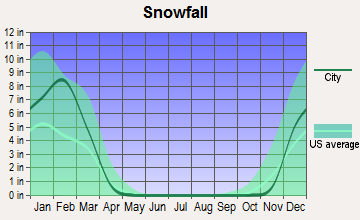
Snowfall - Yearly average
60 in
54.9 in
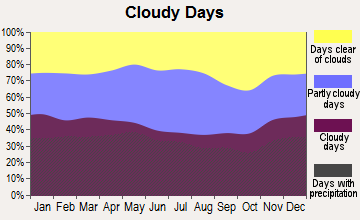
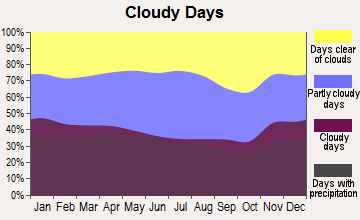
Clouds - Number of days clear of clouds
15.8%
16.7%
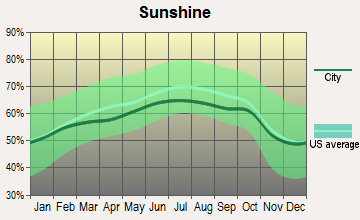
Sunshine amount - Average
60.2%
60.2%
Sunshine amount - Differences during a year
20%
20%
Sunshine amount - Maximum monthly
64%
64%
Sunshine amount - Minimum monthly
44%
44%
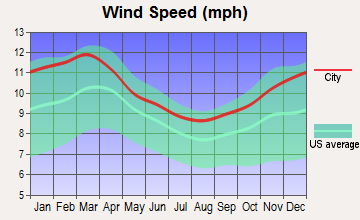
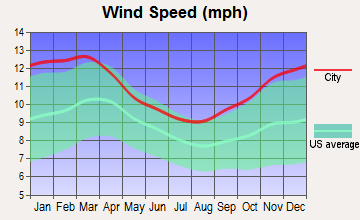
Wind speed - Average
10.5 mph
10 mph
Average climate in Staten Island, New York
Average climate in Yonkers, New York
Air pollution
Type
AQI
CO
NO2
OZONE
PB
PM10
PM25
SO2
Year
Staten Island
Yonkers
Staten Island
Yonkers
Staten Island
Yonkers
Staten Island
Yonkers
Staten Island
Yonkers
Staten Island
Yonkers
Staten Island
Yonkers
Staten Island
Yonkers
2018
94
102
0.35
0.30
17.1
16.1
24.1
24.6
N/A
N/A
N/A
N/A
7.9
7.5
0.4
0.6
2017
98
97
0.32
0.10
17.0
16.1
27.0
24.8
N/A
N/A
N/A
N/A
7.6
7.2
0.2
0.5
2016
94
97
0.37
0.28
17.9
16.8
28.5
24.7
N/A
N/A
N/A
N/A
7.7
7.5
0.2
0.7
2015
102
105
0.39
0.29
18.9
18.1
27.3
23.9
N/A
N/A
N/A
N/A
8.6
8.7
0.4
1.3
2014
97
96
0.38
0.33
19.2
18.3
25.6
23.7
N/A
N/A
N/A
N/A
8.3
8.2
0.7
1.6
2013
99
103
0.39
0.39
19.6
18.8
27.8
23.8
N/A
N/A
N/A
N/A
8.5
8.9
0.8
1.9
2012
102
102
0.42
0.43
19.3
18.6
26.9
24.2
N/A
N/A
N/A
N/A
9.2
8.9
1.4
2.8
2011
108
107
0.42
0.45
21.4
20.8
28.1
22.6
N/A
N/A
N/A
N/A
10.2
10.9
2.0
4.1
2010
114
113
0.40
0.48
19.9
19.3
28.7
24.0
N/A
N/A
N/A
N/A
9.4
10.3
1.8
3.7
2009
105
102
0.39
0.50
22.5
21.4
25.3
19.7
N/A
N/A
N/A
N/A
9.5
10.4
2.4
4.5
2008
111
114
0.39
0.51
23.0
22.5
24.3
20.4
0.013
0.013
N/A
N/A
11.3
11.7
3.4
5.0
2007
123
120
0.44
0.58
24.2
24.2
23.3
19.7
0.016
0.016
N/A
N/A
12.0
12.8
4.3
6.0
2006
117
115
0.55
0.53
25.6
23.9
24.7
19.7
0.018
0.018
N/A
N/A
13.1
12.8
5.3
6.1
2005
112
112
0.69
0.62
27.3
26.1
23.3
18.8
N/A
N/A
N/A
N/A
N/A
N/A
7.3
8.1
2004
109
99
0.68
0.63
26.4
25.0
22.2
17.6
0.030
0.030
N/A
N/A
N/A
N/A
6.9
7.9
2003
112
106
0.76
0.74
28.0
26.5
22.1
18.1
0.006
0.025
26.9
26.9
N/A
N/A
7.1
8.0
2002
125
122
0.74
0.68
30.6
26.7
24.7
18.9
0.008
N/A
26.1
25.4
N/A
N/A
6.6
7.6
2001
124
123
0.81
0.69
32.4
28.9
24.9
19.4
0.020
N/A
26.9
23.6
N/A
N/A
7.2
8.9
2000
116
111
0.93
0.71
33.0
29.2
23.1
17.1
0.022
N/A
22.2
22.2
N/A
N/A
7.2
8.4
Natural disasters
Type
Staten Island
Yonkers
Tornado activity compared to U.S. average
61.3%
60.2%
Earthquake activity compared to U.S. average
31.2%
31.2%
Natural disasters compared to U.S. average
19%
26%
Transportation
Staten Island's public transportation services are primarily limited to buses and a single train line, whereas Yonkers offers multiple train lines and bus routes. For commuting into Manhattan, however, Staten Islanders have the unique option of taking the Staten Island Ferry, a popular and scenic route for both commuters and tourists alike.
Transport
Type
Staten Island
Yonkers
Amtrak stations
0
1
Amtrak stations nearby
3
3
FAA registered aircraft
39
17
FAA registered aircraft manufacturers and dealers
2
0
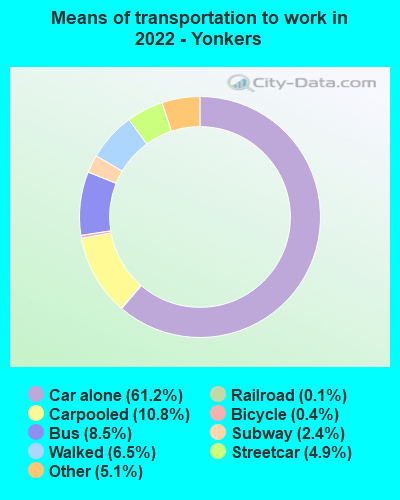
Means of transportation to work
Type
Staten Island
Yonkers
Bicycle
0.2%
0.1%
Bus
19.2%
13.9%
Carpooled
12.1%
12.2%
Car alone
54.3%
60.3%
Ferryboat
5.3%
0%
Railroad
0.9%
6.2%
Streetcar
0%
2.5%
Subway
2.6%
2.5%
Taxicab
0.4%
0.9%
Walked
2.9%
4.4%
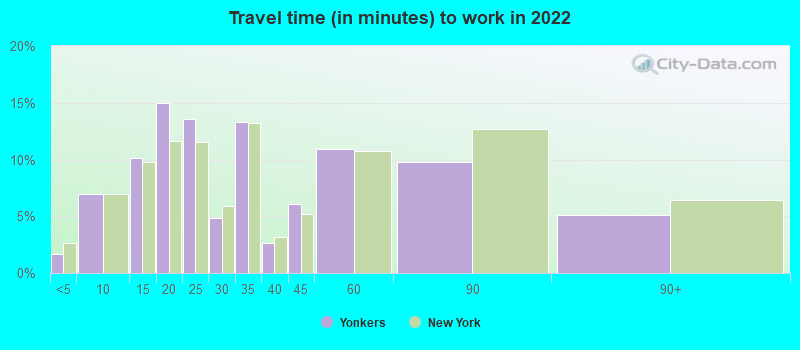
Average travel time to work
Type
Staten Island
Yonkers
Average
45.3 min
33.9 min
Real Estate
Staten Island's real estate market is more expensive than in Yonkers. This is largely due to its location, being part of NYC boroughs, which makes it one of the premier real estate markets in the US. Nonetheless, Yonkers also offers a substantial range of real estate options to match varying budgets.
Neighborhoods
Yonkers offers a range of neighborhoods from the upscale, suburban-feel Scarsdale to the bustling Getty Square. Staten Island, on the other hand, is loved for its green spaces and suburban feel, with neighborhoods like St. George and South Shore proving popular.
Houses and residents
Type
Staten Island
Yonkers
Houses
163,993
83,368
Average household size (people)
2.8
2.6
Houses occupied
156,341 (95.3%)
81,397 (97.6%)
Houses occupied by owners
99,732 (63.8%)
40,385 (49.6%)
Houses occupied by renters
56,609 (36.2%)
41,012 (50.4%)
Median rent asked for vacant for-rent units
$1,320
$746.05
Median price asked for vacant for-sale houses and condos
$369,853
$214,056
Estimated median house or condo value
$605,500
$424,100
Median number of rooms in apartments
3.9
3.8
Median number of rooms in houses and condos
6.1
5.5
Renting percentage
35.9%
53.9%
Housing density (houses/condos per square mile)
2,804.3
4,611.9
Household income disparities
43.8%
48.5%
Housing units without a mortgage
19,289 (25%)
759 (3.3%)
Housing units with both a second mortgage and home equity loan
160 (0.2%)
2,672 (11.7%)
Housing units with a mortgage
57,986 (75%)
21,988 (96.7%)
Housing units with a home equity loan
5,623 (7.3%)
118 (0.5%)
Housing units with a second mortgage
4,499 (5.8%)
3,163 (13.9%)
Housing units lacking complete kitchen facilities
0.6%
0.9%
Housing units lacking complete plumbing facilities
Self-employed workers in own not incorporated business
7,611
5,405
State government workers
6,285
4,428
Unpaid family workers
394
337
Industries and Occupations
Healthcare and social assistance, education, retail trade, and public administration are the leading industries in Yonkers. Similarly, on Staten Island, the healthcare sector, retail, education, and construction provide the most jobs.
Both Staten Island and Yonkers have excellent healthcare facilities. Staten Island, however, is home to some prestigious hospitals like Richmond University Medical Center and Staten Island University Hospital.
Staten Island boasts modern infrastructure with extensive roads, multiple parks, and recreation areas. Yonkers also offers a solid infrastructure but is more urbanized and offers a higher number of public facilities like libraries, museums, and public parks.
Infrastructure
Type
Staten Island
Yonkers
Hospitals
25
7
TV stations
30
30
Bank branches located here
104
52
Bank institutions located here
19
16
Main business address for public companies
1
4
Drinking water stations with no reported violations in the past
1
0
Drinking water stations with reported violations in the past
3
1
Schools
School facilities
Type
Staten Island
Yonkers
Private elementary/middle schools
22
15
Private high schools
13
5
Public elementary/middle schools
63
32
Public high schools
16
9
Colleges/Universities
5
2
Culture and Food
Culturally, both cities offer a melting pot of experiences. Staten Island has a rich and historic culture with museums, artwork, and theatre such as the St. George Theatre. Yonkers also boasts a vibrant cultural scene with various arts and music festivals. Both cities offer a range of American and international cuisines.
Sports Teams
Staten Island has its own minor league baseball team, the Staten Island Yankees, while Yonkers, being in Westchester County, shares the Westchester Knicks, a development league affiliate of the NBA's New York Knicks.


 Staten Island, NY
 Yonkers, NY