Comparing the Upper San Gabriel Valley and West Covina, both located in California, can reveal several interesting contrasts and parallels. The Upper San Gabriel Valley, consisting of several cities, is known for its tranquility, diverse cultural ambiance, and top-ranking school districts. West Covina, on the other hand, is a vibrant city with a fast-paced atmosphere, a wide range of shopping options, and a youthful, diverse population. The following sections offer a close look at how these two areas compare on various important aspects, including crime, cost of living, education, and more.
According to most reported statistics, the Upper San Gabriel Valley and West Covina have similar crime rates, both typically lower than the US average. Both areas are generally considered safe to live and visit, with dedicated local law enforcement agencies, but like anywhere, crime can still happen. Neighborhood watch programs are common in both areas, and residents report feeling relatively secure.
Cost of Living
The cost of living in both the Upper San Gabriel Valley and West Covina is higher than the US average, consistent with California as a whole. Upper San Gabriel Valley, in general, is more expensive than West Covina, particularly in terms of housing prices. Groceries, transportation, and health costs are also slightly higher in the San Gabriel Valley.
Income Tax
City/state income tax is the same for both areas as they are all under California jurisdiction. Top marginal tax rates in California are among the highest in the United States, currently standing at 13.3% for incomes over $1 million.
Property Tax
Property tax rates are also the same for both regions under Los Angeles County, with a current rate of approximately 1.16% of assessed property value. However, the overall tax bill can be higher in the Upper San Gabriel Valley due to higher property values.
Sales Tax
The city/state sales tax in both the Upper San Gabriel Valley and West Covina is the same, given that they are both in the same county. The current rate is 9.5%, which is slightly higher than the US average, reflecting the overall high cost of living in California.
Income
Type
Upper San Gabriel Valley
West Covina
Estimated median household income
$80,436
$88,476
Estimated per capita income
$33,562
$35,743
Cost of living index (U.S. average is 100)
159.5
137.1
If you make $50,000 in West Covina, you will have to make $58,169 in Upper San Gabriel Valley to maintain the same standard of living.
Geographical Conditions
The Upper San Gabriel Valley lies in the eastern part of the fertile San Gabriel Valley, with mountainous terrain to the north. West Covina is more urban, but it has numerous parks and green spaces, and is close to the San Gabriel Mountains, providing opportunities for outdoor activities.
Geographical information
Type
Upper San Gabriel Valley
West Covina
Land area
49.4 sq. miles
16.1 sq. miles
Population density
6,624.2 people per sq. mile
6,644.9 people per sq. mile
Relative area comparison
Upper San Gabriel Valley, CA West Covina, CA
Education
Both areas have a strong education system, with numerous public and private schools offering quality education. The Upper San Gabriel Valley, however, is particularly known for its top-ranking school districts like the San Marino Unified School District. The area also offers a diverse array of colleges and universities, thus providing higher education opportunities.
Both West Covina and the Upper San Gabriel Valley enjoy a thriving economy, with a mix of small businesses, retail, healthcare, and professional services. Unemployment rates are relatively low for both areas, and job growth is steady, particularly in healthcare and education sectors.
Biggest Employers
The biggest employers in the Upper San Gabriel Valley include hospitals, school districts, and local governments. In West Covina, the City of West Covina, the West Covina Unified School District, and the Citrus Valley Medical Center are among the biggest employers.
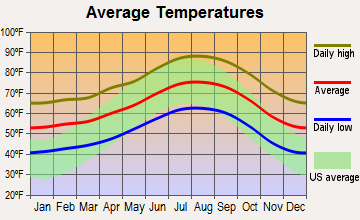
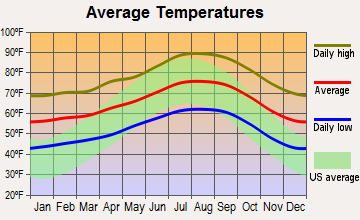
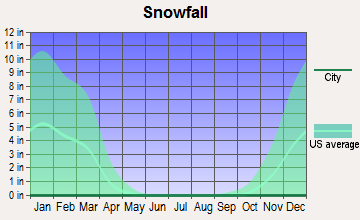
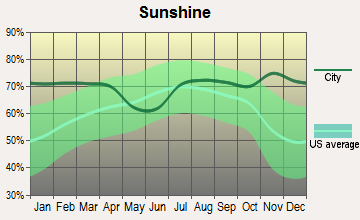
Weather
Weather patterns in the Upper San Gabriel Valley and West Covina are quite similar, given their geographic proximity in Southern California. Both enjoy a Mediterranean climate, with warm, dry summers and mild to cool, wet winters. Temperatures rarely become extreme, making both places an appealing choice for those who enjoy a warm climate year-round.
Weather and climate
Type
Upper San Gabriel Valley
West Covina
Temperature - Average
63.5°F
65.4°F
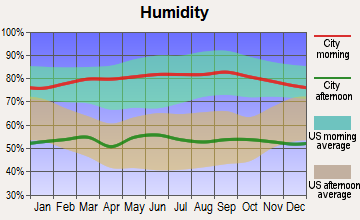
Humidity - Average morning or afternoon humidity
62.2%
64%
Humidity - Differences between morning and afternoon humidity
17.3%
19%
Humidity - Maximum monthly morning or afternoon humidity
67%
69.7%
Humidity - Minimum monthly morning or afternoon humidity
49.7%
50.7%
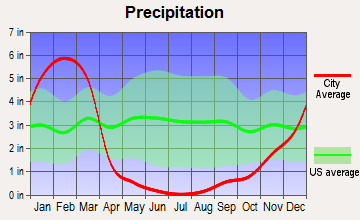
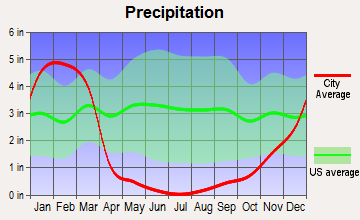
Precipitation - Yearly average
24.3 in
20.7 in
Snowfall - Yearly average
0 in
0 in
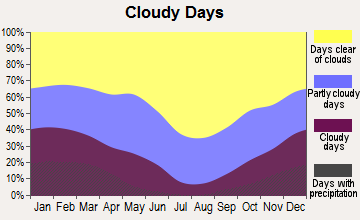
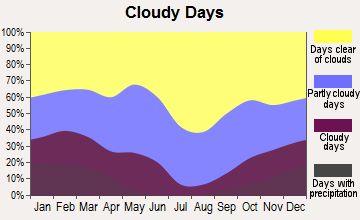
Clouds - Number of days clear of clouds
29.4%
28.4%
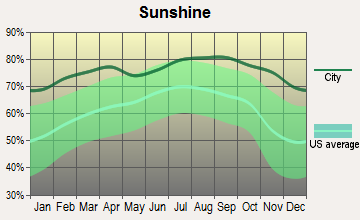
Sunshine amount - Average
78.4%
78.4%
Sunshine amount - Differences during a year
22%
22%
Sunshine amount - Maximum monthly
85%
85%
Sunshine amount - Minimum monthly
63%
63%
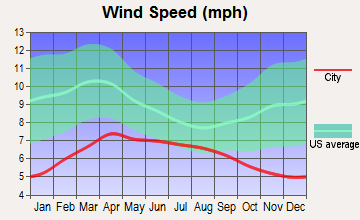
Wind speed - Average
2.6 mph
3.4 mph
Average climate in Upper San Gabriel Valley, California
Average climate in West Covina, California
Air pollution
Type
AQI
CO
NO2
OZONE
PB
PM10
PM25
SO2
Year
Upper San Gabriel Valley
West Covina
Upper San Gabriel Valley
West Covina
Upper San Gabriel Valley
West Covina
Upper San Gabriel Valley
West Covina
Upper San Gabriel Valley
West Covina
Upper San Gabriel Valley
West Covina
Upper San Gabriel Valley
West Covina
Upper San Gabriel Valley
West Covina
2018
142
144
0.37
0.36
14.2
14.1
28.5
29.0
0.007
0.007
28.5
29.9
14.1
13.5
0.4
0.4
2017
146
151
0.36
0.36
15.1
14.9
29.8
30.2
0.007
0.007
31.2
32.8
14.0
13.2
0.5
0.5
2016
136
141
0.33
0.33
15.5
15.6
28.1
28.9
0.007
0.007
28.6
30.1
13.0
12.4
0.4
0.5
2015
143
146
0.33
0.32
15.2
15.2
28.4
29.6
0.007
0.007
28.4
29.9
15.2
14.8
0.3
0.4
2014
141
143
0.35
0.34
16.7
16.8
28.0
28.8
0.007
0.007
31.3
33.2
14.9
13.1
0.5
0.5
2013
144
148
0.39
0.36
17.3
17.1
26.6
27.1
0.007
0.007
29.3
31.3
14.4
12.7
0.4
0.5
2012
148
149
0.43
0.40
18.2
18.4
25.9
26.5
0.006
0.005
28.7
30.6
16.5
15.6
0.5
0.6
2011
146
149
0.47
0.42
19.1
18.5
24.8
25.9
0.008
0.008
28.9
30.1
17.6
17.4
0.5
0.6
2010
133
139
0.48
0.44
19.2
19.2
24.6
26.0
0.011
0.009
27.0
26.7
15.5
15.1
0.5
0.6
2009
153
156
0.39
0.40
21.0
20.6
25.4
27.0
0.011
0.010
32.0
27.6
17.2
16.6
0.4
0.6
2008
155
156
0.54
0.50
23.1
22.6
24.9
26.6
0.013
0.012
32.1
28.6
16.9
15.9
0.6
0.9
2007
135
135
0.55
0.51
24.6
24.8
23.1
24.2
0.016
0.015
N/A
N/A
N/A
N/A
1.0
1.2
2006
128
128
0.58
0.54
24.9
24.9
22.8
23.6
0.009
0.009
N/A
N/A
N/A
N/A
1.5
1.5
2005
128
128
0.61
0.57
25.4
25.6
21.3
22.0
0.015
0.014
N/A
N/A
N/A
N/A
1.7
1.8
2004
134
134
0.71
0.66
26.0
25.2
23.8
24.2
0.018
0.017
N/A
N/A
N/A
N/A
2.4
2.0
2003
143
139
0.89
0.79
30.7
30.0
23.3
23.8
0.025
0.024
N/A
N/A
N/A
N/A
1.6
1.5
2002
137
136
0.91
0.82
32.5
31.6
21.9
22.2
0.022
0.021
N/A
N/A
N/A
N/A
2.2
2.1
2001
143
143
1.04
0.98
33.1
32.2
20.1
20.6
0.031
0.028
N/A
N/A
N/A
N/A
2.3
1.9
2000
151
151
1.07
1.02
33.5
34.5
20.1
20.3
0.028
0.025
N/A
N/A
N/A
N/A
1.3
1.4
Natural disasters
Type
Upper San Gabriel Valley
West Covina
Tornado activity compared to U.S. average
18%
18.6%
Earthquake activity compared to U.S. average
7,264.5%
7,258.6%
Natural disasters compared to U.S. average
57%
57%
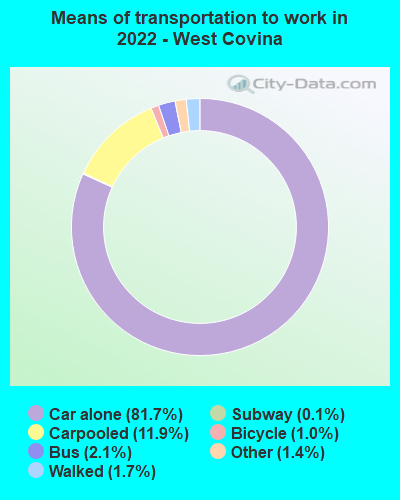
Transportation
Both areas are served by the Los Angeles County Metropolitan Transportation Authority (Metro), providing regular bus services. Additionally, the Upper San Gabriel Valley is served by the Metrolink train service, offering a convenient commuting option. Traffic can be heavy during peak times in both areas, but they enjoy close proximity to major freeways.
Transport
Type
Upper San Gabriel Valley
West Covina
Amtrak stations nearby
3
3
FAA registered aircraft
0
24
FAA registered aircraft manufacturers and dealers
0
3
Means of transportation to work
Type
Upper San Gabriel Valley
West Covina
Bicycle
1.1%
1%
Bus
3.9%
2.1%
Carpooled
16.6%
10.2%
Car alone
71.1%
83.6%
Motorcycle
0.1%
0.2%
Railroad
0.1%
0.8%
Streetcar
0.1%
0.2%
Taxicab
0.1%
0%
Walked
3.2%
1.6%
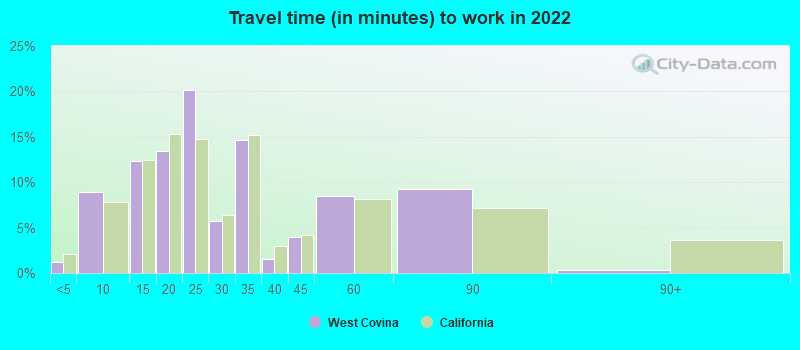
Average travel time to work
Type
Upper San Gabriel Valley
West Covina
Average
29.1 min
27.6 min
Real Estate
Real estate is higher in the Upper San Gabriel Valley than in West Covina due to its higher perceived desirability, including top-ranking school districts. West Covina offers more affordable housing options, making it potentially more attractive to younger families or those with lower incomes.
Neighborhoods
The neighborhoods in the Upper San Gabriel Valley are generally more affluent, with larger properties and higher property values. West Covina, on the other hand, offers a mix of residential areas, with some offering affordable housing options. Both places have family-friendly neighborhoods with safe and clean environments.
Houses and residents
Type
Upper San Gabriel Valley
West Covina
Houses
99,295
33,792
Average household size (people)
3.3
3.3
Houses occupied
96,186 (96.9%)
32,012 (94.7%)
Houses occupied by owners
52,398 (54.5%)
19,752 (61.7%)
Houses occupied by renters
43,788 (45.5%)
12,260 (38.3%)
Median rent asked for vacant for-rent units
$1,771
$1,233
Median price asked for vacant for-sale houses and condos
$1,138,428
$782,590
Estimated median house or condo value
$740,686
$636,300
Median number of rooms in apartments
3.7
4.2
Median number of rooms in houses and condos
5.9
6.1
Renting percentage
44.9%
34.5%
Housing density (houses/condos per square mile)
2,008.8
2,098.2
Household income disparities
44%
40.6%
Housing units without a mortgage
11,525 (24.8%)
195 (1.5%)
Housing units with both a second mortgage and home equity loan
Self-employed workers in own not incorporated business
10,209
3,571
State government workers
3,180
1,385
Unpaid family workers
401
43
Industries and Occupations
The most common industries in both places include health care, retail, and professional services. However, the Upper San Gabriel Valley attracts more high-tech and skilled professional occupations due to the presence of special economic zones and technology centers. West Covina has a larger retail industry, mainly due to its large shopping centers.
Health Care
Both areas are served by several hospitals and clinics, providing comprehensive health care services to residents. They have numerous medical specialists and healthcare facilities. West Covina is home to the Citrus Valley Medical Center, while the Upper San Gabriel Valley hosts several hospitals, including the well-regarded City of Hope cancer treatment center.
Infrastructure
The Upper San Gabriel Valley and West Covina both have solid infrastructures with well-maintained roads, reliable utilities, and numerous public facilities such as libraries, parks, and community centers. There is ongoing development, particularly in West Covina, with new commercial and residential projects enhancing its urban appeal.
Infrastructure
Type
Upper San Gabriel Valley
West Covina
TV stations
27
25
Culture and Food
Both areas offer rich cultural diversity and a thriving food scene. The Upper San Gabriel Valley is recognized for its authentic Asian cuisine, particularly Chinese food, thanks to a large Asian population. West Covina also boasts diverse dining options, including Latin American, Italian, and various fast-food chains. Numerous cultural events are held throughout the year in both areas.
Sports Teams
Neither the Upper San Gabriel Valley nor West Covina is home to major professional sports teams. Sports enthusiasts in both areas typically support teams from nearby Los Angeles, including the Lakers (NBA), Dodgers (MLB), Kings (NHL), Rams and Chargers (NFL).
 Upper San Gabriel Valley, CA
 West Covina, CA