
Covid-19 (novel coronavirus)
Coronavirus disease 2019 (COVID-19) is an infectious disease caused by the Severe Acute Respiratory Syndrome Coronavirus 2 (SARS-CoV-2). The disease has spread globally since 2019, resulting in the 2019–2023 coronavirus pandemic, with more than 660.000.000 confirmed global cases and 6.700.000 deaths. (more on Wikipedia)
Total number of confirmed cases in the United States: 103,804,111
COVID-19 vaccinations in the United States: 676,728,782
Show per state data »| # | State | Confirmed | Recovered | Active | Deaths |
|---|---|---|---|---|---|
| 1. | California | 12,129,699 | 0 | 0 | 101,159 |
| 2. | Texas | 8,466,220 | 0 | 0 | 93,390 |
| 3. | Florida | 7,574,590 | 0 | 0 | 86,850 |
| 4. | New York | 6,794,738 | 0 | 0 | 77,157 |
| 5. | Illinois | 4,083,292 | 0 | 0 | 41,496 |
| 6. | Pennsylvania | 3,527,854 | 0 | 0 | 50,398 |
| 7. | North Carolina | 3,472,644 | 0 | 0 | 28,432 |
| 8. | Ohio | 3,400,652 | 0 | 0 | 41,796 |
| 9. | Georgia | 3,068,208 | 0 | 0 | 42,489 |
| 10. | Michigan | 3,064,125 | 0 | 0 | 42,205 |
| 11. | New Jersey | 3,048,984 | 0 | 0 | 36,015 |
| 12. | Tennessee | 2,515,130 | 0 | 0 | 29,263 |
| 13. | Arizona | 2,443,514 | 0 | 0 | 33,102 |
| 14. | Virginia | 2,291,951 | 0 | 0 | 23,666 |
| 15. | Massachusetts | 2,224,337 | 0 | 0 | 24,333 |
| 16. | Indiana | 2,051,104 | 0 | 0 | 26,115 |
| 17. | Wisconsin | 2,006,582 | 0 | 0 | 16,375 |
| 18. | Washington | 1,928,913 | 0 | 0 | 15,683 |
| 19. | South Carolina | 1,836,568 | 0 | 0 | 19,600 |
| 20. | Minnesota | 1,778,866 | 0 | 0 | 14,870 |
| 21. | Missouri | 1,777,380 | 0 | 0 | 22,870 |
| 22. | Colorado | 1,765,938 | 0 | 0 | 14,181 |
| 23. | Kentucky | 1,718,471 | 0 | 0 | 18,130 |
| 24. | Alabama | 1,644,533 | 0 | 0 | 21,032 |
| 25. | Louisiana | 1,573,810 | 0 | 0 | 18,766 |
| 26. | Maryland | 1,365,297 | 0 | 0 | 16,544 |
| 27. | Oklahoma | 1,290,929 | 0 | 0 | 17,972 |
| 28. | Puerto Rico | 1,101,469 | 0 | 0 | 5,823 |
| 29. | Utah | 1,090,346 | 0 | 0 | 5,298 |
| 30. | Arkansas | 1,006,883 | 0 | 0 | 13,020 |
| 31. | Mississippi | 990,756 | 0 | 0 | 13,370 |
| 32. | Connecticut | 976,657 | 0 | 0 | 12,220 |
| 33. | Oregon | 963,564 | 0 | 0 | 9,373 |
| 34. | Kansas | 938,184 | 0 | 0 | 10,066 |
| 35. | Iowa | 903,991 | 0 | 0 | 10,725 |
| 36. | Nevada | 890,122 | 0 | 0 | 11,922 |
| 37. | New Mexico | 670,929 | 0 | 0 | 9,061 |
| 38. | West Virginia | 642,760 | 0 | 0 | 7,960 |
| 39. | Nebraska | 567,426 | 0 | 0 | 4,936 |
| 40. | Idaho | 521,120 | 0 | 0 | 5,416 |
| 41. | Rhode Island | 460,697 | 0 | 0 | 3,870 |
| 42. | Hawaii | 380,608 | 0 | 0 | 1,841 |
| 43. | New Hampshire | 378,428 | 0 | 0 | 3,003 |
| 44. | Delaware | 330,793 | 0 | 0 | 3,324 |
| 45. | Montana | 329,386 | 0 | 0 | 3,652 |
| 46. | Maine | 318,130 | 0 | 0 | 2,928 |
| 47. | Alaska | 307,655 | 0 | 0 | 1,486 |
| 48. | North Dakota | 286,950 | 0 | 0 | 2,470 |
| 49. | South Dakota | 279,130 | 0 | 0 | 3,190 |
| 50. | Wyoming | 185,385 | 0 | 0 | 2,004 |
| 51. | D.C. | 177,945 | 0 | 0 | 1,432 |
| 52. | Vermont | 152,618 | 0 | 0 | 929 |
| 53. | Guam | 61,051 | 0 | 0 | 420 |
| 54. | Virgin Islands | 24,813 | 0 | 0 | 130 |
| 55. | Northern Mariana Islands | 13,666 | 0 | 0 | 41 |
| 56. | American Samoa | 8,320 | 0 | 0 | 34 |
Vaccination data source: CDC. People initiating vaccination, (1st dose received). Updated: May 10, 2023
Coronavirus cases in USA graphs and animations
Interactive U.S. Coronavirus map: State and County level (updated 4:36 PM, May 25, 2024)

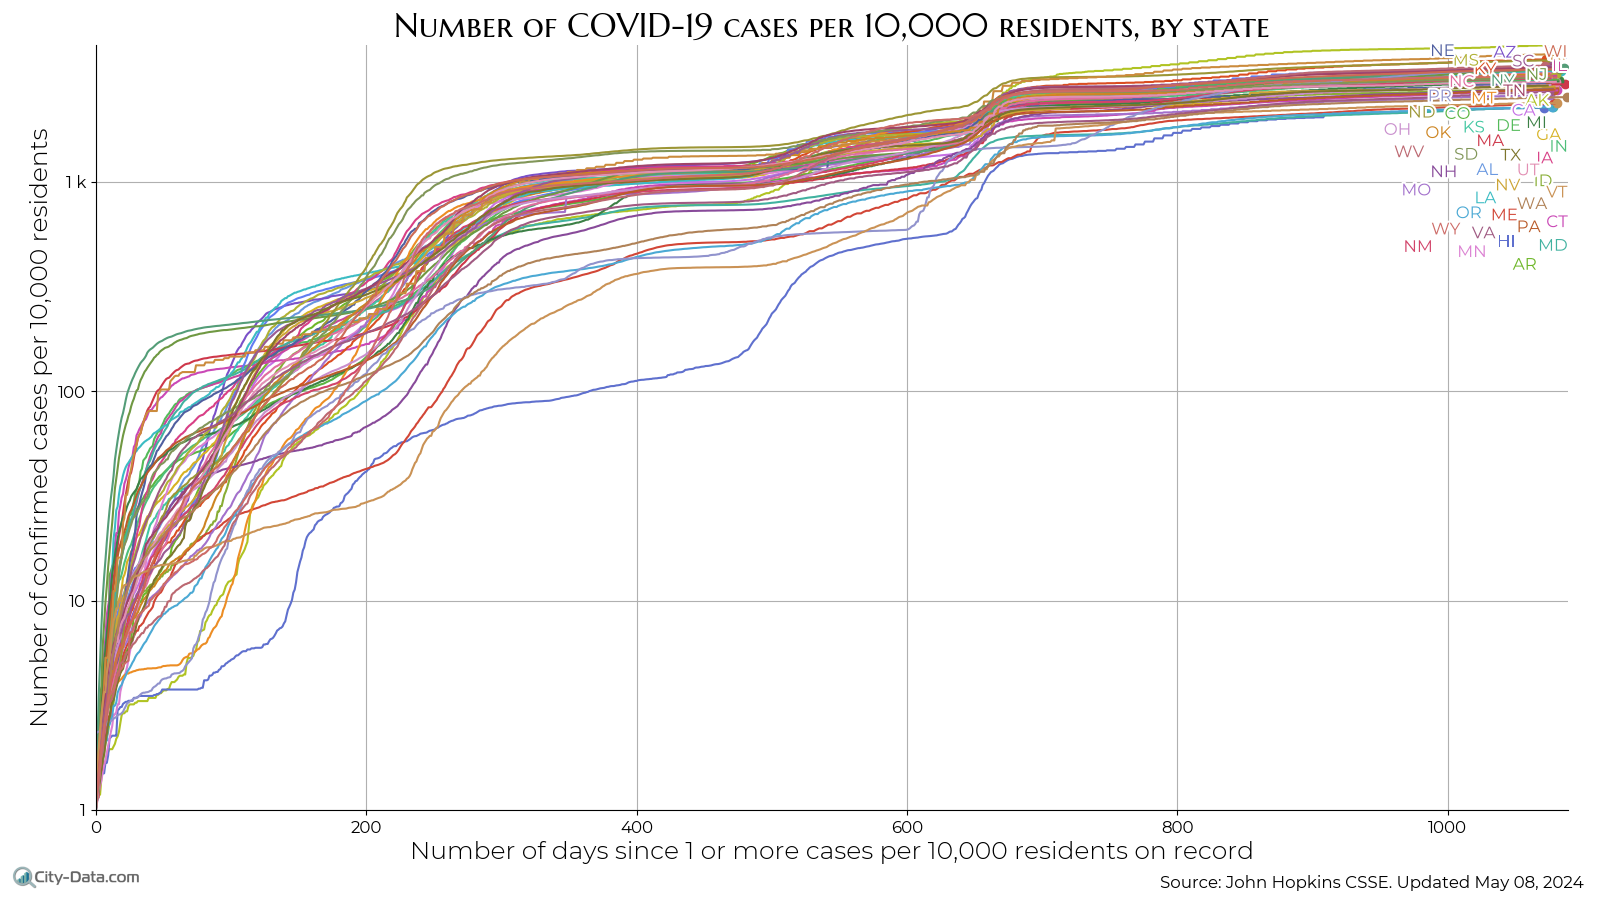
Coronavirus cases per 100k residents, by state May 25, 2024
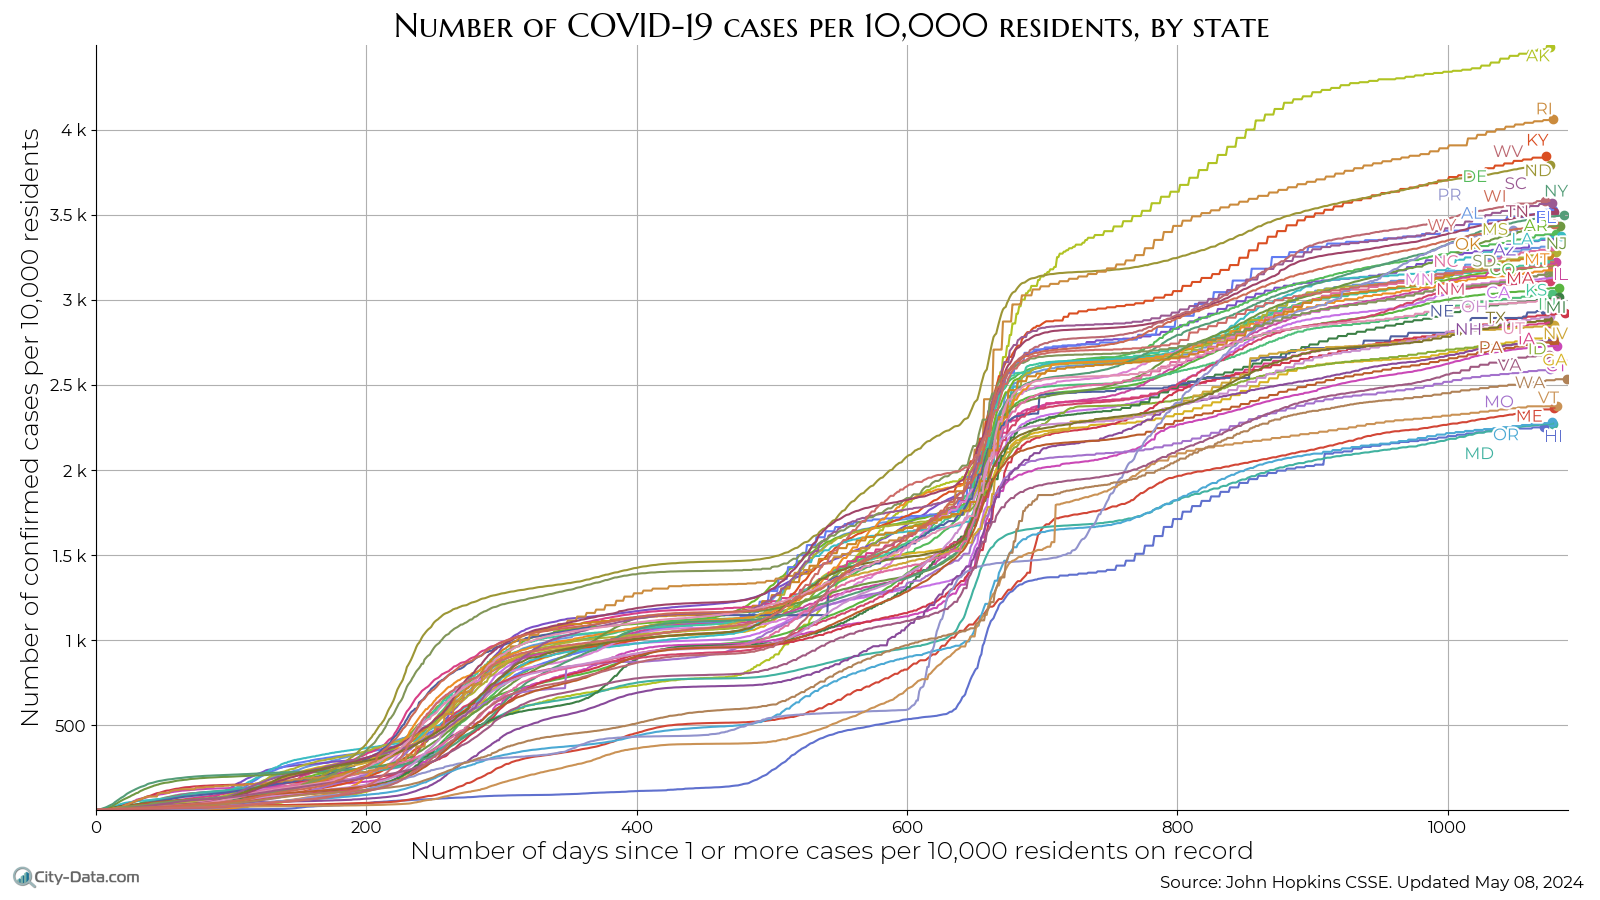
Coronavirus cases per 10k residents, by state, linear May 25, 2024
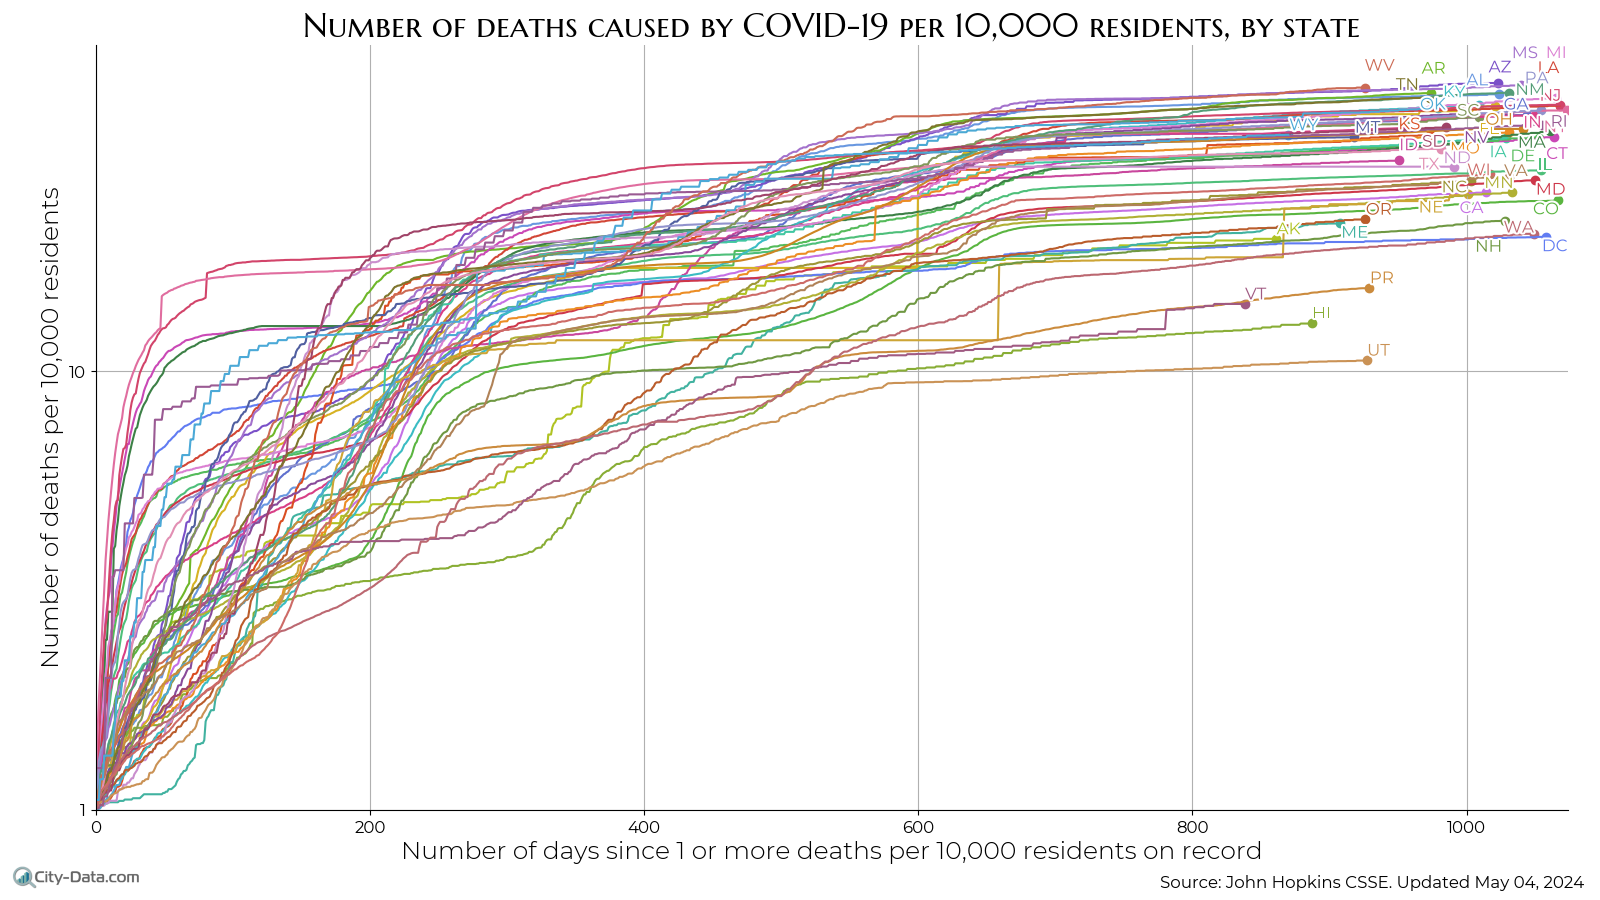
Coronavirus deaths per 100k residents, by state May 25, 2024
Coronavirus cases per state animation (updated Apr 27, 2021)
Coronavirus cases by state animation per 1 mln residents (updated Apr 27, 2021)
Heatmap of COVID-19 cases in the U.S. (updated Jul 08, 2020)
As of March 18, the top five most dense cities with population over 500,000 (New York City, San Francisco, Boston, Chicago, and Philadelphia) have 28.7% of the U.S. coronavirus cases while accounting for 4.4% of the population.
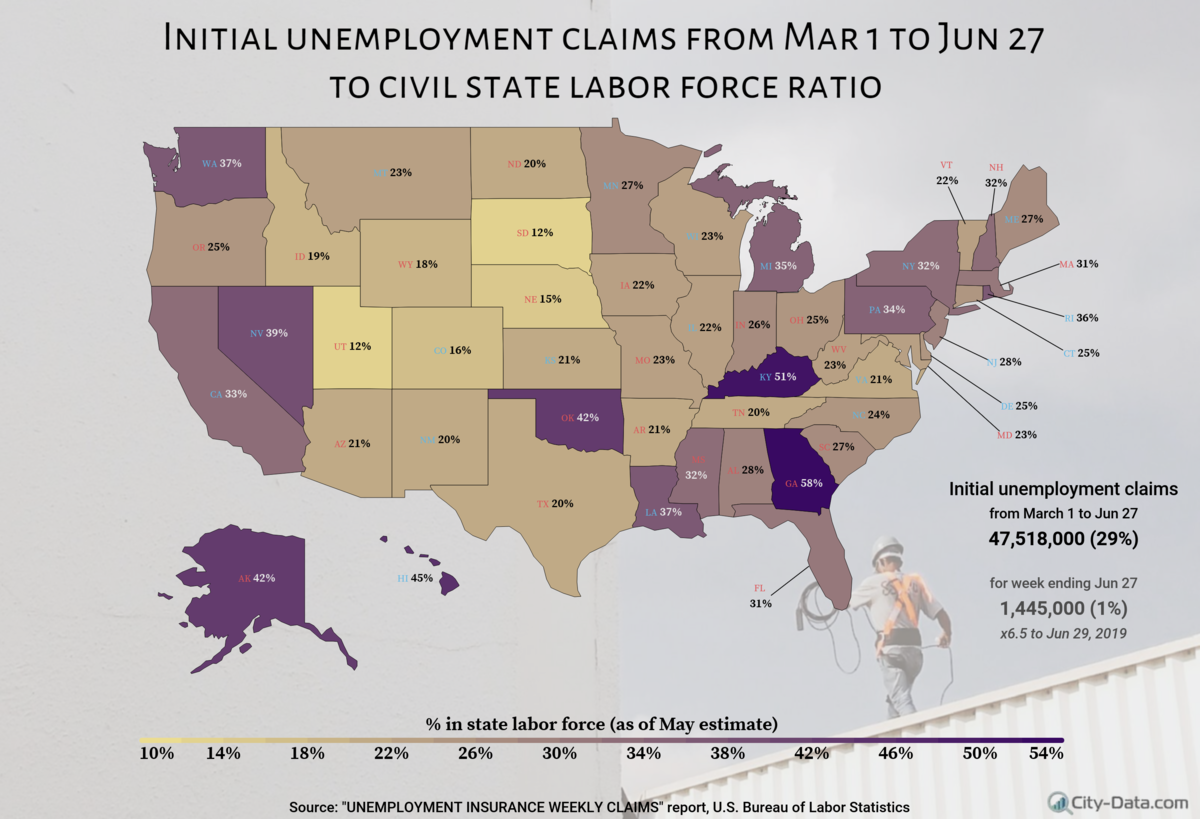
Unemployment Claims from Mar 1 to Jun 27 2020 to State Labor Force Ratio Jun 27, 2020

Coronavirus (COVID-19) cases per 1 million residents by state end of the day, March 13, 2020. Linear scale, WA truncated
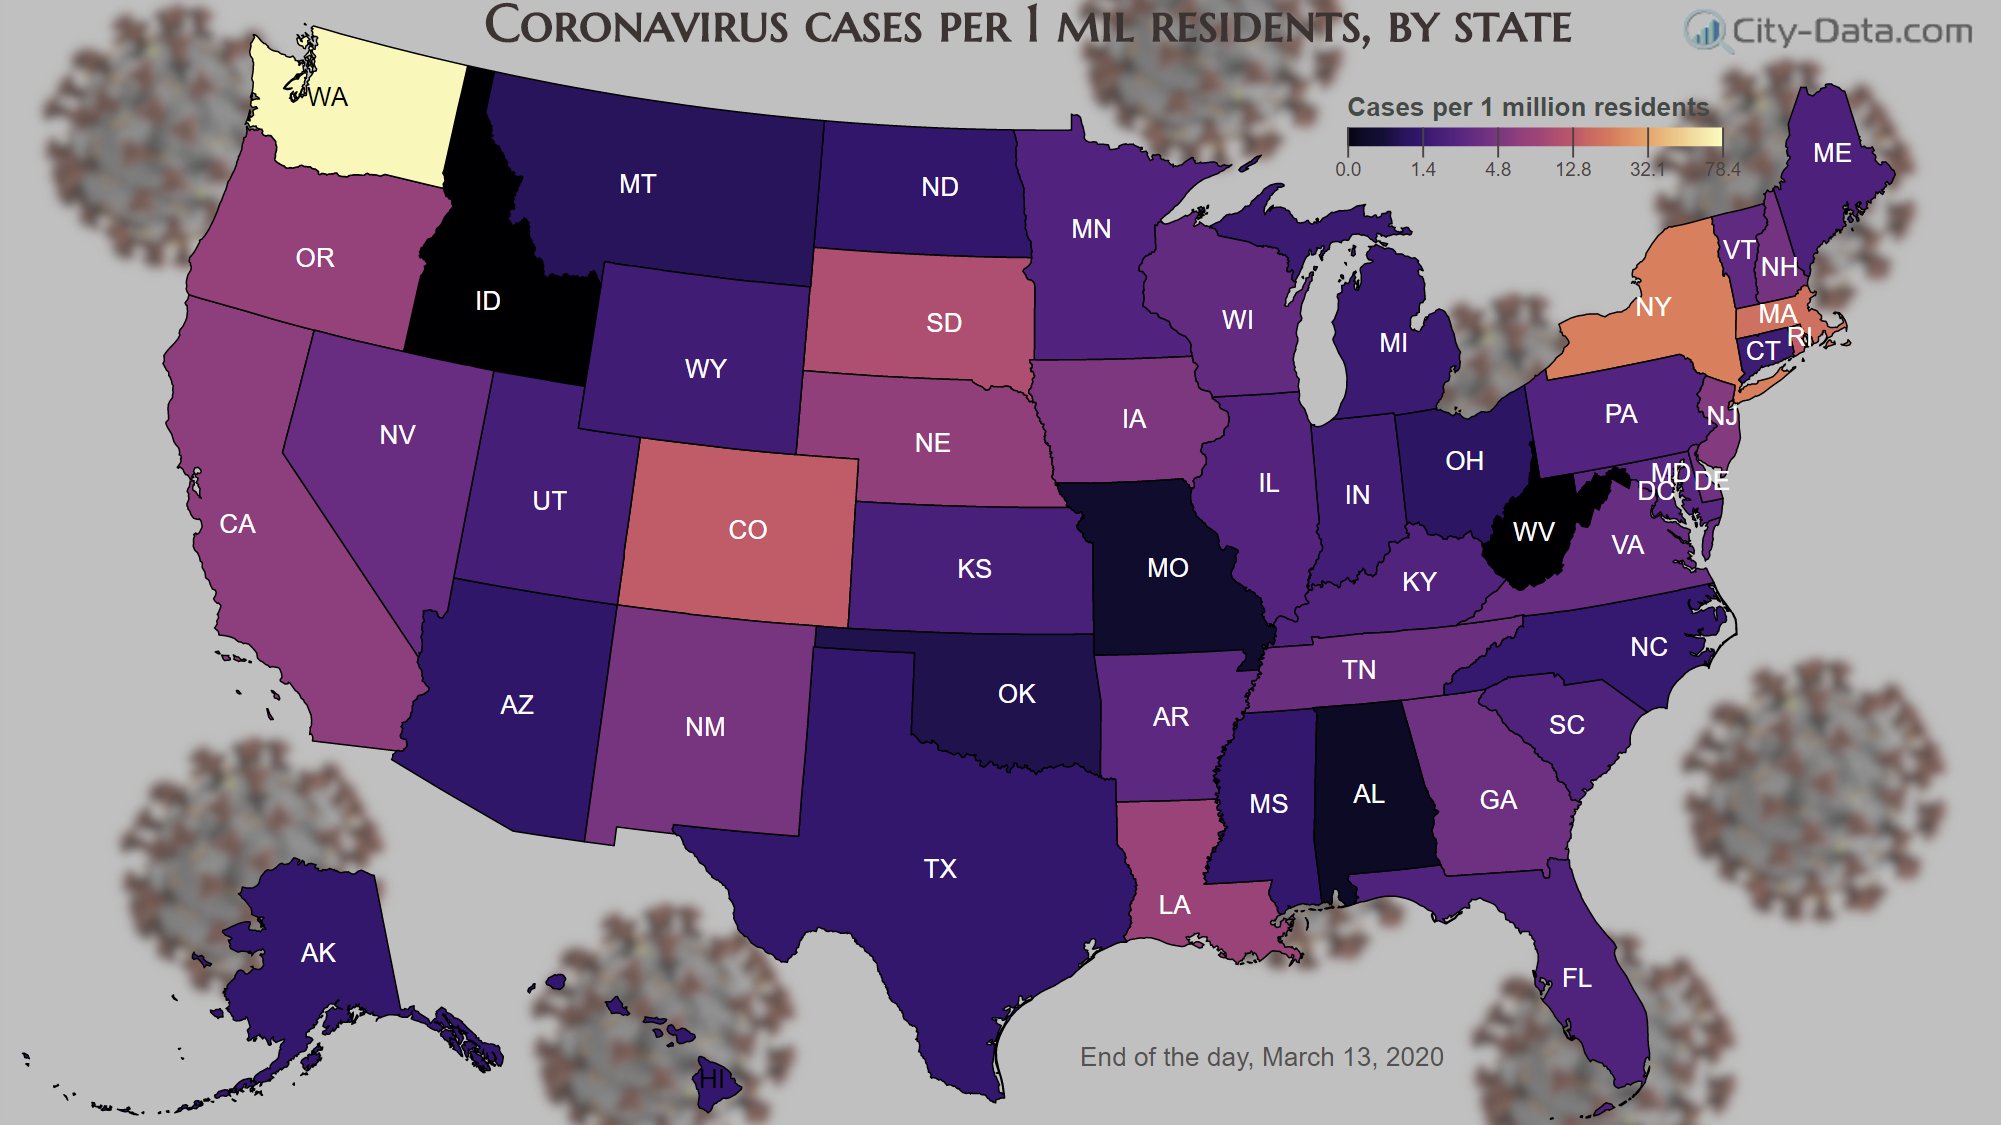
Coronavirus (COVID-19) cases per 1 million residents by state end of the day, March 13, 2020. Logarithmic scale
Daily COVID-19 cases per Capita vs Income for Counties (updated Jul 16, 2020)
Daily new COVID-19 cases per Capita vs Black+Hispanic Population Prc (updated Jul 15, 2020)
ICU beds in the U.S.
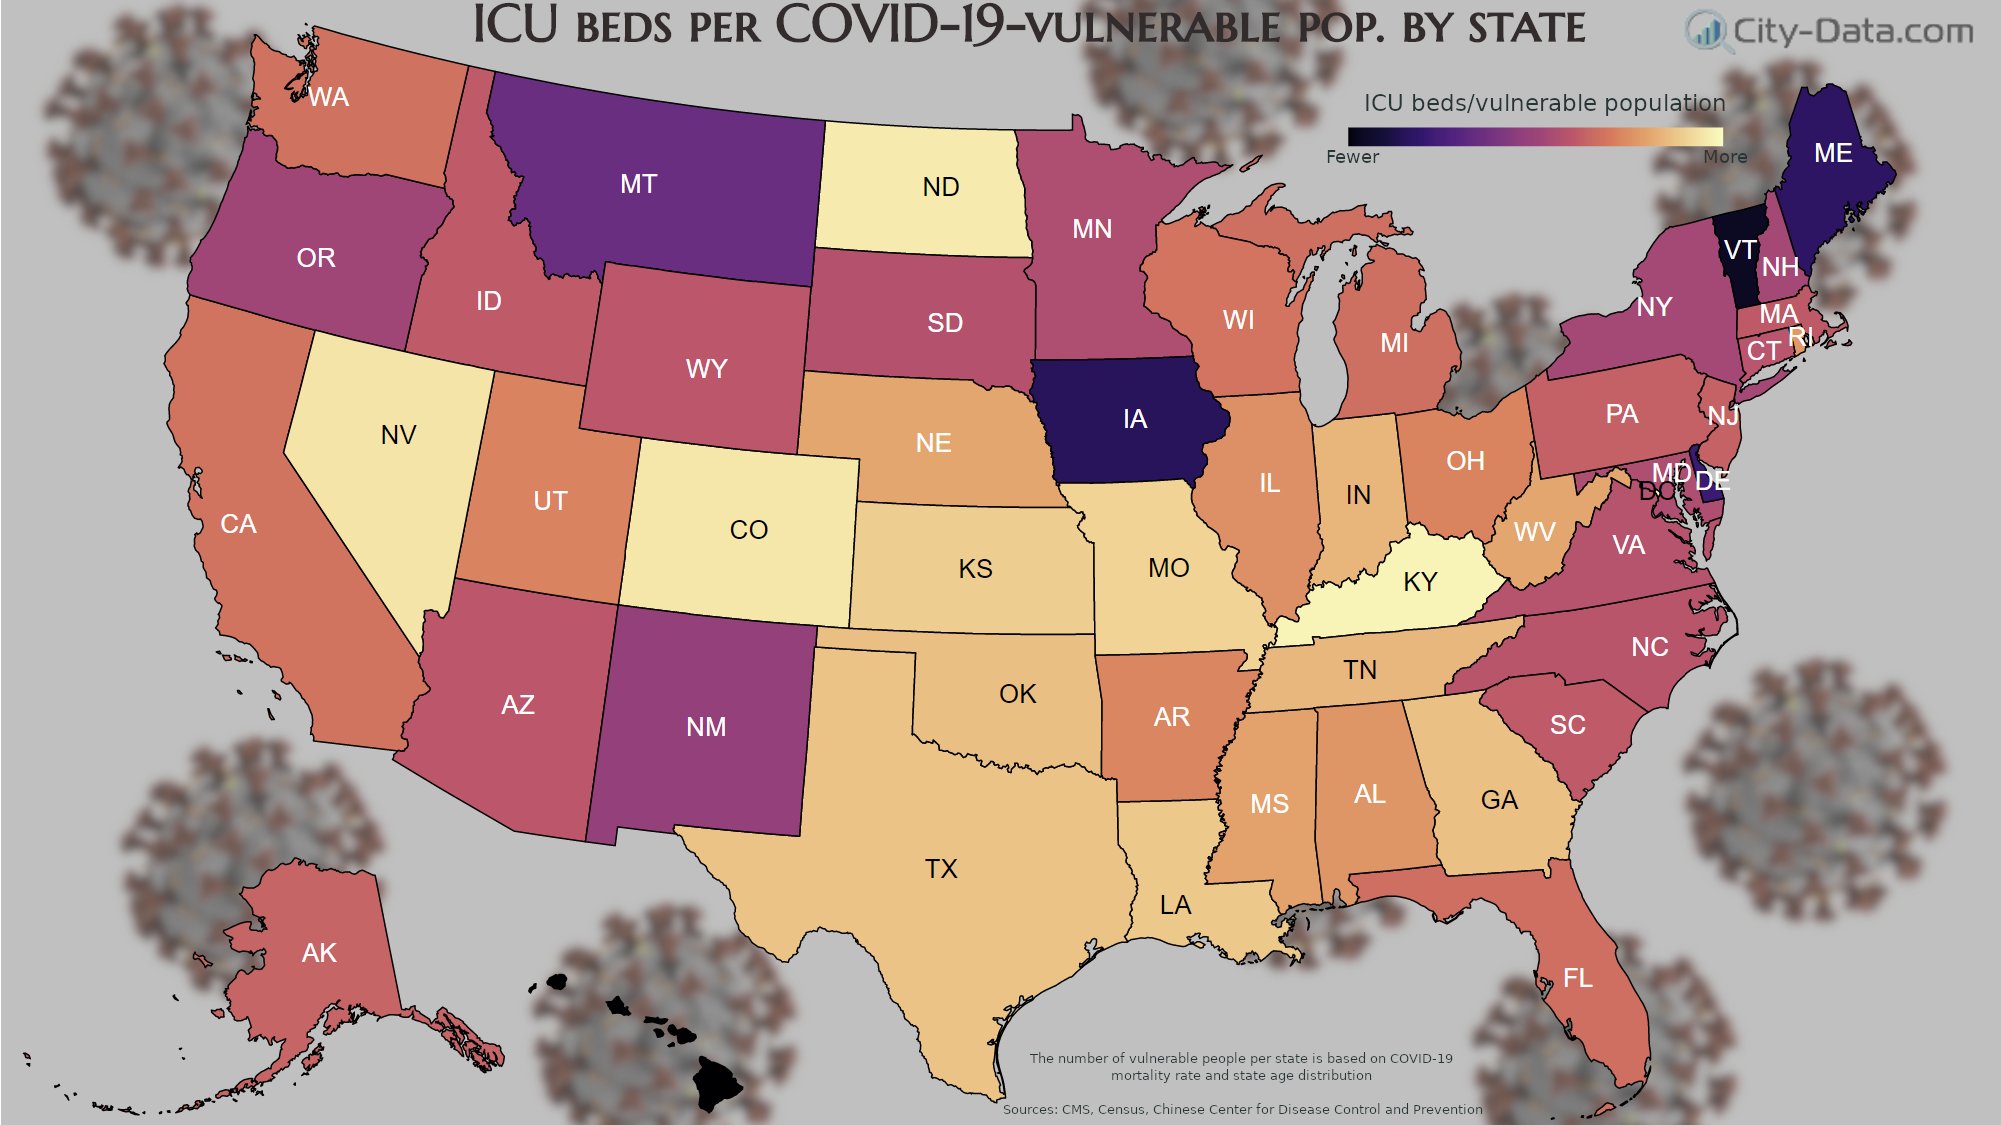
ICU beds per Coronavirus (COVID-19)-vulnerable population by state Mar 11, 2020
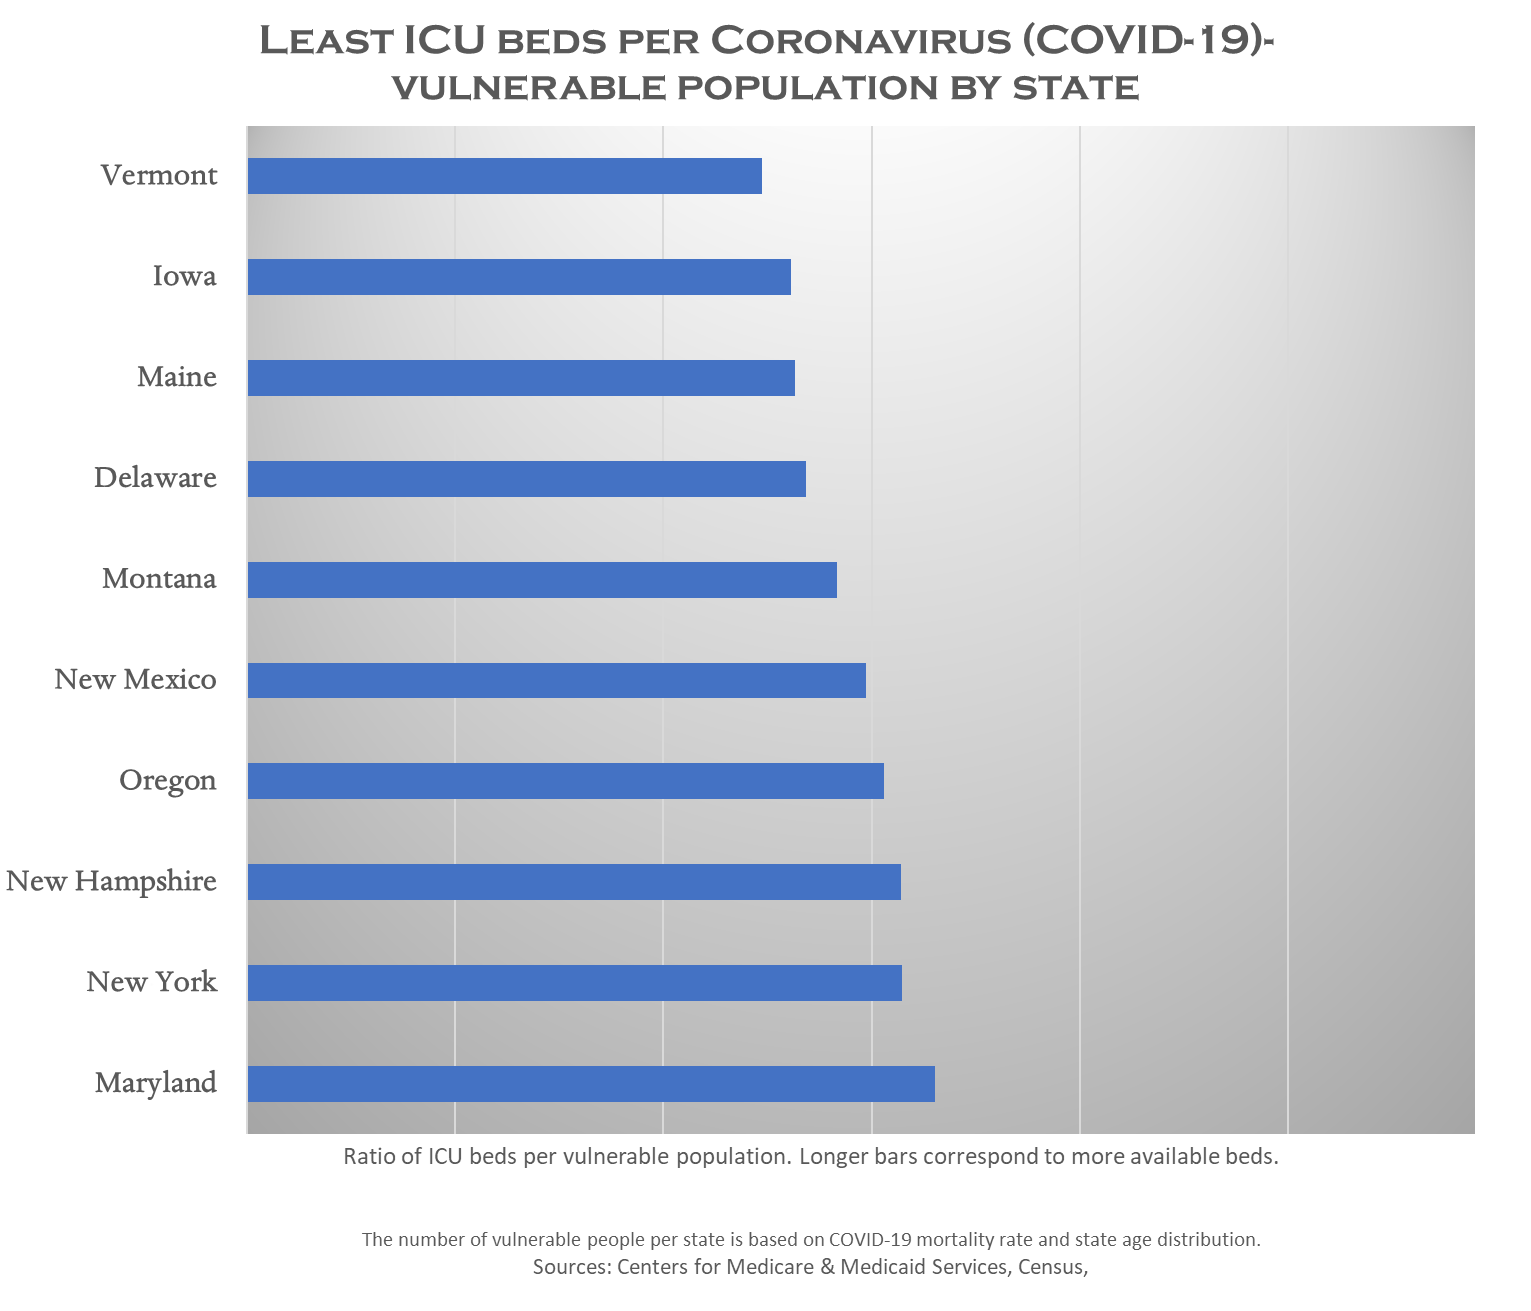
States that have proportionally the least available Intensive Care Unit (ICU) beds for Coronavirus-vulnerable population Mar 11, 2020
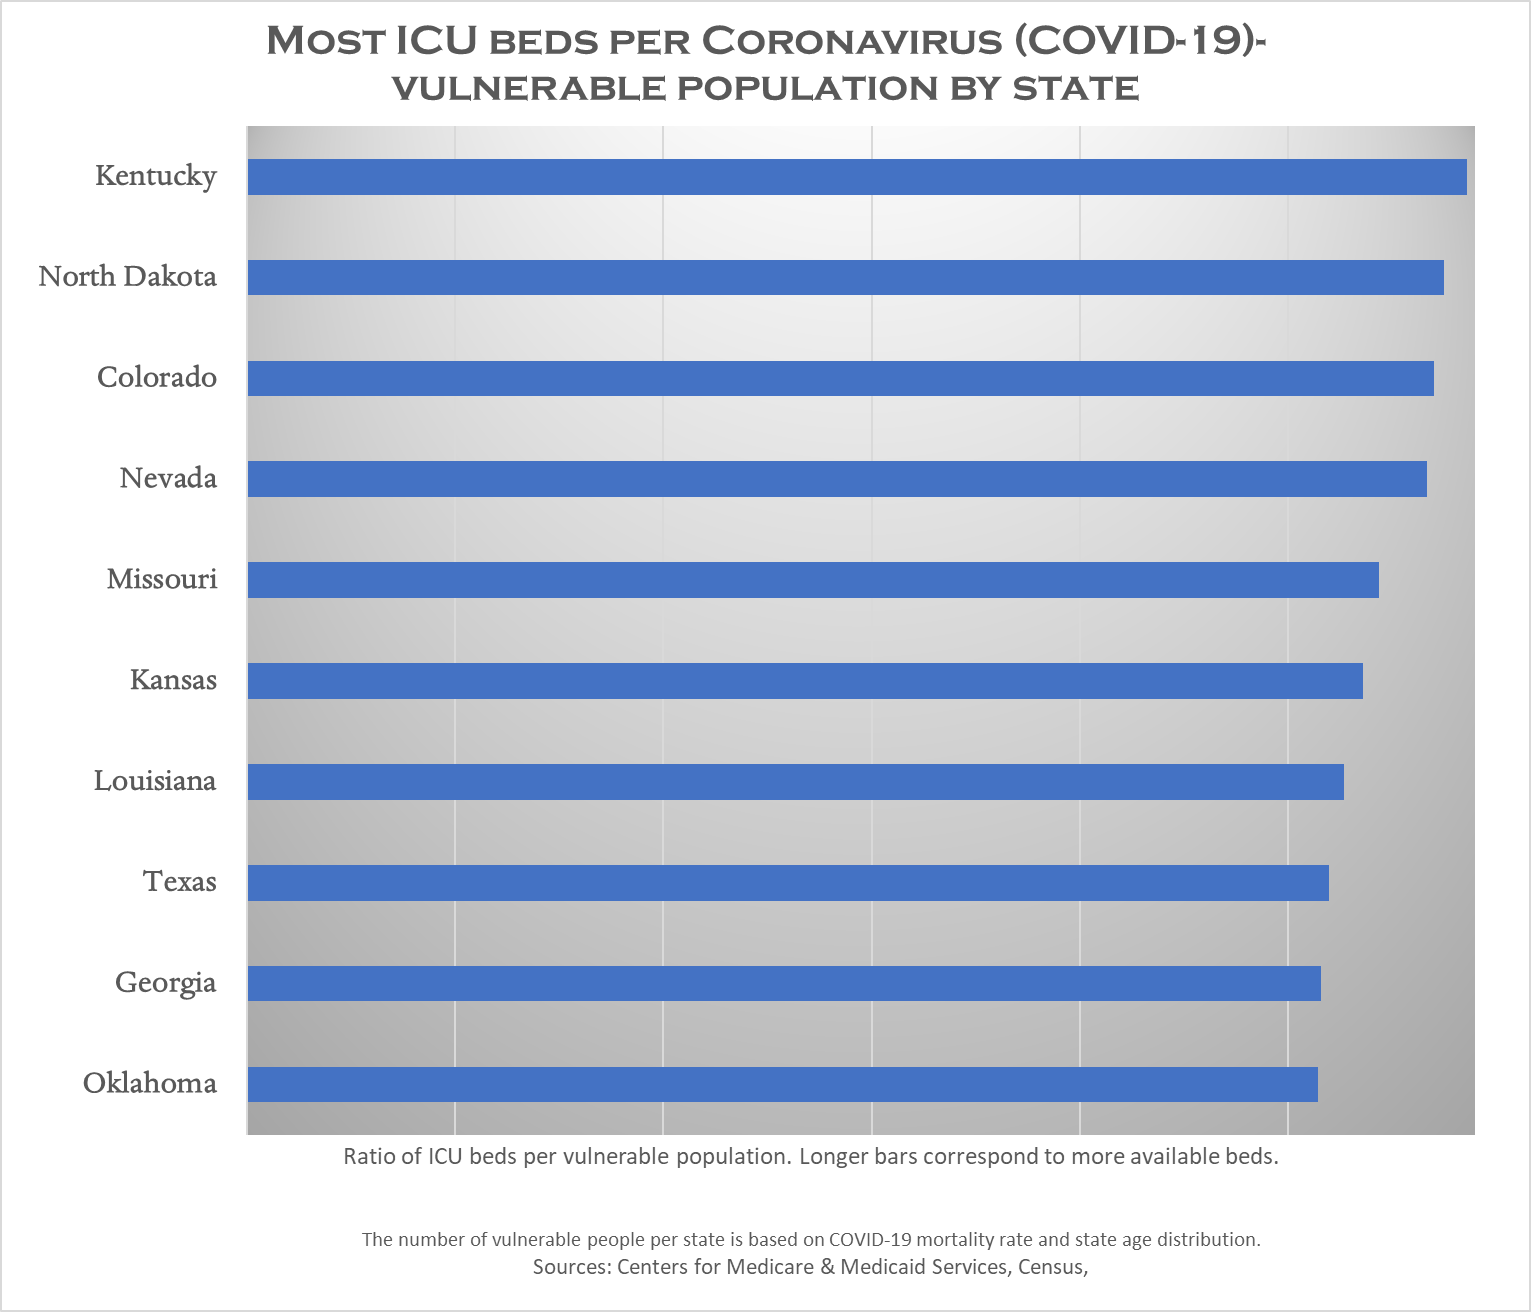
States that have proportionally the most available Intensive Care Unit (ICU) beds for Coronavirus-vulnerable population Mar 11, 2020
Global coronavirus coverage
Confirmed COVID-19 cases growth rate (updated May 25, 2020)
Confirmed COVID-19 cases per 1 million country residents (updated Apr 27, 2021)
Confirmed COVID-19 cases / deaths / recovered by country (updated Apr 27, 2021)
Coronavirus cases around the World, per 1 mln residents (updated May 28, 2020)
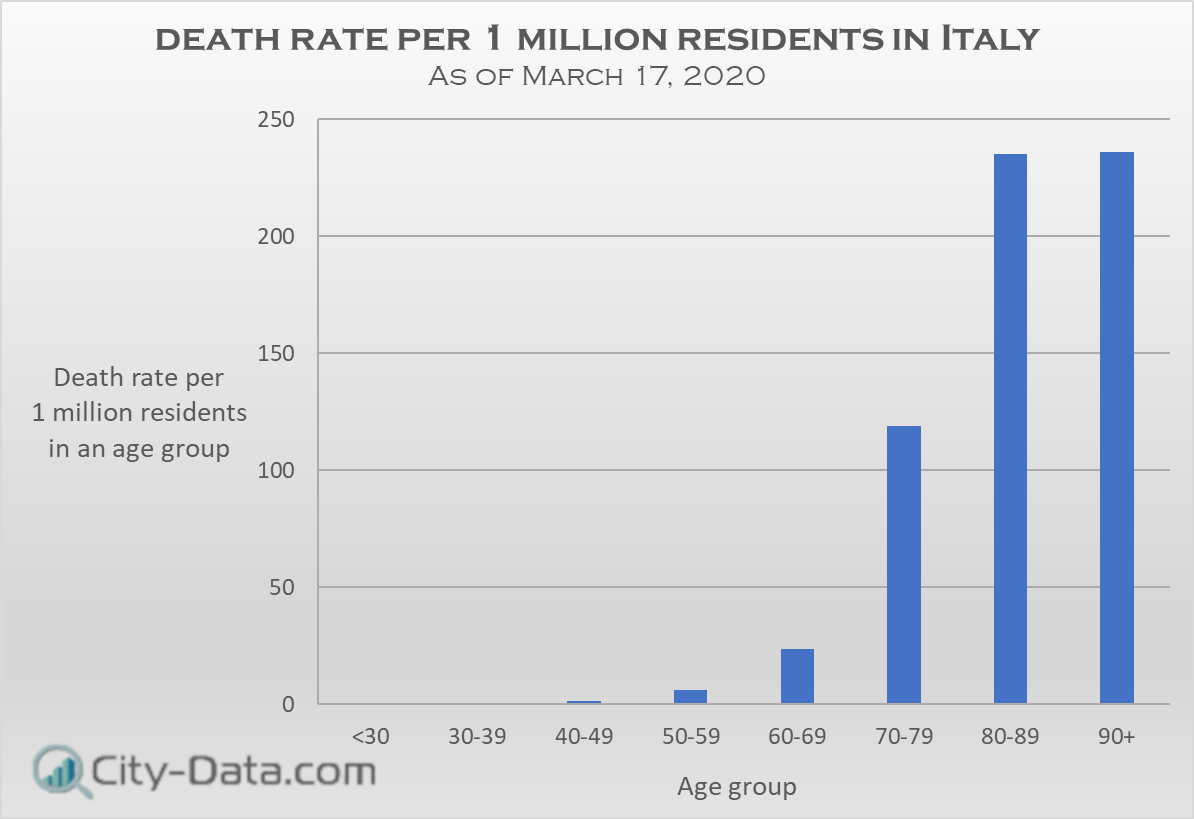
Death rate per 1 million residends in Italy as of Mar 17, 2020
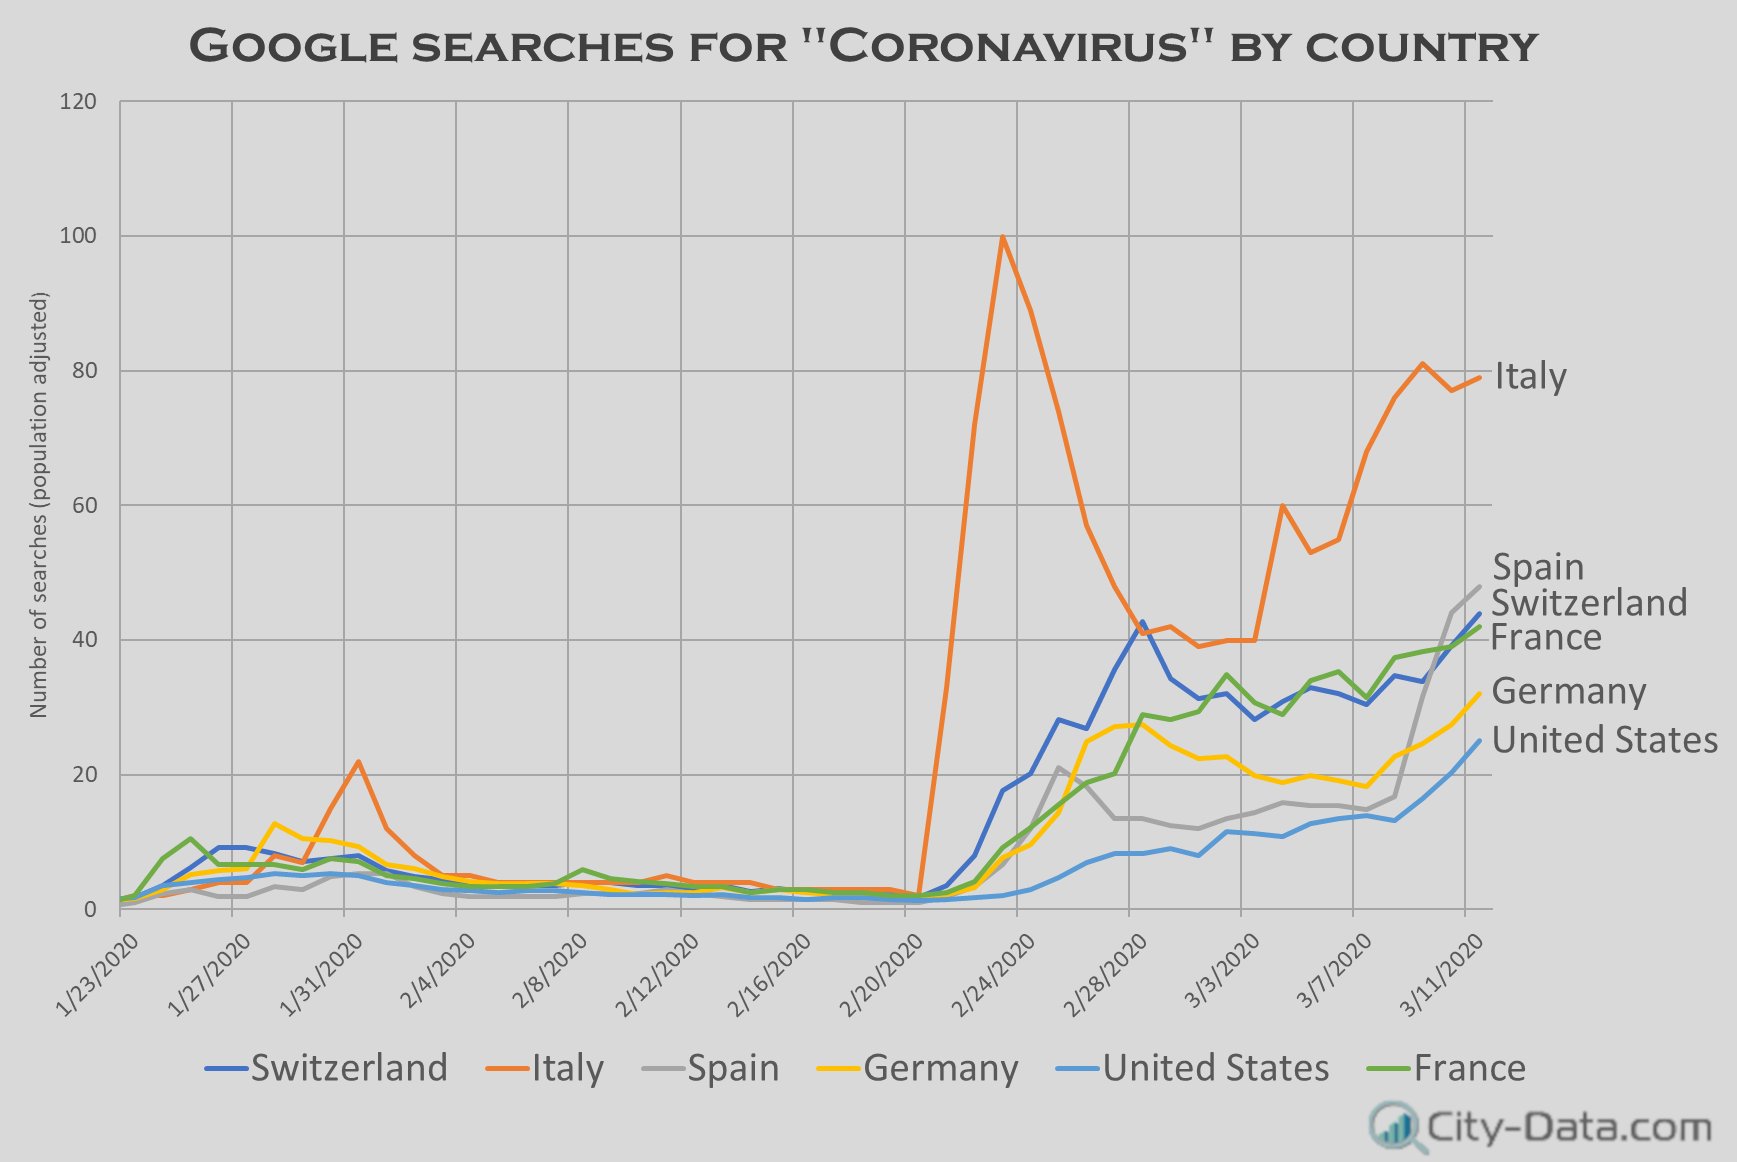
Google searches for "Coronavirus" by country Mar 14, 2020
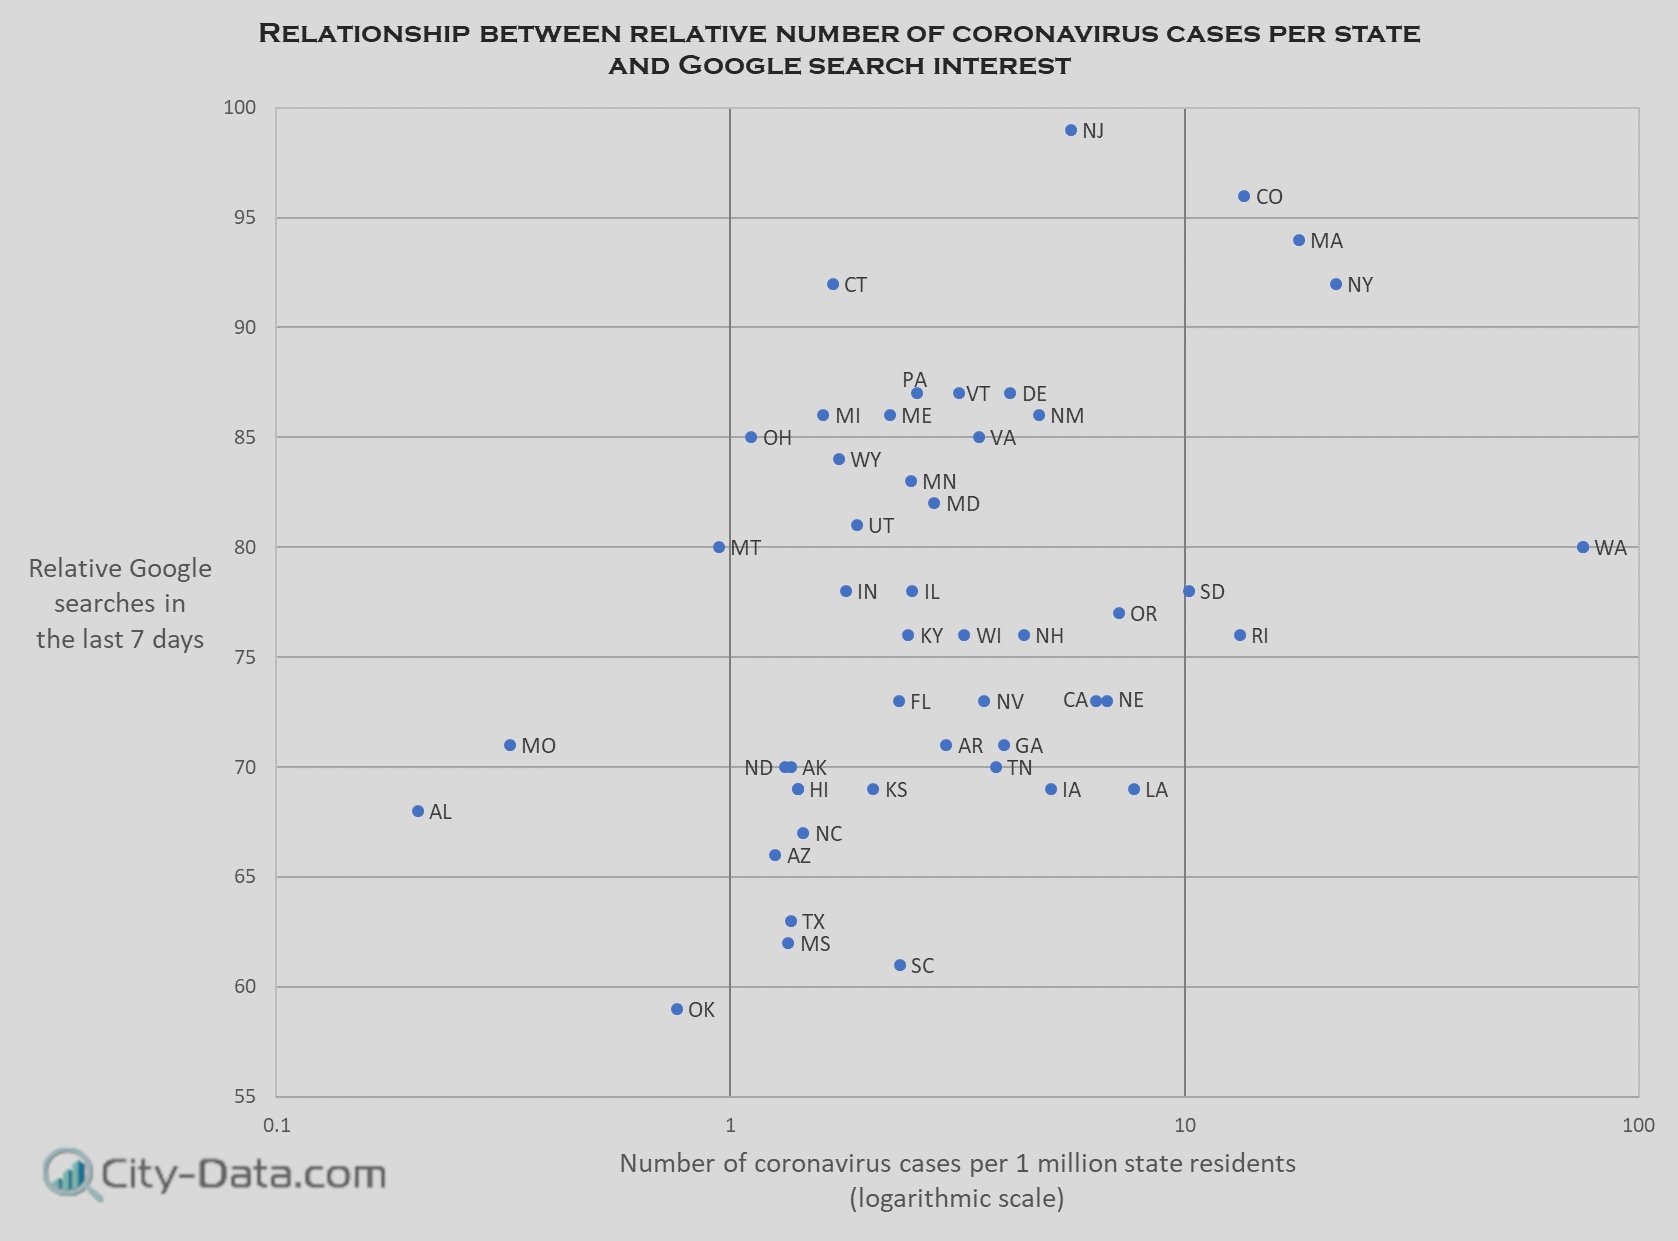
Relationship between relative number of coronavirus (COVID-19) cases per state and Google search interest. Logarithmic scale for the number of cases Mar 14, 2020
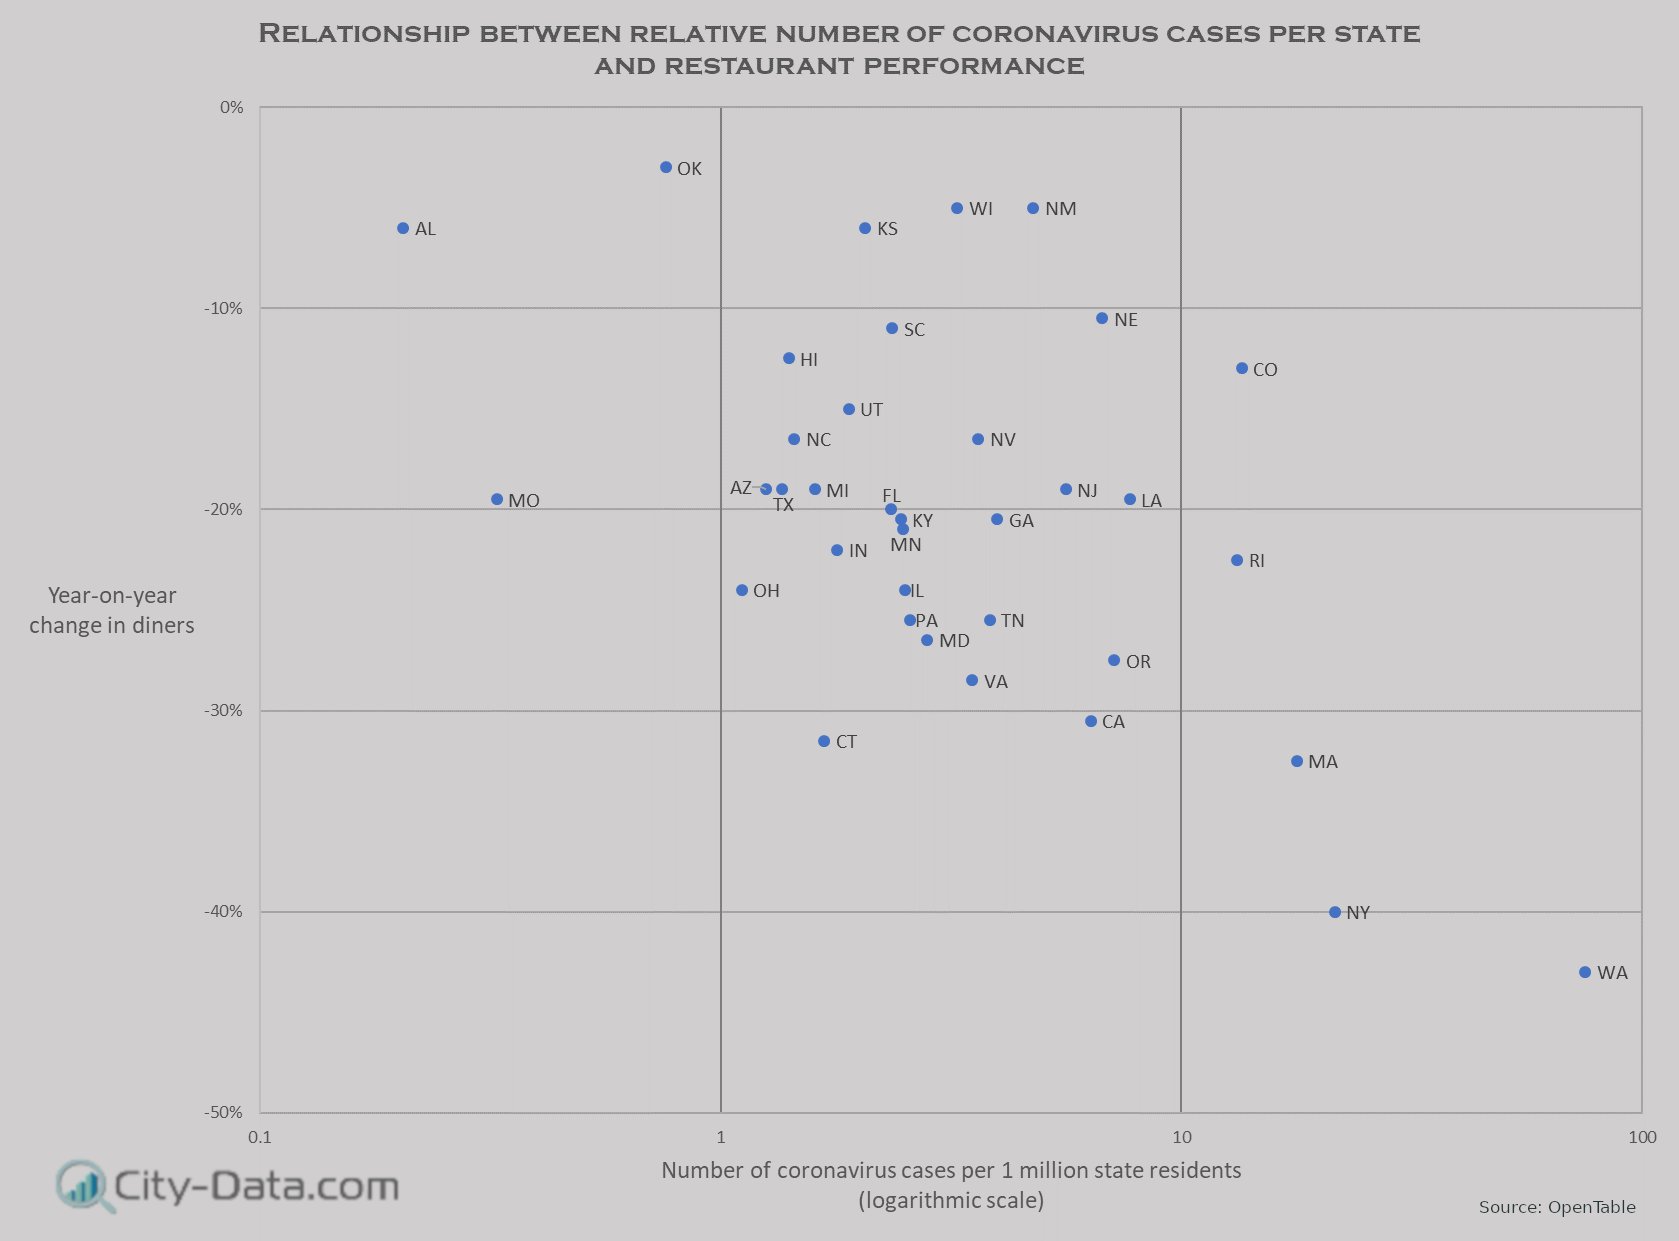
Relationship between relative number of coronavirus (COVID-19) cases per state and year-on-year restaurant performance based on OpenTable 3/11-3/12 data Mar 14, 2020
Coronavirus Forum Discussion

 | COVID: when do you know you will be ok? 8 replies, last: May 25, 7:50PM |
| Lady Gaga Reveals She Did Five Shows With COVID, Sparks Leftist Outrage 4 replies, last: May 25, 7:00PM |
| Sticky -General Covid discussion thread 4507 replies, last: May 25, 5:43PM |
| Color my hair? 94 replies, last: May 25, 4:47PM |
| Vaccine Hesitancy 109 replies, last: May 25, 4:22PM |
| My How Things Can Change 12 replies, last: May 25, 2:45PM |
| I Rode by My Old Home Church 13 replies, last: May 25, 2:28PM |
| good airfare-search site? 19 replies, last: May 25, 12:02PM |
| When does it make sense to rent vs own in Florida? 61 replies, last: May 25, 11:30AM |
| FL Horrible Health Care 25 replies, last: May 25, 11:05AM |

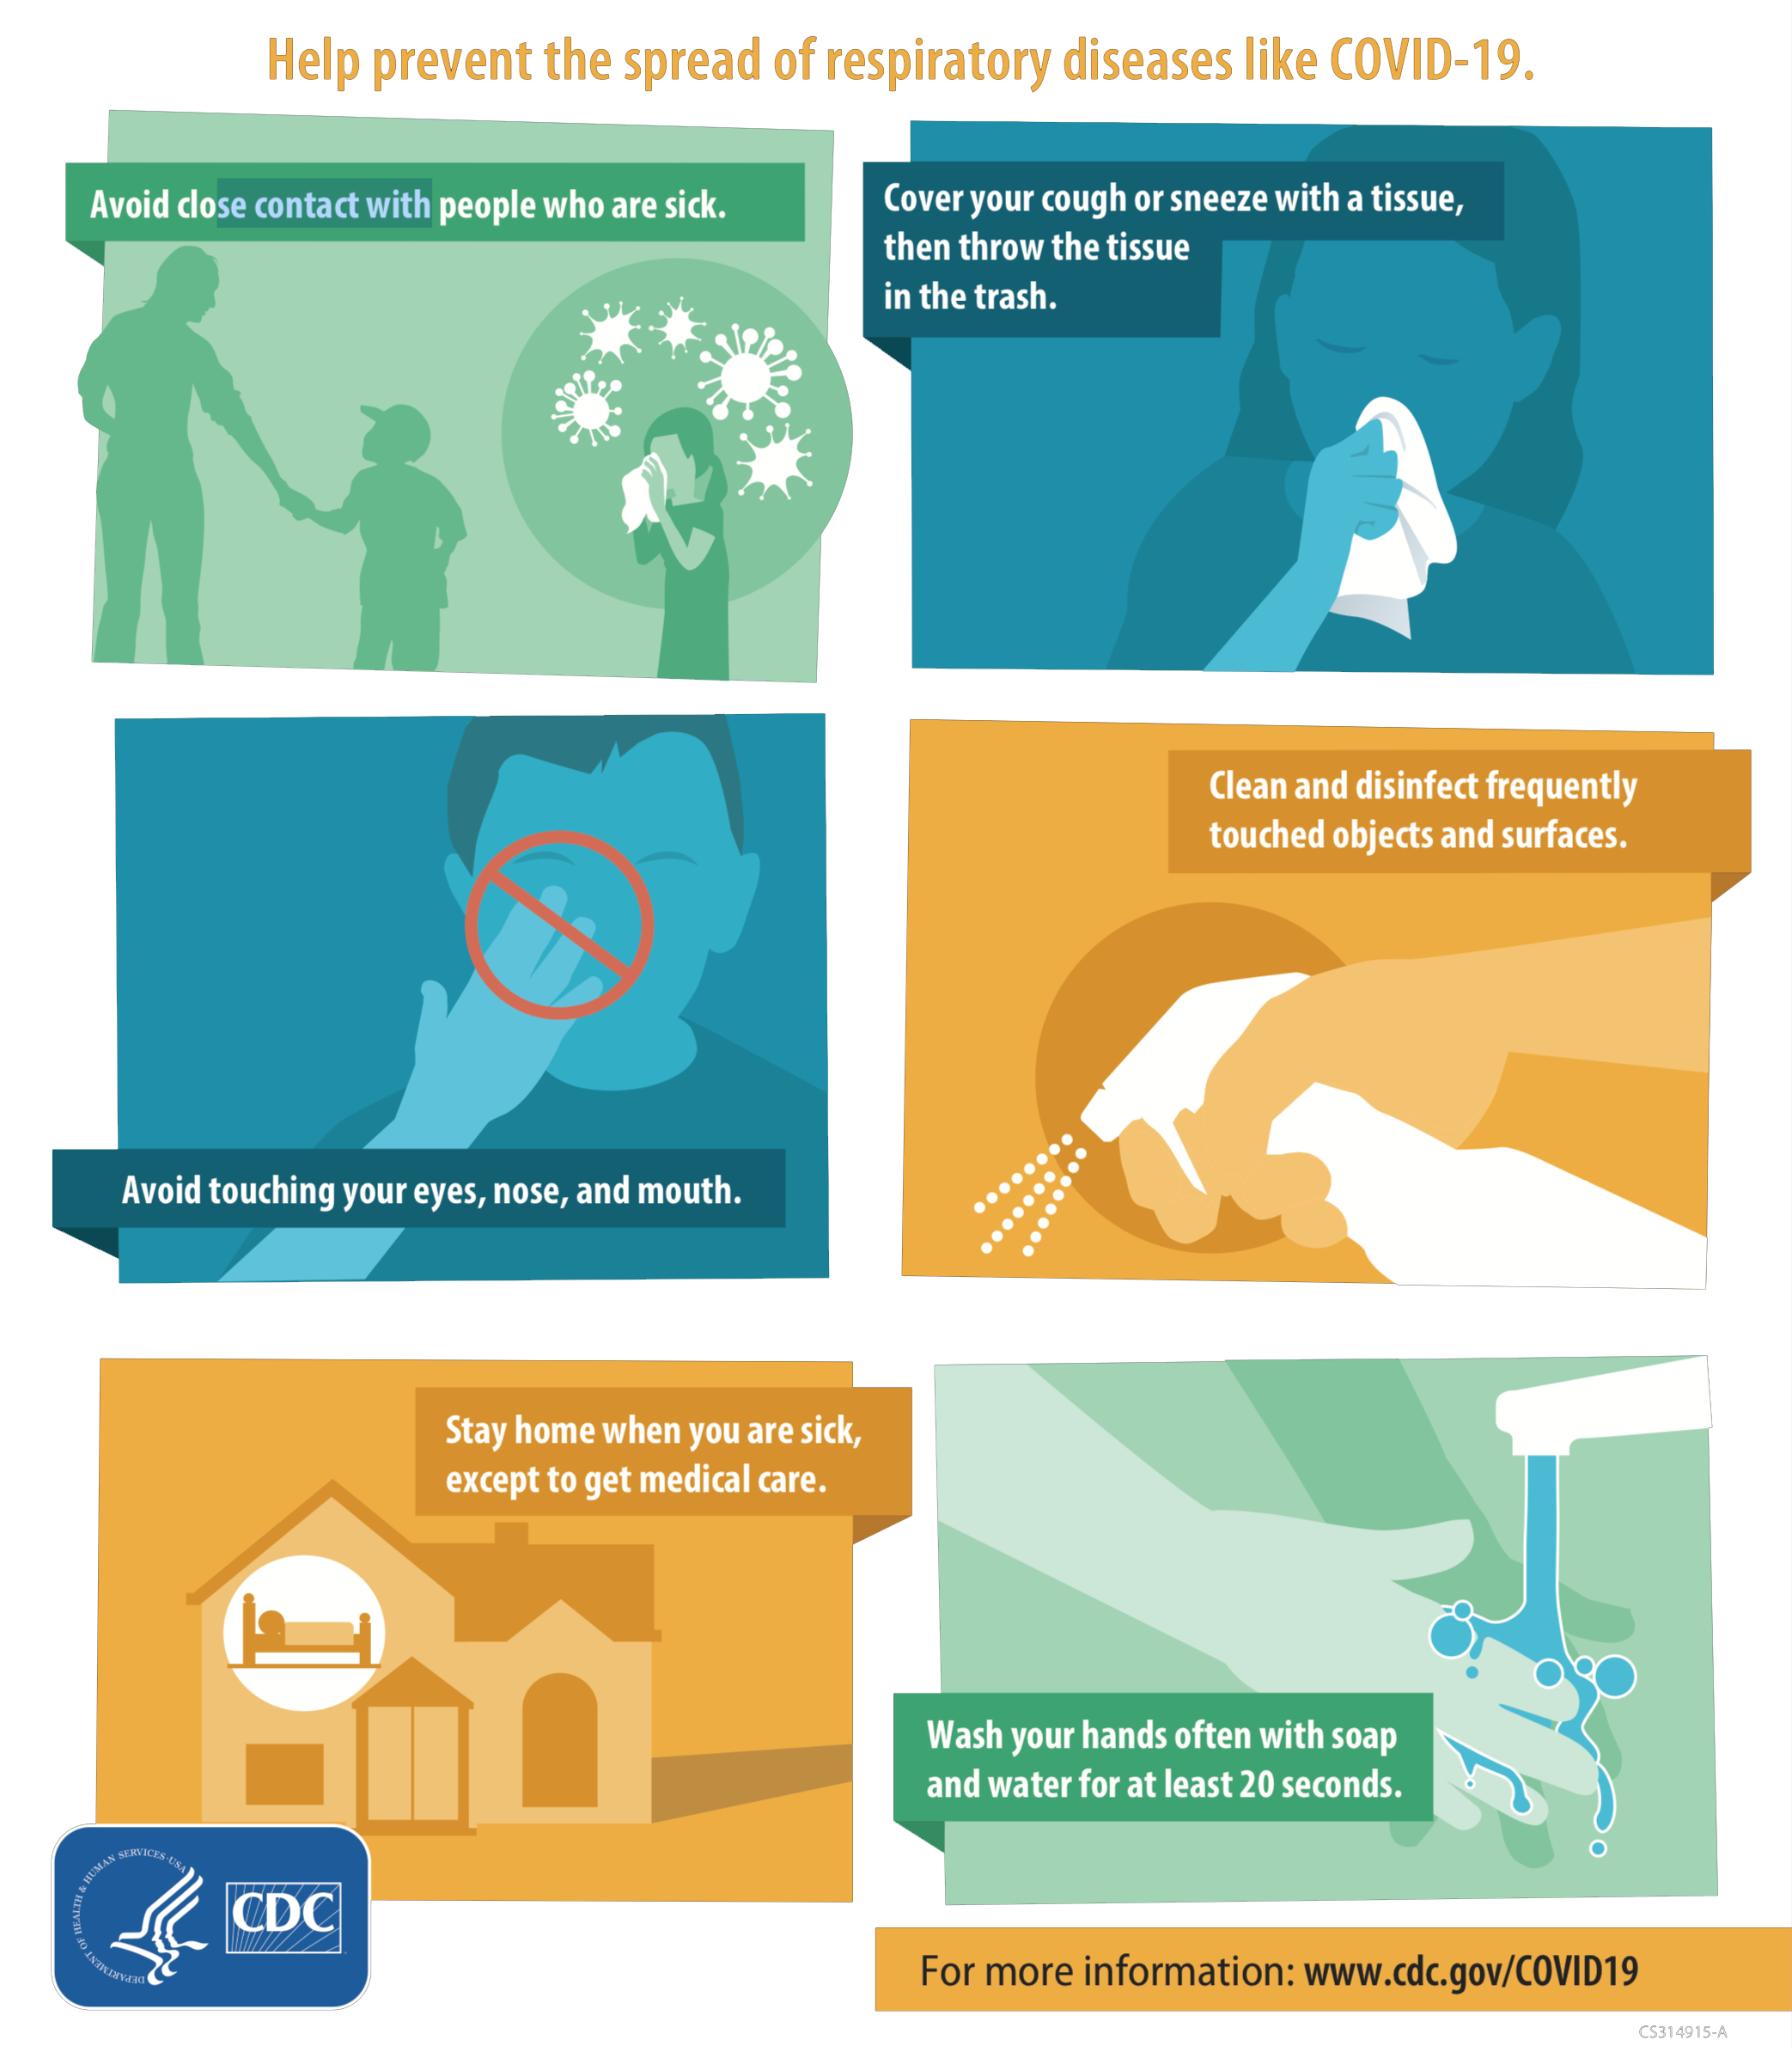
What can we do? CDC facts about Covid-19
Reputable resources
- CDC - Key Facts About COVID-19
- CDC - COVID-19 FAQ
- WHO Coronavirus disease (COVID-19) Pandemic Information page
- Johns Hopkins Coronavirus Resource Center