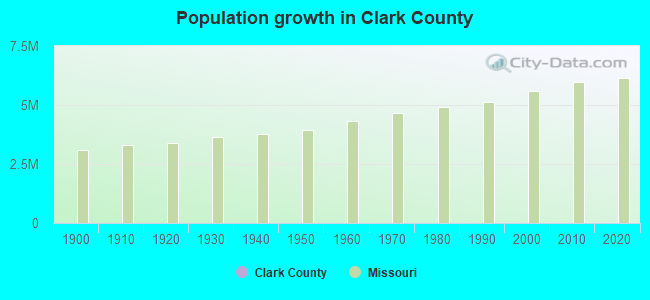
Clark County, Missouri (MO)
County owner-occupied free and clear houses and condos in 2010: 1,130
County owner-occupied houses and condos in 2000: 2,327
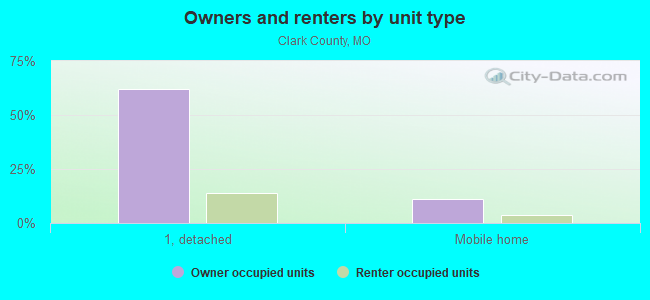
Renter-occupied apartments: 702 (it was 639 in 2000)
| % of renters here: | 22% |
| State: | 31% |
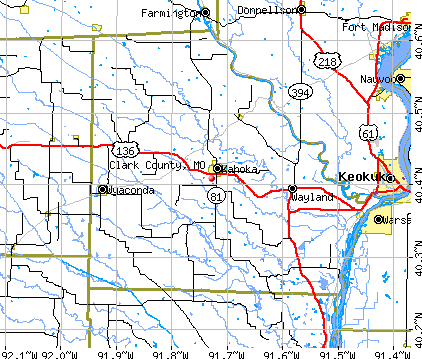
Land area: 507 sq. mi.
Water area: 4.6 sq. mi.
Population density: 13 people per square mile (low).
Industries providing employment: Manufacturing (25.9%), Educational, health and social services (16.9%), Retail trade (11.1%), Transportation and warehousing,and utilities (11.1%), Construction (10.8%).
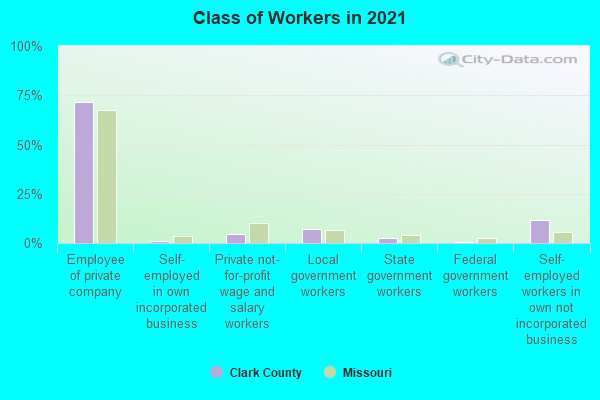
Type of workers:
- Private wage or salary: 81%
- Government: 10%
- Self-employed, not incorporated: 9%
- Unpaid family work: 0%
- OSM Map
- General Map
- Google Map
- MSN Map

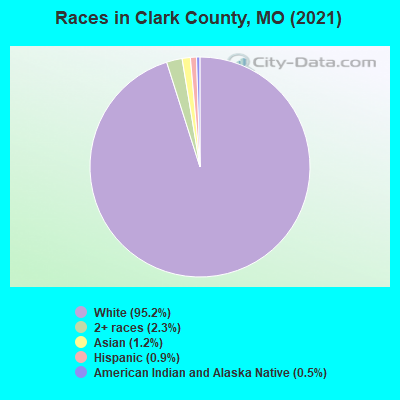
- 6,35395.2%White Non-Hispanic Alone
- 1422.1%Two or more races
- 661.0%Hispanic or Latino
- 651.0%Asian alone
- 360.5%American Indian and Alaska Native alone
- 100.1%Black Non-Hispanic Alone
| Median resident age: | 43.1 years |
| Missouri median age: | 39.1 years |
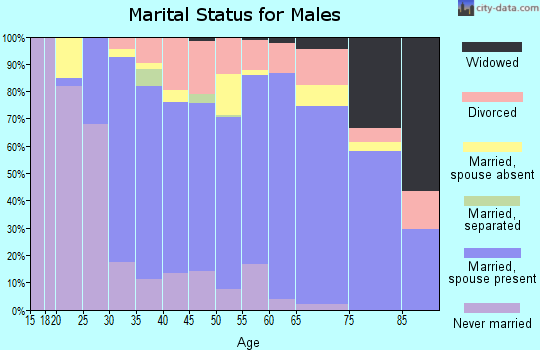
| Males: 3,466 | |
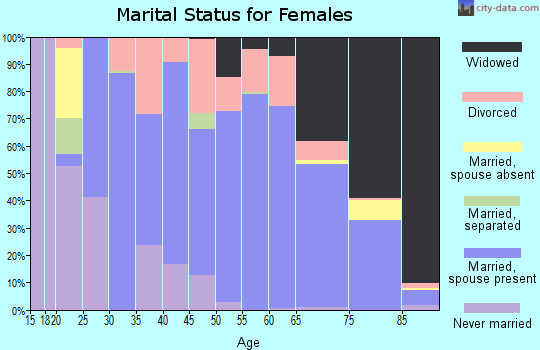
| Females: 3,252 |

 | Geodes in Fox river. Scotland county and Clark county? (0 replies) |
| Do not recommend living in Missouri (102 replies) |
| Moving to Springfield, MO and now I'm getting scared! (150 replies) |
| How "southern" is Kansas City? (188 replies) |
| Missouri Outlaw History (3407 replies) |
| Is Kansas City a Western city? (278 replies) |
| Clark County: | 2.0 people |
| Missouri: | 2 people |
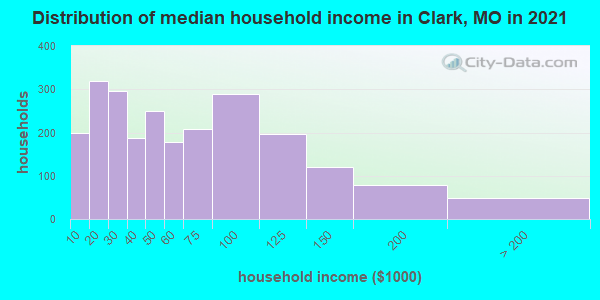
Estimated median household income in 2022: $52,464 ($29,457 in 1999)
| This county: | $52,464 |
| Missouri: | $64,811 |
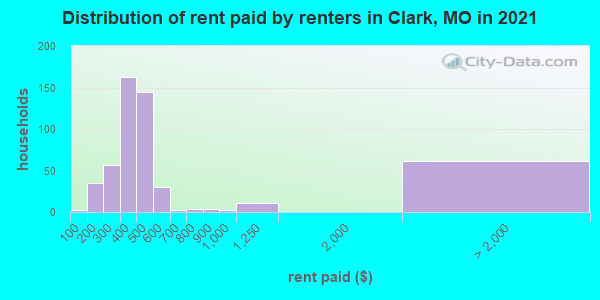
Median contract rent in 2022 for apartments: $402 (lower quartile is $324, upper quartile is $508)
| This county: | $402 |
| State: | $757 |
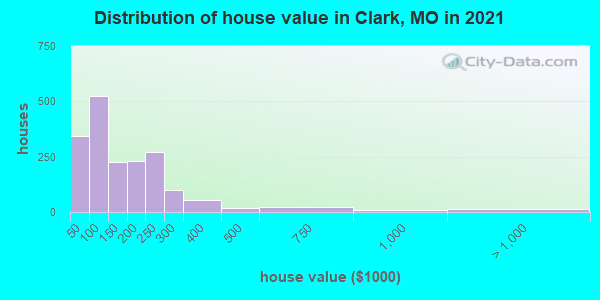
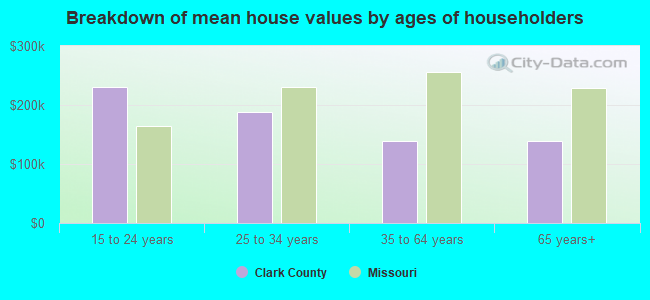
Estimated median house or condo value in 2022: $138,222 (it was $52,700 in 2000)
| Clark: | $138,222 |
| Missouri: | $221,200 |
Mean price in 2022:
Median monthly housing costs for homes and condos with a mortgage: $1,083Detached houses: $193,319
Here: $193,319 State: $278,068 Mobile homes: $110,678
Here: $110,678 State: $95,912
Median monthly housing costs for units without a mortgage: $418
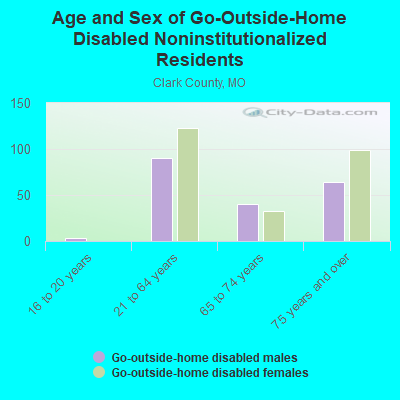
Institutionalized population: 90
Crime in 2021 (reported by the sheriff's office or county police, not the county total):
- Murders: 0
- Rapes: 0
- Robberies: 0
- Assaults: 4
- Burglaries: 32
- Thefts: 53
- Auto thefts: 8
Crime in 2020 (reported by the sheriff's office or county police, not the county total):
- Murders: 0
- Rapes: 1
- Robberies: 0
- Assaults: 12
- Burglaries: 32
- Thefts: 45
- Auto thefts: 5
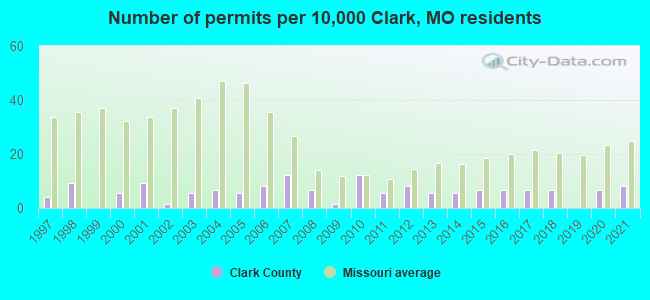
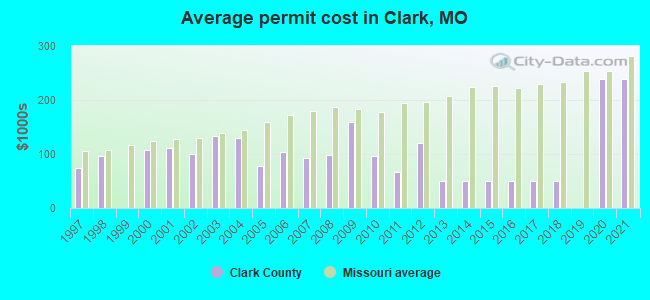
Single-family new house construction building permits:
- 2022: 5 buildings, average cost: $237,700
- 2021: 6 buildings, average cost: $237,700
- 2020: 5 buildings, average cost: $237,700
- 2019: 0 buildings
- 2018: 5 buildings, average cost: $49,800
- 2017: 5 buildings, average cost: $49,800
- 2016: 5 buildings, average cost: $49,800
- 2015: 5 buildings, average cost: $49,800
- 2014: 4 buildings, average cost: $49,800
- 2013: 4 buildings, average cost: $49,800
- 2012: 6 buildings, average cost: $120,300
- 2011: 4 buildings, average cost: $65,800
- 2010: 9 buildings, average cost: $96,700
- 2009: 1 building, cost: $160,000
- 2008: 5 buildings, average cost: $99,000
- 2007: 9 buildings, average cost: $91,900
- 2006: 6 buildings, average cost: $102,500
- 2005: 4 buildings, average cost: $78,000
- 2004: 5 buildings, average cost: $129,600
- 2003: 4 buildings, average cost: $132,500
- 2002: 1 building, cost: $100,000
- 2001: 7 buildings, average cost: $111,900
- 2000: 4 buildings, average cost: $108,200
- 1999: 0 buildings
- 1998: 7 buildings, average cost: $96,000
- 1997: 3 buildings, average cost: $75,000
Median real estate property taxes paid for housing units with mortgages in 2022: $1,160 (0.7%)
Median real estate property taxes paid for housing units with no mortgage in 2022: $1,153 (0.9%)
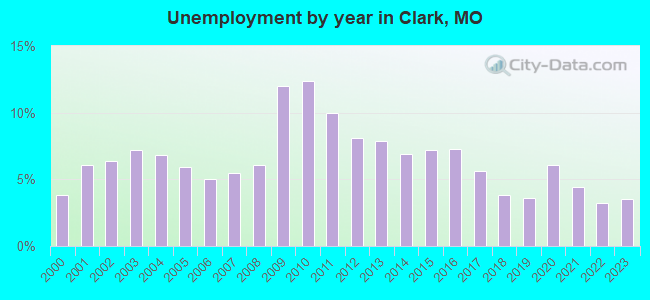
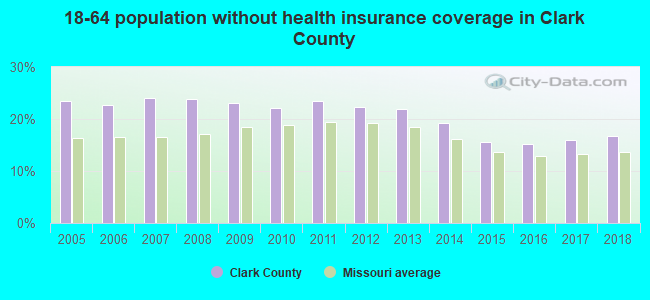
| Clark County: | 11.2% |
| Missouri: | 13.2% |
Median age of residents in 2022: 43.1 years old
(Males: 41.4 years old, Females: 44.0 years old)
(Median age for: White residents: 44.5 years old, Black residents: 20.1 years old, American Indian residents: 5.0 years old, Asian residents: 14.0 years old, Hispanic or Latino residents: 18.0 years old, Other race residents: 17.7 years old)
Fair market rent in 2006 for a 1-bedroom apartment in Clark County is $352 a month.
Fair market rent for a 2-bedroom apartment is $464 a month.
Fair market rent for a 3-bedroom apartment is $574 a month.
Cities in this county include: Kahoka, Wayland, Wyaconda, St. Francisville, Alexandria, Revere, Luray.
Neighboring counties: Blair County, Pennsylvania  , Clinton County, Indiana , Otoe County, Nebraska
  , Warren County, Indiana .
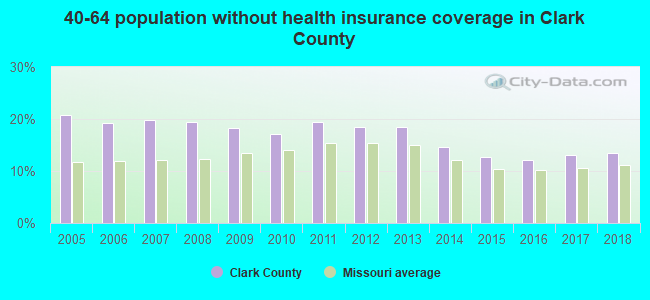
| Here: | 3.5% |
| Missouri: | 2.8% |
Current college students: 284
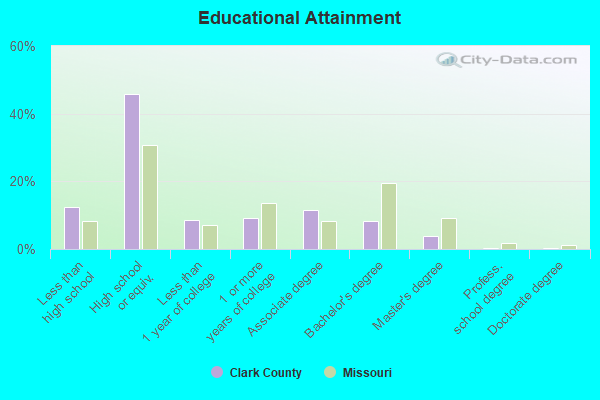
People 25 years of age or older with a high school degree or higher: 89.6%
People 25 years of age or older with a bachelor's degree or higher: 12.9%
Number of foreign born residents: 22 (39.3% naturalized citizens)
| Clark County: | 0.3% |
| Whole state: | 4.1% |
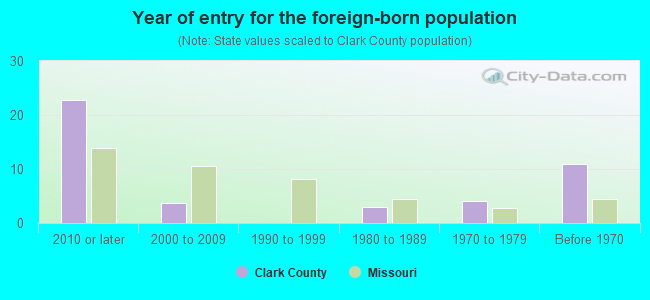
- Year of entry for the foreign-born population
- 202010 or later
- 32000 to 2009
- 01990 to 1999
- 31980 to 1989
- 41970 to 1979
- 11Before 1970
Mean travel time to work (commute): minutes
Percentage of county residents living and working in this county: 59.0%
Housing units in structures:
- One, detached: 2,495
- One, attached: 6
- Two: 28
- 3 or 4: 179
- 5 to 9: 6
- 10 to 19: 3
- 20 or more: 2
- Mobile homes: 519
Housing units in Clark County with a mortgage: 675 (17 second mortgage, 4 home equity loan, 10 both second mortgage and home equity loan)
Houses without a mortgage: 7
| Here: | 99.0% with mortgage |
| State: | 98.0% with mortgage |
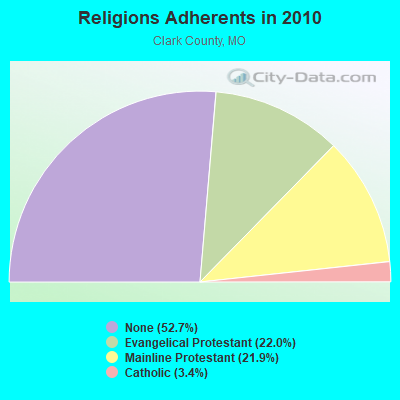
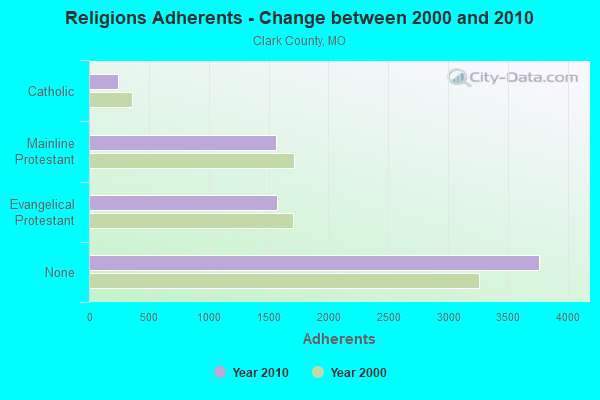
Religion statistics for Clark County
| Religion | Adherents | Congregations |
|---|---|---|
| Evangelical Protestant | 1,570 | 10 |
| Mainline Protestant | 1,565 | 13 |
| Catholic | 240 | 3 |
| None | 3,764 | - |
Source: Clifford Grammich, Kirk Hadaway, Richard Houseal, Dale E.Jones, Alexei Krindatch, Richie Stanley and Richard H.Taylor. 2012. 2010 U.S.Religion Census: Religious Congregations & Membership Study. Association of Statisticians of American Religious Bodies. Jones, Dale E., et al. 2002. Congregations and Membership in the United States 2000. Nashville, TN: Glenmary Research Center.
Food Environment Statistics:
| Clark County: | 2.77 / 10,000 pop. |
| State: | 1.88 / 10,000 pop. |
| This county: | 1.39 / 10,000 pop. |
| Missouri: | 0.60 / 10,000 pop. |
| Clark County: | 11.09 / 10,000 pop. |
| Missouri: | 4.34 / 10,000 pop. |
| This county: | 6.93 / 10,000 pop. |
| State: | 7.37 / 10,000 pop. |
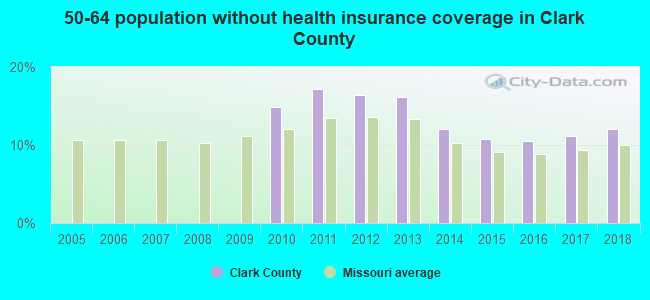
| Clark County: | 9.4% |
| Missouri: | 8.8% |
| Clark County: | 31.0% |
| State: | 29.6% |
| Here: | 13.7% |
| State: | 13.5% |
Agriculture in Clark County:
Average size of farms: 370 acresAverage value of agricultural products sold per farm: $41,945
Average value of crops sold per acre for harvested cropland: $153.09
The value of livestock, poultry, and their products as a percentage of the total market value of agricultural products sold: 31.33%
Average total farm production expenses per farm: $35,554
Harvested cropland as a percentage of land in farms: 50.83%
Average market value of all machinery and equipment per farm: $54,825
The percentage of farms operated by a family or individual: 92.12%
Average age of principal farm operators: 55 years
Average number of cattle and calves per 100 acres of all land in farms: 10.39
Milk cows as a percentage of all cattle and calves: 0.97%
Corn for grain: 43133 harvested acres
All wheat for grain: 3345 harvested acres
Soybeans for beans: 60254 harvested acres
Earthquake activity:
Clark County-area historical earthquake activity is significantly above Missouri state average. It is 220% greater than the overall U.S. average.On 4/18/2008 at 09:36:59, a magnitude 5.4 (5.1 MB, 4.8 MS, 5.4 MW, 5.2 MW, Class: Moderate, Intensity: VI - VII) earthquake occurred 245.8 miles away from Clark County center
On 4/18/2008 at 09:36:59, a magnitude 5.2 (5.2 MW, Depth: 8.9 mi) earthquake occurred 245.9 miles away from the county center
On 6/10/1987 at 23:48:54, a magnitude 5.1 (4.9 MB, 4.4 MS, 4.6 MS, 5.1 LG) earthquake occurred 232.4 miles away from the county center
On 9/3/2016 at 12:02:44, a magnitude 5.8 (5.8 MW, Depth: 3.5 mi) earthquake occurred 393.9 miles away from the county center
On 9/26/1990 at 13:18:51, a magnitude 5.0 (4.7 MB, 4.8 LG, 5.0 LG, Depth: 7.7 mi) earthquake occurred 253.4 miles away from Clark County center
On 6/18/2002 at 17:37:15, a magnitude 5.0 (4.3 MB, 4.6 MW, 5.0 LG) earthquake occurred 269.9 miles away from the county center
Magnitude types: regional Lg-wave magnitude (LG), body-wave magnitude (MB), surface-wave magnitude (MS), moment magnitude (MW)
Most recent natural disasters:
- Missouri Covid-19 Pandemic, Incident Period: January 20, 2020, FEMA Id: 4490, Natural disaster type: Other
- Missouri Severe Storms, Tornadoes, And Flooding, Incident Period: April 29, 2019, FEMA Id: 4451, Natural disaster type: Storm, Tornado, Flood
- Missouri Severe Storms, Tornadoes, Straight-line Winds, and Flooding, Incident Period: December 22, 2015 to January 09, 2016, Emergency Declared EM-3374: January 02, 2016, FEMA Id: 3374, Natural disaster type: Storm, Tornado, Flood, Wind
- Missouri Severe Storms, Tornadoes, Straight-line Winds, and Flooding, Incident Period: May 15, 2015 to July 27, 2015, Major Disaster (Presidential) Declared DR-4238: August 07, 2015, FEMA Id: 4238, Natural disaster type: Storm, Tornado, Flood, Wind
- Missouri Severe Storms, Straight-line Winds, Tornadoes, and Flooding, Incident Period: May 29, 2013 to June 11, 2013, Major Disaster (Presidential) Declared DR-4130: July 18, 2013, FEMA Id: 4130, Natural disaster type: Storm, Tornado, Flood, Wind
- Missouri Flooding, Incident Period: June 01, 2011 to August 01, 2011, Emergency Declared EM-3325: June 30, 2011, FEMA Id: 3325, Natural disaster type: Flood
- Missouri Severe Winter Storm and Snowstorm, Incident Period: January 31, 2011 to February 05, 2011, Major Disaster (Presidential) Declared DR-1961: March 23, 2011, FEMA Id: 1961, Natural disaster type: Snowstorm, Winter Storm
- Missouri Severe Winter Storm, Incident Period: January 31, 2011 to February 05, 2011, Emergency Declared EM-3317: February 03, 2011, FEMA Id: 3317, Natural disaster type: Winter Storm
- Missouri Severe Storms, Flooding, and Tornadoes, Incident Period: June 12, 2010 to July 31, 2010, Major Disaster (Presidential) Declared DR-1934: August 17, 2010, FEMA Id: 1934, Natural disaster type: Storm, Tornado, Flood
- Missouri Severe Winter Storm, Incident Period: January 26, 2009 to January 28, 2009, Emergency Declared EM-3303: January 30, 2009, FEMA Id: 3303, Natural disaster type: Winter Storm
- 14 other natural disasters have been reported since 1953.
The number of natural disasters in Clark County (24) is greater than the US average (15).
Major Disasters (Presidential) Declared: 15
Emergencies Declared: 7
Causes of natural disasters: Floods: 15, Storms: 13, Tornadoes: 10, Winter Storms: 4, Winds: 3, Drought: 1, Heavy Rain: 1, Hurricane: 1, Ice Storm: 1, Snowstorm: 1, Other: 1 (Note: some incidents may be assigned to more than one category).
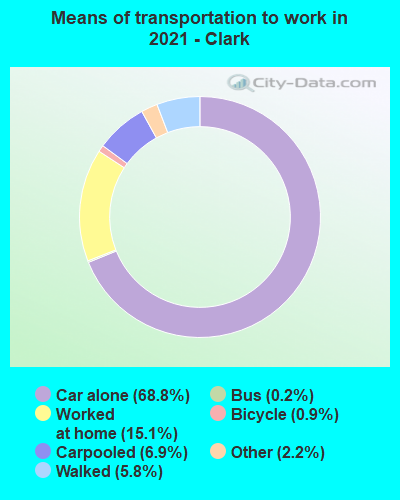
Means of transportation to work:
- Drove a car alone: 1,211 (73.2%)
- Carpooled: 80 (4.8%)
- Taxicab, motorcycle, or other means: 22 (1.3%)
- Bicycle: 14 (0.8%)
- Walked: 77 (4.7%)
- Worked at home: 263 (15.9%)
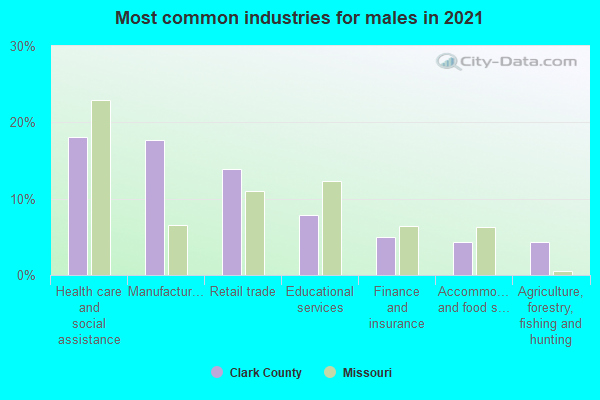
- Health care and social assistance (19%)
- Manufacturing (16%)
- Retail trade (10%)
- Educational services (9%)
- Accommodation and food services (8%)
- Agriculture, forestry, fishing and hunting (5%)
- Finance and insurance (4%)
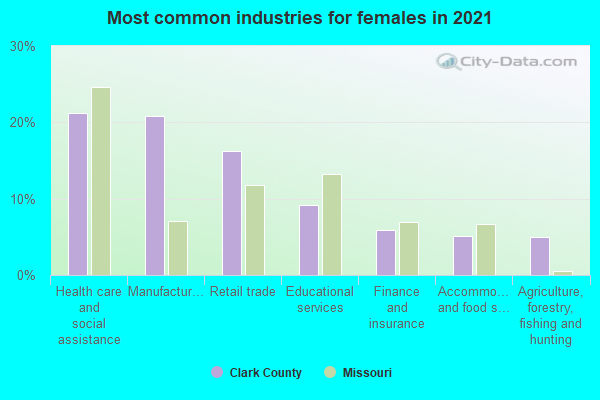
- Health care and social assistance (22%)
- Manufacturing (18%)
- Retail trade (12%)
- Educational services (10%)
- Accommodation and food services (9%)
- Agriculture, forestry, fishing and hunting (5%)
- Finance and insurance (4%)
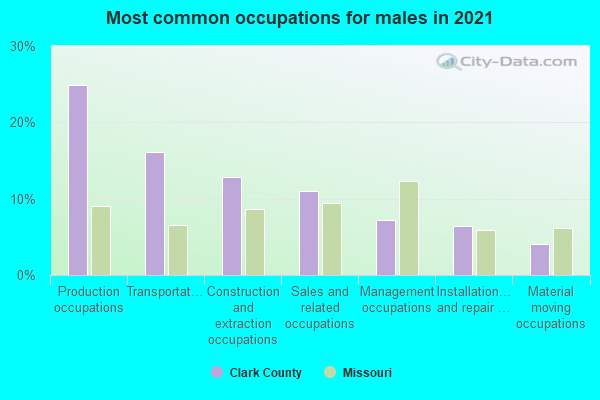
- Production occupations (21%)
- Transportation occupations (17%)
- Construction and extraction occupations (15%)
- Sales and related occupations (10%)
- Management occupations (9%)
- Material moving occupations (6%)
- Installation, maintenance, and repair occupations (6%)
- Production occupations (15%)
- Office and administrative support occupations (13%)
- Sales and related occupations (11%)
- Management occupations (9%)
- Food preparation and serving related occupations (9%)
- Educational instruction, and library occupations (8%)
- Health diagnosing and treating practitioners and other technical occupations (7%)
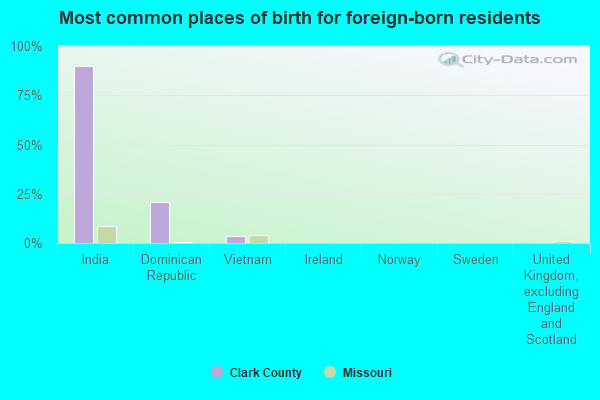
- India (91%)
- Vietnam (5%)
- Denmark (0%)
- Ireland (0%)
- Norway (0%)
- Sweden (0%)
- United Kingdom, excluding England and Scotland (0%)
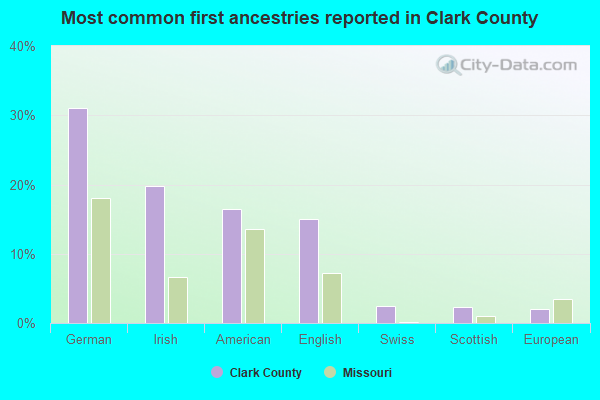
- German (32%)
- English (19%)
- American (15%)
- Irish (14%)
- Swiss (5%)
- Norwegian (2%)
- Scotch-Irish (2%)
6 people in local jails and other municipal confinement facilities
People in group quarters in Clark County, Missouri in 2000:
- 110 people in nursing homes
- 8 people in homes for abused, dependent, and neglected children
- 4 people in local jails and other confinement facilities (including police lockups)
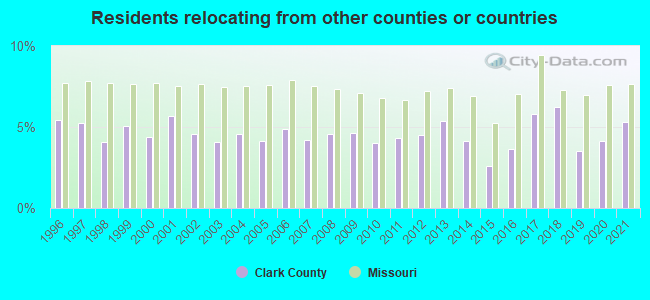
5.34% of this county's 2021 resident taxpayers lived in other counties in 2020 ($43,701 average adjusted gross income)
| Here: | 5.34% |
| Missouri average: | 7.67% |
10 or fewer of this county's residents moved from foreign countries.
1.67% relocated from other counties in Missouri ($15,015 average AGI)
3.66% relocated from other states ($28,687 average AGI)
Clark County: 3.66% Missouri average: 3.04%
Top counties from which taxpayers relocated into this county between 2020 and 2021:
| from Lee County, IA |
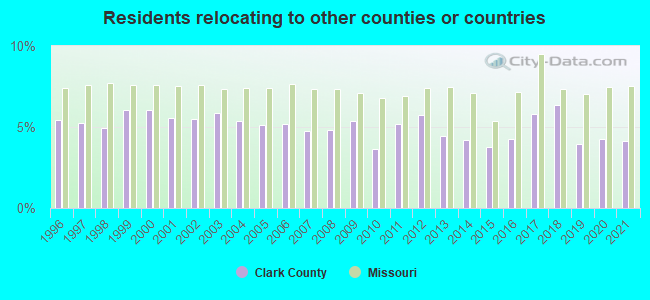
4.11% of this county's 2020 resident taxpayers moved to other counties in 2021 ($38,990 average adjusted gross income)
| Here: | 4.11% |
| Missouri average: | 7.51% |
10 or fewer of this county's residents moved to foreign countries.
1.45% relocated to other counties in Missouri ($16,686 average AGI)
2.66% relocated to other states ($22,304 average AGI)
Clark County: 2.66% Missouri average: 2.88%
Top counties to which taxpayers relocated from this county between 2020 and 2021:
| to Lee County, IA |
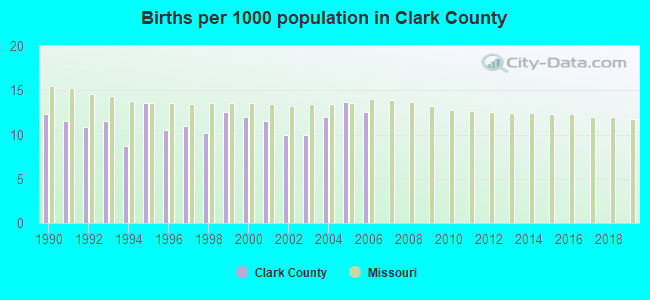
Births per 1000 population from 1990 to 1999: 11.3
Births per 1000 population from 2000 to 2006: 11.7
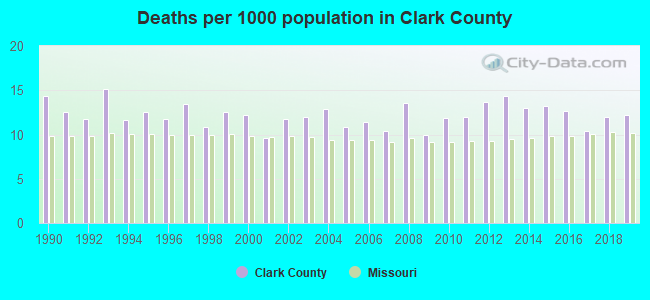
Deaths per 1000 population from 1990 to 1999: 12.6
Deaths per 1000 population from 2000 to 2009: 11.5
Deaths per 1000 population from 2010 to 2020: 12.7
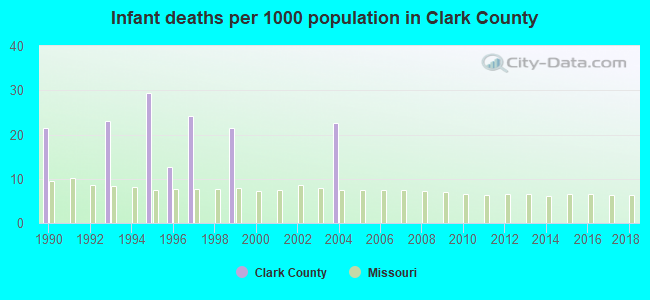
Infant deaths per 1000 live births from 1990 to 1999: 13.2
Infant deaths per 1000 live births from 2000 to 2006: 3.2
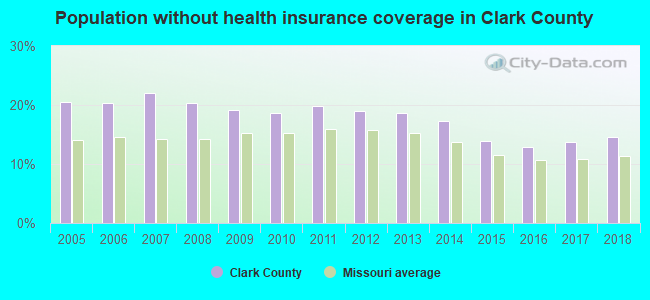
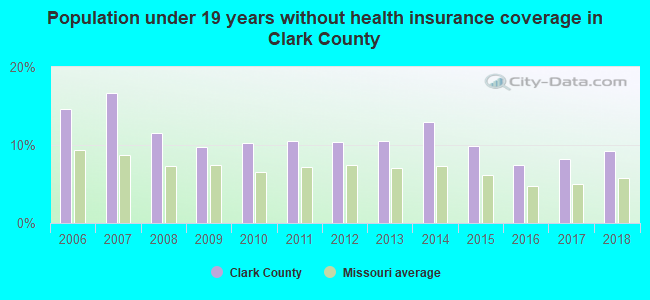
Persons under 19 years old without health insurance coverage in 2018: 9.2%
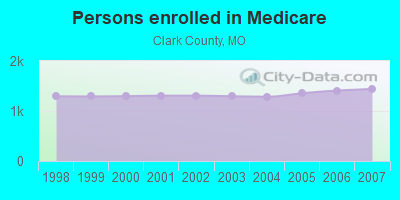
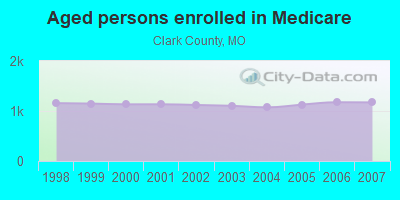
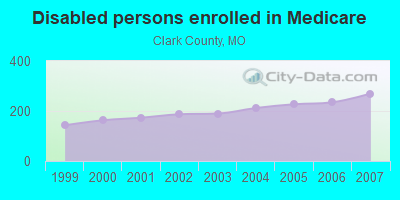
Persons enrolled in hospital insurance and/or supplemental medical insurance (Medicare) in July 1, 2007: 1,442 (1,172 aged, 270 disabled)
Children under 18 without health insurance coverage in 2007: 264 (16%)
Most common underlying causes of death in Clark County, Missouri in 1999 - 2019:
- Acute myocardial infarction, unspecified (85)
- Chronic obstructive pulmonary disease, unspecified (11)
Population without health insurance coverage in 2000: 13%
Children under 18 without health insurance coverage in 2000: 12%
Medical specialist MDs per 100,000 population in 2005: 1,366
Total births per 100,000 population, July 2005 - July 2006 : 13
Total deaths per 100,000 population, July 2005 - July 2006: 41
Household type by relationship:
Households: 6,718- Male householders: 1,121 (384 living alone), Female householders: 1,238 (392 living alone)
1,273 spouses (1,260 opposite-sex spouses), 128 unmarried partners, (123 opposite-sex unmarried partners), 2,181 children (1,956 natural, 5 adopted, 225 stepchildren), 123 grandchildren, 83 brothers or sisters, 51 parents, 17 foster children, 317 other relatives, 91 non-relatives
- In group quarters: 78
Size of family households: 828 2-persons, 251 3-persons, 232 4-persons, 65 5-persons, 29 6-persons, 77 7-or-more-persons.
Size of nonfamily households: 776 1-person, 88 2-persons, 7 3-persons.
1,278 married couples with children.
243 single-parent households (45 men, 198 women).
96.7% of residents of Clark speak English at home.
0.3% of residents speak Spanish at home (86% speak English very well, 5% speak English well, 10% speak English not well).
3.1% of residents speak other Indo-European language at home (94% speak English very well, 5% speak English well, 2% speak English not well).
0.2% of residents speak Asian or Pacific Island language at home (86% speak English very well, 14% speak English well).
In fiscal year 2004:
Federal Government expenditure: $44,629,000 ($6,067 per capita)
Department of Defense expenditure: $399,000
Federal direct payments to individuals for retirement and disability: $17,381,000
Federal other direct payments to individuals: $10,034,000
Federal direct payments not to individuals: $5,514,000
Federal grants: $9,050,000
Federal procurement contracts: $538,000 ($16,000 Department of Defense)
Federal salaries and wages: $2,112,000 ($0,000 Department of Defense)
Federal Government direct loans: $264,000
Federal guaranteed/insured loans: $1,264,000
Federal Government insurance: $25,367,000
Population change from April 1, 2000 to July 1, 2005:
Births: 409| Here: | 56 per 1000 residents |
| State: | 69 per 1000 residents |
Deaths: 441
| Here: | 60 per 1000 residents |
| State: | 49 per 1000 residents |
Net international migration: 0
| Here: | 0 per 1000 residents |
| State: | +7 per 1000 residents |
Net internal migration: -51
| Here: | |
| State: |
Total withdrawal of fresh water for public supply: 0.54 millions of gallons per day (96% from ground, 4% from surface)
| Here: | 6.0 |
| State: | 6.4 |
| Here: | 4.9 |
| State: | 4.4 |
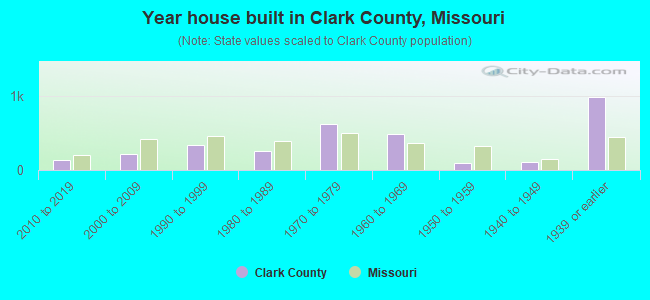
- Year house built in Clark County, Missouri
- 02020 or later
- 1932010 to 2019
- 3142000 to 2009
- 2791990 to 1999
- 2481980 to 1989
- 5561970 to 1979
- 4701960 to 1969
- 1281950 to 1959
- 881940 to 1949
- 9451939 or earlier
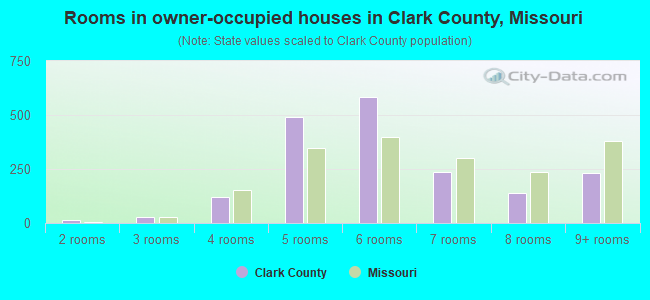
- Rooms in owner-occupied houses in Clark County, Missouri
- 31 room
- 42 rooms
- 93 rooms
- 824 rooms
- 4615 rooms
- 6116 rooms
- 2947 rooms
- 1308 rooms
- 2539+ rooms
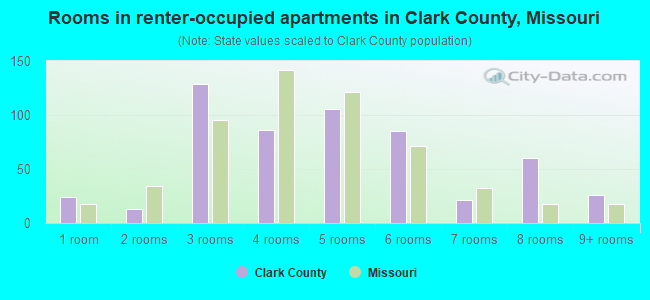
- Rooms in renter-occupied apartments in Clark County, Missouri
- 301 room
- 142 rooms
- 1193 rooms
- 644 rooms
- 765 rooms
- 856 rooms
- 267 rooms
- 788 rooms
- 229+ rooms
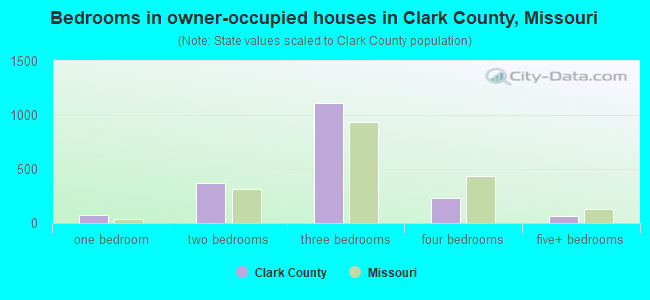
- Bedrooms in owner-occupied houses in Clark County, Missouri
- 3no bedroom
- 631 bedroom
- 3402 bedrooms
- 1,1013 bedrooms
- 2844 bedrooms
- 535+ bedrooms
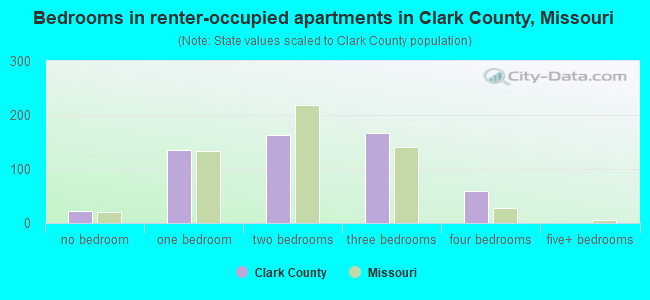
- Bedrooms in renter-occupied apartments in Clark County, Missouri
- 30no bedroom
- 1131 bedroom
- 1642 bedrooms
- 1283 bedrooms
- 704 bedrooms
- 35+ bedrooms
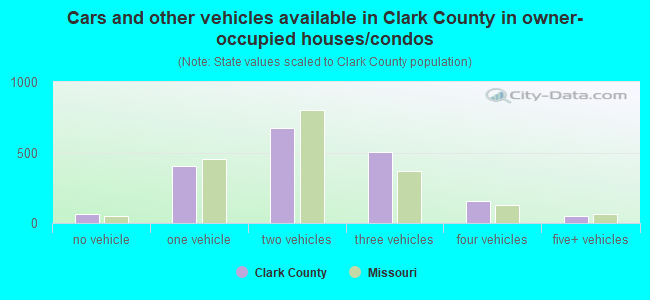
- Cars and other vehicles available in Clark County in owner-occupied houses/condos
- 38no vehicle
- 4471 vehicle
- 6702 vehicles
- 5223 vehicles
- 1274 vehicles
- 455+ vehicles
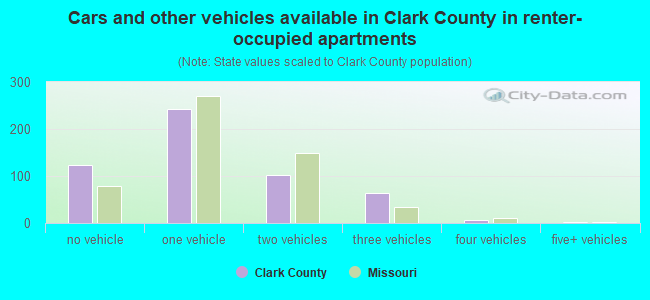
- Cars and other vehicles available in Clark County in renter-occupied apartments
- 103no vehicle
- 1981 vehicle
- 1072 vehicles
- 823 vehicles
- 174 vehicles
- 05+ vehicles
94.2% of Clark County residents lived in the same house 1 years ago.
Out of people who lived in different houses, 34% lived in this county.
Out of people who lived in different counties, 57% lived in Missouri.
| Clark County: | 94.2% |
| State average: | 87.1% |
Place of birth for U.S.-born residents:
- This state: 2,578
- Other state: 4,144
- Northeast: 107
- Midwest: 3,647
- South: 257
- West: 109
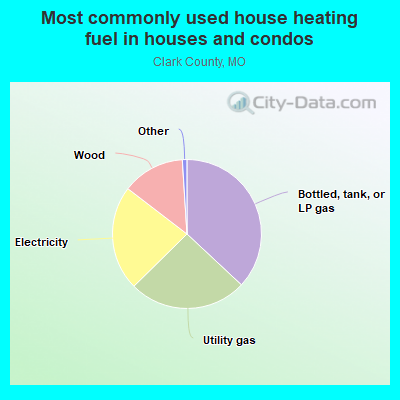
- 37.7%Bottled, tank, or LP gas
- 26.0%Utility gas
- 24.7%Electricity
- 10.1%Wood
- 1.0%No fuel used
- 0.4%Fuel oil, kerosene, etc.
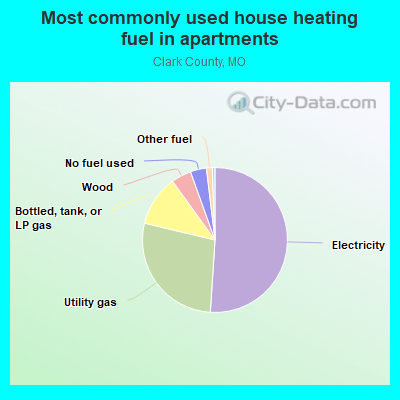
- 52.4%Electricity
- 27.2%Utility gas
- 10.7%Bottled, tank, or LP gas
- 5.0%Wood
- 4.6%No fuel used
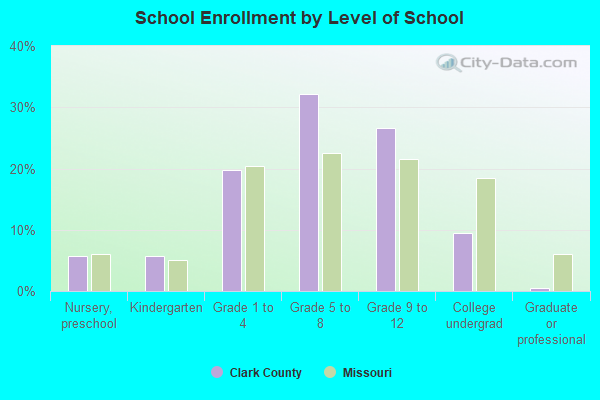
Private vs. public school enrollment:
| Here: | 26.2% |
| Missouri: | 15.4% |
| Here: | 20.5% |
| Missouri: | 13.9% |
| Here: | 5.9% |
| Missouri: | 22.6% |
Clark County government finances - Expenditure in 2017:
- Charges - Other: $496,000
Parks and Recreation: $205,000
- Current Operations - Correctional Institutions: $1,366,000
Regular Highways: $964,000
Police Protection: $747,000
General - Other: $421,000
Parks and Recreation: $330,000
Central Staff Services: $309,000
Financial Administration: $286,000
Judicial and Legal Services: $224,000
Health - Other: $167,000
Public Welfare - Other: $132,000
General Public Buildings: $37,000
- General - Interest on Debt: $94,000
- Long Term Debt - Beginning Outstanding - Unspecified Public Purpose: $3,905,000
Outstanding Unspecified Public Purpose: $3,446,000
Retired Unspecified Public Purpose: $459,000
- Miscellaneous - General Revenue - Other: $172,000
Interest Earnings: $126,000
- Other Capital Outlay - General - Other: $309,000
- Other Funds - Cash and Securities: $1,800,000
- State Intergovernmental - General Local Government Support: $1,853,000
Highways: $502,000
Other: $254,000
Health and Hospitals: $34,000
- Tax - General Sales and Gross Receipts: $1,447,000
Property: $953,000
Clark County government finances - Revenue in 2017:
- Charges - Other: $496,000
Parks and Recreation: $205,000
- Current Operations - Correctional Institutions: $1,366,000
Regular Highways: $964,000
Police Protection: $747,000
General - Other: $421,000
Parks and Recreation: $330,000
Central Staff Services: $309,000
Financial Administration: $286,000
Judicial and Legal Services: $224,000
Health - Other: $167,000
Public Welfare - Other: $132,000
General Public Buildings: $37,000
- General - Interest on Debt: $94,000
- Long Term Debt - Beginning Outstanding - Unspecified Public Purpose: $3,905,000
Outstanding Unspecified Public Purpose: $3,446,000
Retired Unspecified Public Purpose: $459,000
- Miscellaneous - General Revenue - Other: $172,000
Interest Earnings: $126,000
- Other Capital Outlay - General - Other: $309,000
- Other Funds - Cash and Securities: $1,800,000
- State Intergovernmental - General Local Government Support: $1,853,000
Highways: $502,000
Other: $254,000
Health and Hospitals: $34,000
- Tax - General Sales and Gross Receipts: $1,447,000
Property: $953,000
Clark County government finances - Debt in 2017:
- Charges - Other: $496,000
Parks and Recreation: $205,000
- Current Operations - Correctional Institutions: $1,366,000
Regular Highways: $964,000
Police Protection: $747,000
General - Other: $421,000
Parks and Recreation: $330,000
Central Staff Services: $309,000
Financial Administration: $286,000
Judicial and Legal Services: $224,000
Health - Other: $167,000
Public Welfare - Other: $132,000
General Public Buildings: $37,000
- General - Interest on Debt: $94,000
- Long Term Debt - Beginning Outstanding - Unspecified Public Purpose: $3,905,000
Outstanding Unspecified Public Purpose: $3,446,000
Retired Unspecified Public Purpose: $459,000
- Miscellaneous - General Revenue - Other: $172,000
Interest Earnings: $126,000
- Other Capital Outlay - General - Other: $309,000
- Other Funds - Cash and Securities: $1,800,000
- State Intergovernmental - General Local Government Support: $1,853,000
Highways: $502,000
Other: $254,000
Health and Hospitals: $34,000
- Tax - General Sales and Gross Receipts: $1,447,000
Property: $953,000
Clark County government finances - Cash and Securities in 2017:
- Charges - Other: $496,000
Parks and Recreation: $205,000
- Current Operations - Correctional Institutions: $1,366,000
Regular Highways: $964,000
Police Protection: $747,000
General - Other: $421,000
Parks and Recreation: $330,000
Central Staff Services: $309,000
Financial Administration: $286,000
Judicial and Legal Services: $224,000
Health - Other: $167,000
Public Welfare - Other: $132,000
General Public Buildings: $37,000
- General - Interest on Debt: $94,000
- Long Term Debt - Beginning Outstanding - Unspecified Public Purpose: $3,905,000
Outstanding Unspecified Public Purpose: $3,446,000
Retired Unspecified Public Purpose: $459,000
- Miscellaneous - General Revenue - Other: $172,000
Interest Earnings: $126,000
- Other Capital Outlay - General - Other: $309,000
- Other Funds - Cash and Securities: $1,800,000
- State Intergovernmental - General Local Government Support: $1,853,000
Highways: $502,000
Other: $254,000
Health and Hospitals: $34,000
- Tax - General Sales and Gross Receipts: $1,447,000
Property: $953,000
Supplemental Security Income (SSI) in 2006:
- Total number of recipients: 130
- Number of aged recipients: 15
- Number of blind and disabled recipients: 115
- Number of recipients under 18: 24
- Number of recipients between 18 and 64: 82
- Number of recipients older than 64: 24
- Number of recipients also receiving OASDI: 45
- Amount of payments (thousands of dollars): 54
| Most common first names in Clark County, MO among deceased individuals | ||
| Name | Count | Lived (average) |
|---|---|---|
| Mary | 56 | 80.0 years |
| John | 55 | 80.7 years |
| William | 48 | 71.8 years |
| James | 38 | 76.2 years |
| Robert | 37 | 74.8 years |
| George | 36 | 79.4 years |
| Charles | 28 | 77.0 years |
| Helen | 28 | 80.1 years |
| Harry | 22 | 82.4 years |
| Bertha | 22 | 87.6 years |
| Most common last names in Clark County, MO among deceased individuals | ||
| Last name | Count | Lived (average) |
|---|---|---|
| Wilson | 26 | 80.5 years |
| Kirchner | 20 | 81.9 years |
| Gutting | 19 | 79.4 years |
| Smith | 19 | 77.4 years |
| Mohr | 18 | 84.0 years |
| Roberts | 18 | 68.0 years |
| Johnson | 17 | 82.0 years |
| Walker | 17 | 76.9 years |
| Davis | 16 | 65.9 years |
| Heinze | 16 | 81.2 years |
| Businesses in Clark County, MO | ||||
| Name | Count | Name | Count | |
|---|---|---|---|---|
| Dennys | 1 | U-Haul | 1 | |
| Ford | 1 | U.S. Cellular | 1 | |
| MasterBrand Cabinets | 3 | UPS | 1 | |
Clark County on our top lists:
- #12 on the list of "Top 101 counties with the lowest surface withdrawal of fresh water for public supply"