Kanabec County, Minnesota (MN)
County owner-occupied free and clear houses and condos in 2010: 1,695
County owner-occupied houses and condos in 2000: 4,840
Renter-occupied apartments: 1,162 (it was 919 in 2000)
| % of renters here: | 16% |
| State: | 27% |
Land area: 525 sq. mi.
Water area: 8.5 sq. mi.
Population density: 31 people per square mile (low).
Industries providing employment: Educational, health and social services (24.4%), Construction (14.3%), Manufacturing (12.7%), Retail trade (11.7%).
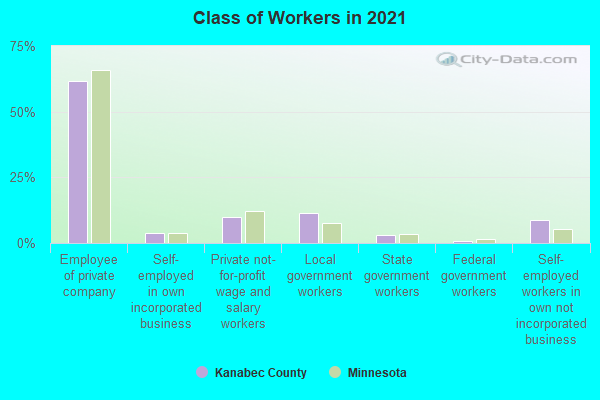
Type of workers:
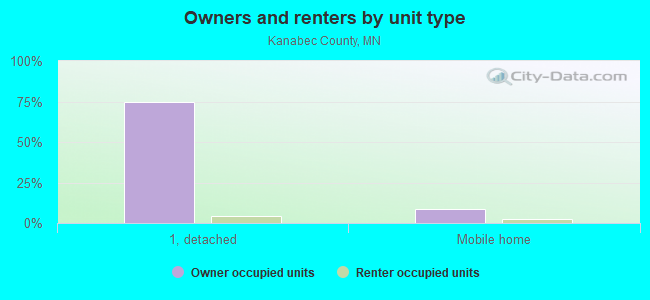
- Private wage or salary: 75%
- Government: 16%
- Self-employed, not incorporated: 8%
- Unpaid family work: 1%
- OSM Map
- General Map
- Google Map
- MSN Map

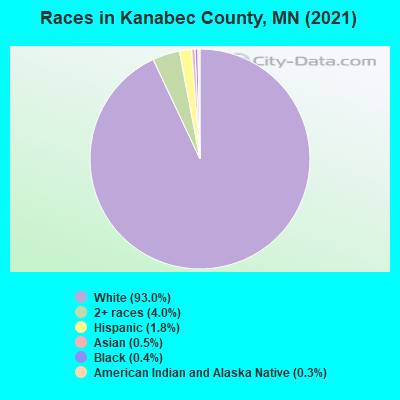
- 14,87192.7%White Non-Hispanic Alone
- 6654.1%Two or more races
- 2981.9%Hispanic or Latino
- 710.4%Asian alone
- 690.4%Black Non-Hispanic Alone
- 570.4%American Indian and Alaska Native alone
- 70.04%Some other race alone
| Median resident age: | 45.4 years |
| Minnesota median age: | 39.0 years |
| Males: 8,108 | |
| Females: 8,099 |

 | Is Scandinavian cultural heritage well preserved/cherished in MN? (65 replies) |
| Kanabec County: | 2.0 people |
| Minnesota: | 2 people |
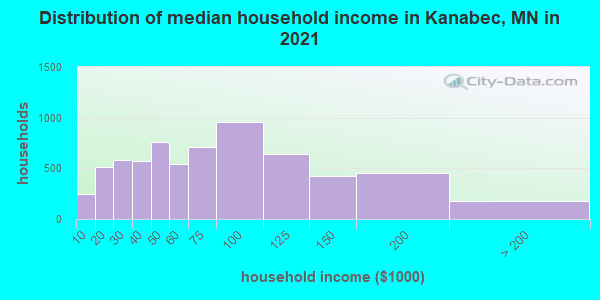
Estimated median household income in 2022: $67,378 ($38,520 in 1999)
| This county: | $67,378 |
| Minnesota: | $82,338 |
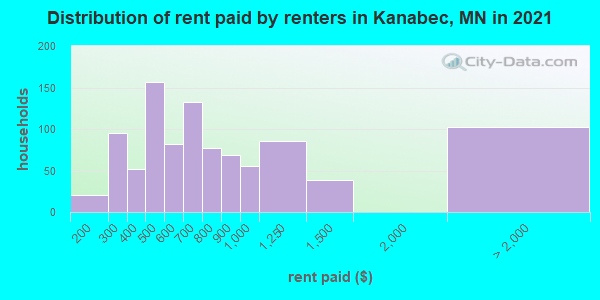
Median contract rent in 2022 for apartments: $679 (lower quartile is $529, upper quartile is $880)
| This county: | $679 |
| State: | $1087 |
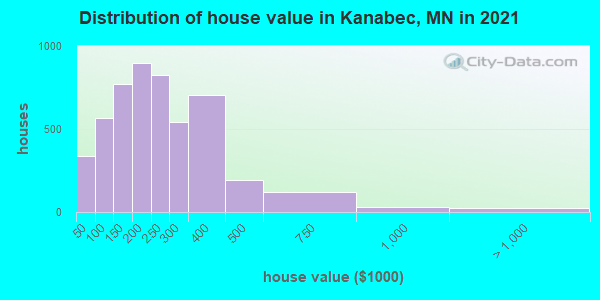
Estimated median house or condo value in 2022: $225,310 (it was $89,800 in 2000)
| Kanabec: | $225,310 |
| Minnesota: | $314,600 |
Median monthly housing costs for homes and condos with a mortgage: $1,461
Median monthly housing costs for units without a mortgage: $579
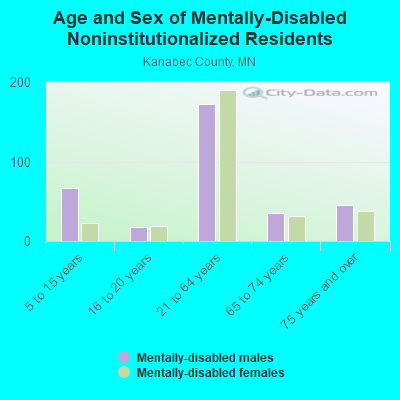
Institutionalized population: 114
Crime in 2021 (reported by the sheriff's office or county police, not the county total):
- Murders: 0
- Rapes: 3
- Robberies: 0
- Assaults: 9
- Burglaries: 15
- Thefts: 47
- Auto thefts: 7
Crime in 2020 (reported by the sheriff's office or county police, not the county total):
- Murders: 0
- Rapes: 0
- Robberies: 0
- Assaults: 6
- Burglaries: 10
- Thefts: 82
- Auto thefts: 4
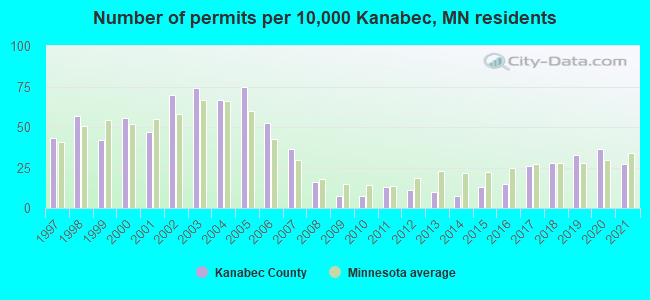
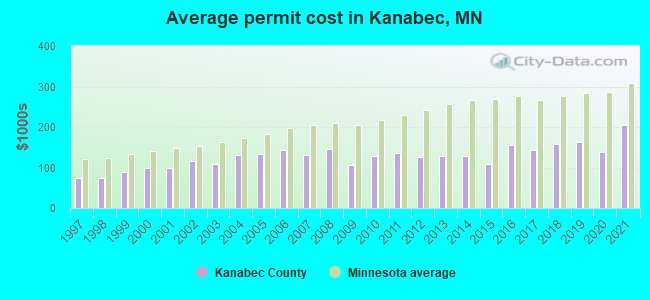
Single-family new house construction building permits:
- 2022: 46 buildings, average cost: $249,000
- 2021: 41 buildings, average cost: $204,100
- 2020: 55 buildings, average cost: $139,300
- 2019: 49 buildings, average cost: $161,700
- 2018: 42 buildings, average cost: $157,000
- 2017: 39 buildings, average cost: $142,700
- 2016: 22 buildings, average cost: $155,200
- 2015: 19 buildings, average cost: $109,100
- 2014: 11 buildings, average cost: $127,900
- 2013: 15 buildings, average cost: $129,400
- 2012: 17 buildings, average cost: $126,000
- 2011: 19 buildings, average cost: $136,000
- 2010: 11 buildings, average cost: $128,700
- 2009: 11 buildings, average cost: $105,300
- 2008: 24 buildings, average cost: $145,600
- 2007: 55 buildings, average cost: $131,000
- 2006: 79 buildings, average cost: $143,300
- 2005: 112 buildings, average cost: $133,600
- 2004: 100 buildings, average cost: $130,400
- 2003: 111 buildings, average cost: $107,700
- 2002: 105 buildings, average cost: $116,200
- 2001: 70 buildings, average cost: $100,000
- 2000: 83 buildings, average cost: $98,600
- 1999: 63 buildings, average cost: $90,400
- 1998: 85 buildings, average cost: $73,600
- 1997: 65 buildings, average cost: $74,200
Median real estate property taxes paid for housing units with mortgages in 2022: $2,429 (1.0%)
Median real estate property taxes paid for housing units with no mortgage in 2022: $2,265 (1.2%)
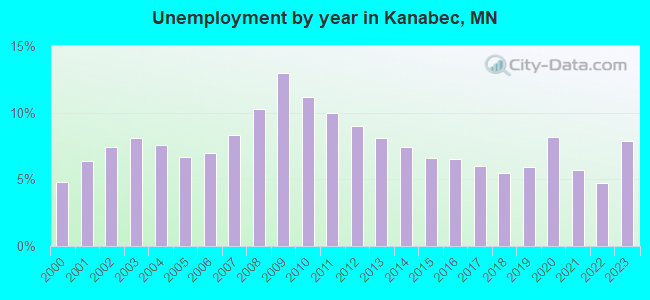
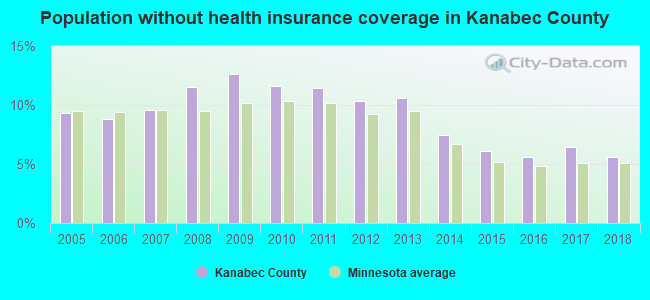
| Kanabec County: | 10.2% |
| Minnesota: | 9.6% |
Median age of residents in 2022: 45.4 years old
(Males: 45.5 years old, Females: 45.3 years old)
(Median age for: White residents: 46.7 years old, Black residents: 23.1 years old, American Indian residents: 37.3 years old, Asian residents: 41.1 years old, Hispanic or Latino residents: 32.1 years old, Other race residents: 40.8 years old)
Fair market rent in 2006 for a 1-bedroom apartment in Kanabec County is $461 a month.
Fair market rent for a 2-bedroom apartment is $606 a month.
Fair market rent for a 3-bedroom apartment is $756 a month.
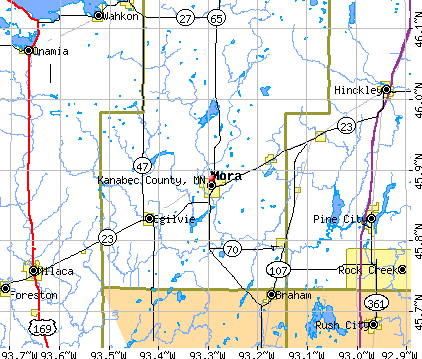
Cities in this county include: Mora, Ogilvie, Grasston, Quamba.
Neighboring counties: Ashland County, Wisconsin  , Clearwater County, Idaho
  , Jefferson County, Montana , Wallowa County, Oregon .
| Here: | 5.5% |
| Minnesota: | 2.6% |
Current college students: 269
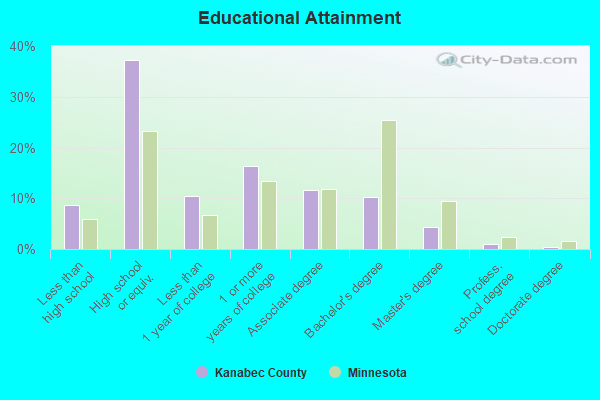
People 25 years of age or older with a high school degree or higher: 91.3%
People 25 years of age or older with a bachelor's degree or higher: 15.0%
Number of foreign born residents: 174 (69.7% naturalized citizens)
| Kanabec County: | 1.1% |
| Whole state: | 8.7% |
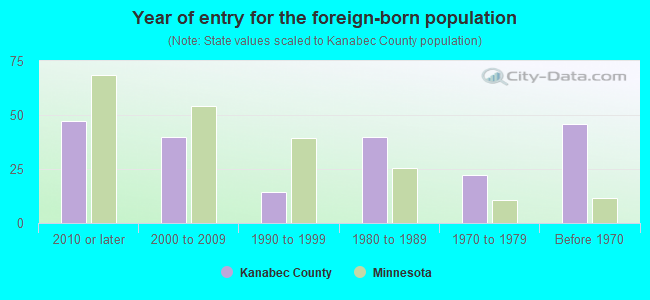
- Year of entry for the foreign-born population
- 632010 or later
- 342000 to 2009
- 141990 to 1999
- 401980 to 1989
- 221970 to 1979
- 46Before 1970
Mean travel time to work (commute): minutes
Percentage of county residents living and working in this county: 98.4%

Housing units in structures:
- One, detached: 6,185
- One, attached: 235
- Two: 55
- 3 or 4: 33
- 5 to 9: 75
- 10 to 19: 101
- 20 to 49: 155
- 50 or more: 63
- Mobile homes: 957
- Boats, RVs, vans, etc.: 10
Housing units in Kanabec County with a mortgage: 3,310 (243 second mortgage, 0 home equity loan, 183 both second mortgage and home equity loan)
Houses without a mortgage: 78
| Here: | 3.7% with mortgage |
| State: | 97.6% with mortgage |
Religion statistics for Kanabec County
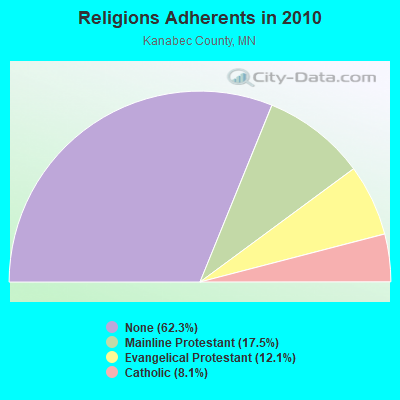
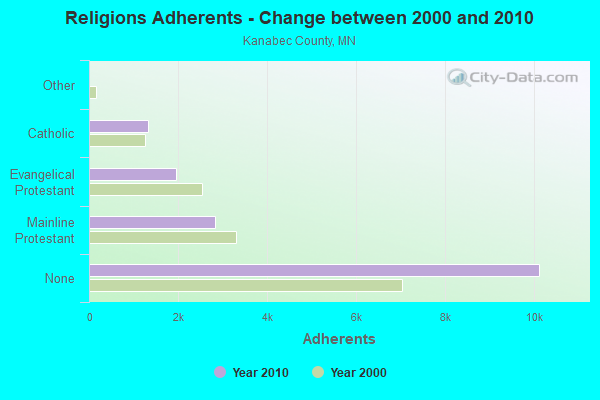
| Religion | Adherents | Congregations |
|---|---|---|
| Mainline Protestant | 2,836 | 8 |
| Evangelical Protestant | 1,960 | 10 |
| Catholic | 1,320 | 2 |
| Other | 2 | 1 |
| None | 10,121 | - |
Source: Clifford Grammich, Kirk Hadaway, Richard Houseal, Dale E.Jones, Alexei Krindatch, Richie Stanley and Richard H.Taylor. 2012. 2010 U.S.Religion Census: Religious Congregations & Membership Study. Association of Statisticians of American Religious Bodies. Jones, Dale E., et al. 2002. Congregations and Membership in the United States 2000. Nashville, TN: Glenmary Research Center.
Food Environment Statistics:
| Kanabec County: | 0.62 / 10,000 pop. |
| State: | 1.83 / 10,000 pop. |
| Kanabec County: | 3.73 / 10,000 pop. |
| Minnesota: | 3.90 / 10,000 pop. |
| This county: | 8.71 / 10,000 pop. |
| State: | 6.98 / 10,000 pop. |
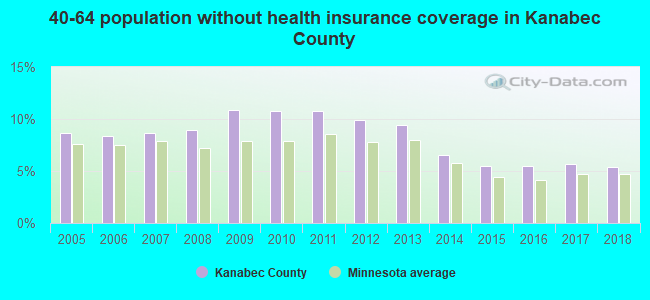
| Kanabec County: | 6.8% |
| Minnesota: | 6.5% |
| Kanabec County: | 27.4% |
| State: | 25.9% |
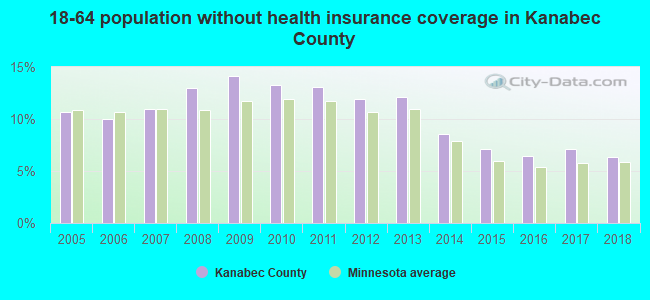
| Here: | 10.1% |
| State: | 13.0% |
Agriculture in Kanabec County:
Average size of farms: 199 acresAverage value of agricultural products sold per farm: $23,862
Average value of crops sold per acre for harvested cropland: $91.37
The value of nursery, greenhouse, floriculture, and sod as a percentage of the total market value of agricultural products sold: 1.44%
The value of livestock, poultry, and their products as a percentage of the total market value of agricultural products sold: 66.86%
Average total farm production expenses per farm: $20,725
Harvested cropland as a percentage of land in farms: 43.40%
Irrigated harvested cropland as a percentage of land in farms: 2.50%
Average market value of all machinery and equipment per farm: $42,356
The percentage of farms operated by a family or individual: 96.23%
Average age of principal farm operators: 54 years
Average number of cattle and calves per 100 acres of all land in farms: 14.50
Milk cows as a percentage of all cattle and calves: 14.55%
Corn for grain: 14823 harvested acres
All wheat for grain: 2068 harvested acres
Soybeans for beans: 10562 harvested acres
Land in orchards: 26 acres
Earthquake activity:
Kanabec County-area historical earthquake activity is significantly above Minnesota state average. It is 55% smaller than the overall U.S. average.On 7/9/1975 at 14:54:15, a magnitude 4.6 (4.6 MB, Class: Light, Intensity: IV - V) earthquake occurred 133.3 miles away from Kanabec County center
On 6/5/1993 at 01:24:53, a magnitude 4.1 (4.1 LG, Depth: 6.2 mi) earthquake occurred 145.4 miles away from the county center
On 3/4/1983 at 06:32:18, a magnitude 4.6 (4.4 MB, 4.6 LG, 4.4 ML) earthquake occurred 320.3 miles away from the county center
On 10/20/1995 at 15:57:18, a magnitude 3.7 (3.7 LG, Depth: 3.1 mi, Class: Light, Intensity: II - III) earthquake occurred 172.1 miles away from the county center
On 2/7/2020 at 18:30:28, a magnitude 3.3 (3.3 ML) earthquake occurred 113.3 miles away from Kanabec County center
On 1/9/2020 at 18:16:48, a magnitude 3.3 (3.3 MB) earthquake occurred 118.5 miles away from the county center
Magnitude types: regional Lg-wave magnitude (LG), body-wave magnitude (MB), local magnitude (ML)
Most recent natural disasters:
- Minnesota Covid-19 Pandemic, Incident Period: January 20, 2020, FEMA Id: 4531, Natural disaster type: Other
- Minnesota Severe Storms, Tornadoes, Straight-line Winds, And Flooding, Incident Period: June 15, 2018 - July 12, 2018, FEMA Id: 4390, Natural disaster type: Storm, Tornado, Flood, Wind
- Minnesota Severe Storms, Flooding, and Tornadoes, Incident Period: July 01, 2011 to July 11, 2011, Major Disaster (Presidential) Declared DR-4009: July 28, 2011, FEMA Id: 4009, Natural disaster type: Storm, Tornado, Flood
- Minnesota Hurricane Katrina Evacuation, Incident Period: August 29, 2005 to October 01, 2005, Emergency Declared EM-3242: September 13, 2005, FEMA Id: 3242, Natural disaster type: Hurricane
- Minnesota Flooding, Incident Period: March 23, 2001 to July 03, 2001, Major Disaster (Presidential) Declared DR-1370: May 16, 2001, FEMA Id: 1370, Natural disaster type: Flood
- Minnesota Drought, Incident Period: June 17, 1976, Emergency Declared EM-3013: June 17, 1976, FEMA Id: 3013, Natural disaster type: Drought
- Minnesota SEVERE STORMS, FLOODING, Incident Period: August 01, 1972, Major Disaster (Presidential) Declared DR-347: August 01, 1972, FEMA Id: 347, Natural disaster type: Storm, Flood
- Minnesota FLOODING, Incident Period: April 18, 1969, Major Disaster (Presidential) Declared DR-255: April 18, 1969, FEMA Id: 255, Natural disaster type: Flood
- Minnesota FLOODING, Incident Period: April 11, 1965, Major Disaster (Presidential) Declared DR-188: April 11, 1965, FEMA Id: 188, Natural disaster type: Flood
The number of natural disasters in Kanabec County (9) is smaller than the US average (15).
Major Disasters (Presidential) Declared: 5
Emergencies Declared: 2
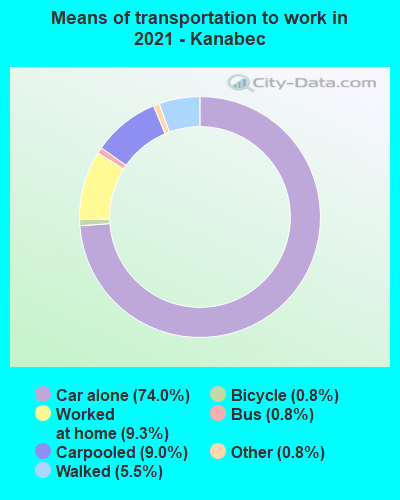
Means of transportation to work:
- Drove a car alone: 3,423 (70.3%)
- Carpooled: 441 (9.1%)
- Bus: 16 (0.3%)
- Taxicab, motorcycle, or other means: 51 (1.0%)
- Bicycle: 20 (0.4%)
- Walked: 271 (5.6%)
- Worked at home: 624 (12.8%)
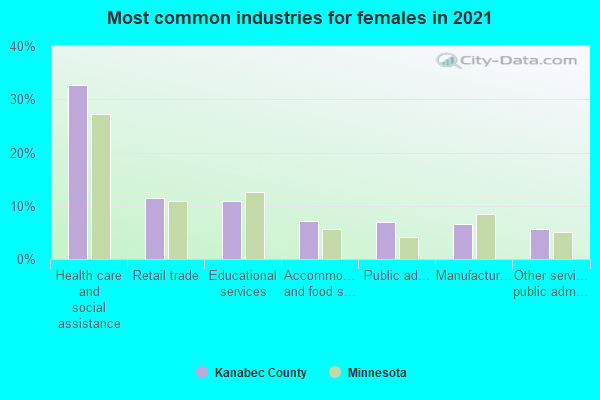
- Health care and social assistance (26%)
- Retail trade (11%)
- Educational services (11%)
- Accommodation and food services (7%)
- Public administration (6%)
- Manufacturing (6%)
- Other services, except public administration (5%)
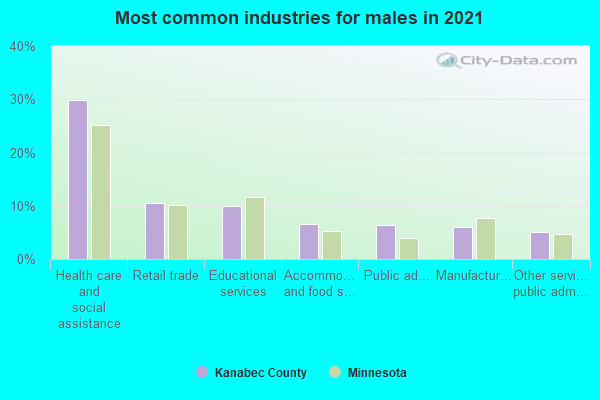
- Health care and social assistance (29%)
- Retail trade (13%)
- Educational services (12%)
- Accommodation and food services (8%)
- Public administration (7%)
- Manufacturing (6%)
- Other services, except public administration (6%)
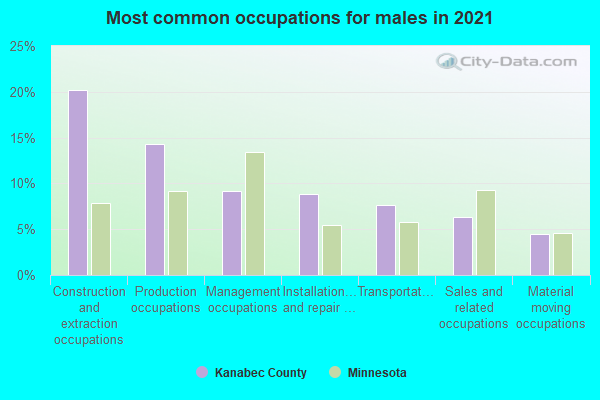
- Construction and extraction occupations (22%)
- Production occupations (14%)
- Installation, maintenance, and repair occupations (9%)
- Management occupations (8%)
- Sales and related occupations (8%)
- Transportation occupations (7%)
- Material moving occupations (6%)
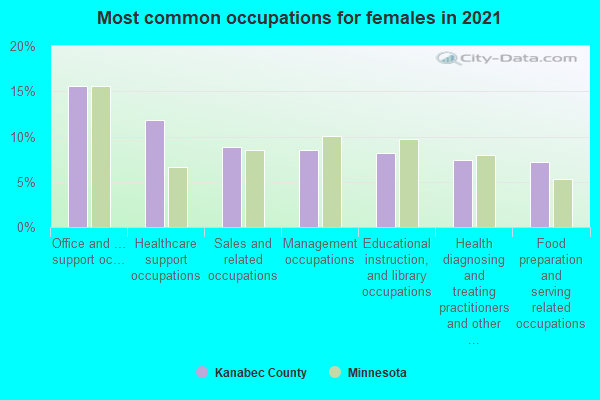
- Office and administrative support occupations (16%)
- Educational instruction, and library occupations (9%)
- Sales and related occupations (9%)
- Healthcare support occupations (8%)
- Management occupations (8%)
- Food preparation and serving related occupations (8%)
- Health diagnosing and treating practitioners and other technical occupations (7%)
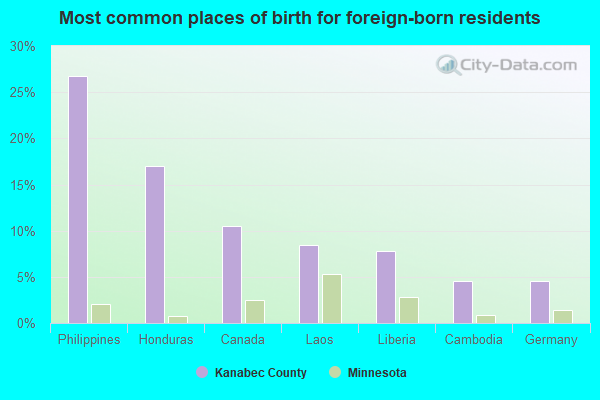
- Canada (17%)
- Honduras (14%)
- Philippines (13%)
- Laos (9%)
- Cambodia (6%)
- Nigeria (6%)
- Liberia (5%)
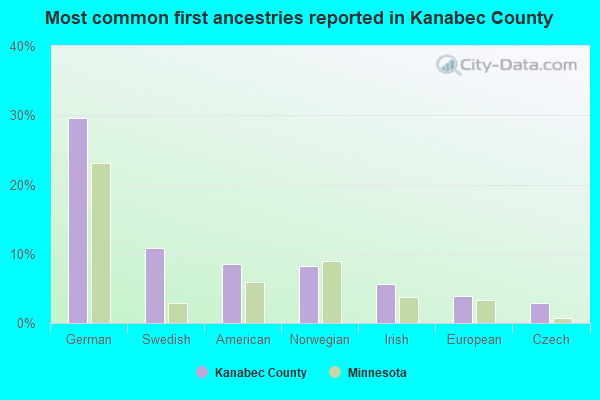
- German (28%)
- American (12%)
- Swedish (9%)
- Norwegian (8%)
- Irish (5%)
- European (5%)
- Scandinavian (3%)

People in group quarters in Kanabec County, Minnesota in 2010:
- 85 people in nursing facilities/skilled-nursing facilities
- 66 people in group homes intended for adults
- 62 people in other noninstitutional facilities
- 29 people in local jails and other municipal confinement facilities
- 4 people in workers' group living quarters and job corps centers
People in group quarters in Kanabec County, Minnesota in 2000:
- 91 people in nursing homes
- 18 people in local jails and other confinement facilities (including police lockups)
- 13 people in homes for the mentally retarded
7.99% of this county's 2021 resident taxpayers lived in other counties in 2020 ($55,482 average adjusted gross income)
| Here: | 7.99% |
| Minnesota average: | 7.43% |
10 or fewer of this county's residents moved from foreign countries.
7.03% relocated from other counties in Minnesota ($49,375 average AGI)
0.96% relocated from other states ($6,107 average AGI)
Kanabec County: 0.96% Minnesota average: 2.06%
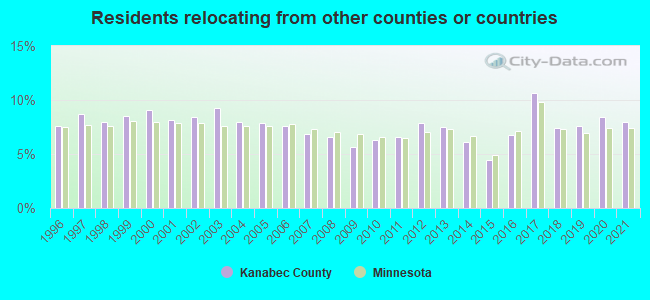
Top counties from which taxpayers relocated into this county between 2020 and 2021:
| from Isanti County, MN | |
| from Anoka County, MN | |
| from Hennepin County, MN | |
| from Pine County, MN | |
| from Mille Lacs County, MN | |
| from Ramsey County, MN |
6.95% of this county's 2020 resident taxpayers moved to other counties in 2021 ($49,079 average adjusted gross income)
| Here: | 6.95% |
| Minnesota average: | 7.79% |
10 or fewer of this county's residents moved to foreign countries.
5.90% relocated to other counties in Minnesota ($40,115 average AGI)
1.05% relocated to other states ($8,966 average AGI)
Kanabec County: 1.05% Minnesota average: 2.44%
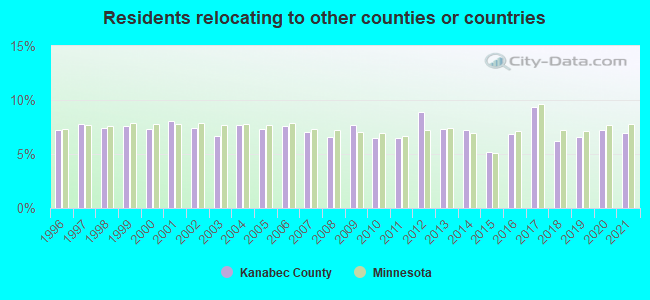
Top counties to which taxpayers relocated from this county between 2020 and 2021:
| to Pine County, MN | |
| to Isanti County, MN | |
| to Mille Lacs County, MN | |
| to Hennepin County, MN | |
| to Anoka County, MN |
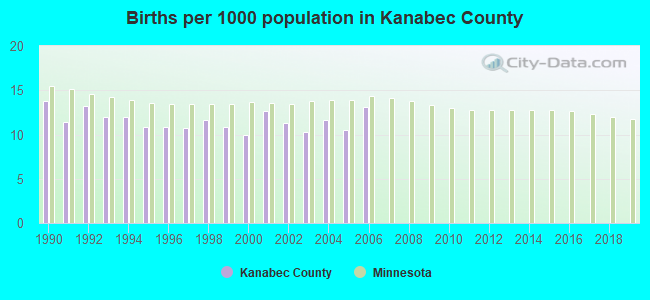
Births per 1000 population from 1990 to 1999: 11.7
Births per 1000 population from 2000 to 2006: 11.3
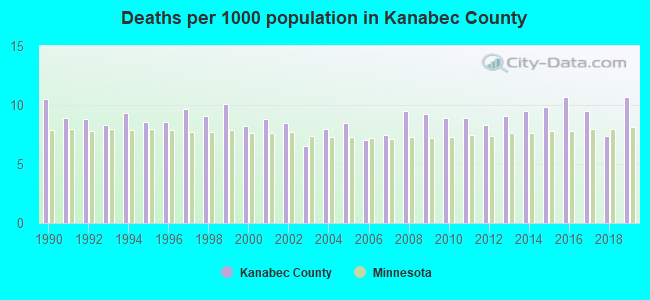
Deaths per 1000 population from 1990 to 1999: 9.2
Deaths per 1000 population from 2000 to 2009: 8.2
Deaths per 1000 population from 2010 to 2020: 9.6
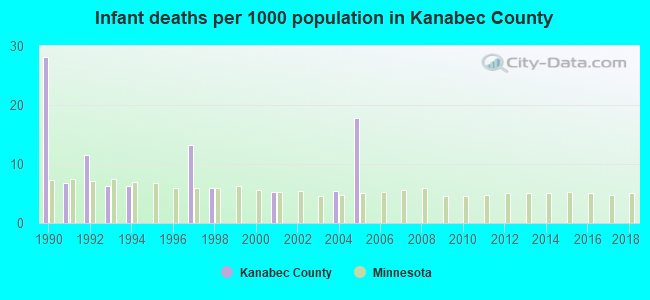
Infant deaths per 1000 live births from 1990 to 1999: 7.8
Infant deaths per 1000 live births from 2000 to 2006: 4.1
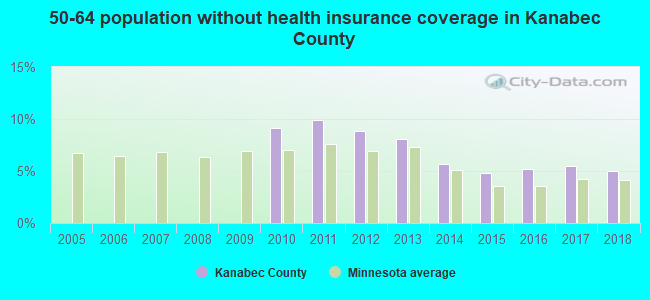
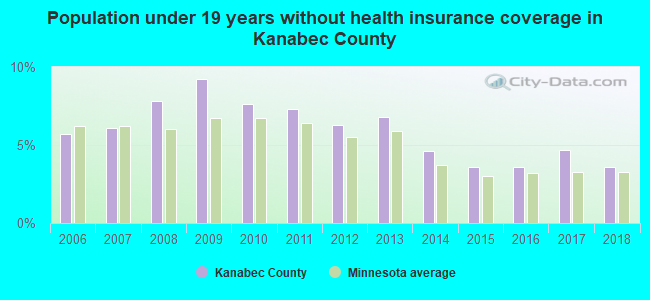
Persons under 19 years old without health insurance coverage in 2018: 3.6%
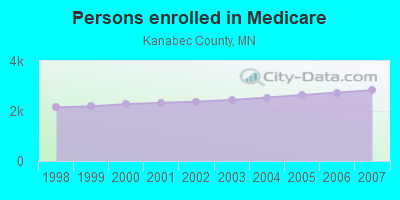
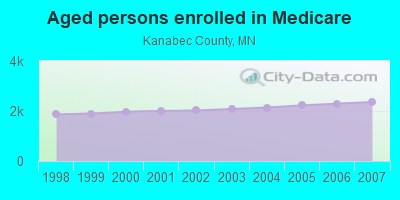
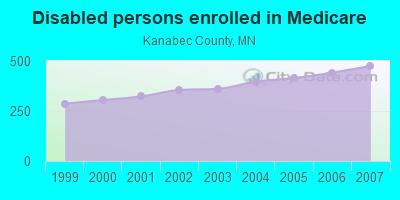
Persons enrolled in hospital insurance and/or supplemental medical insurance (Medicare) in July 1, 2007: 2,833 (2,358 aged, 475 disabled)
Children under 18 without health insurance coverage in 2007: 208 (5%)
Most common underlying causes of death in Kanabec County, Minnesota in 1999 - 2019:
- Bronchus or lung, unspecified - Malignant neoplasms (137)
- Unspecified dementia (60)
- Chronic obstructive pulmonary disease, unspecified (52)
- Atherosclerotic heart disease (32)
- Acute myocardial infarction, unspecified (22)
- Congestive heart failure (21)
- Other ill-defined and unspecified causes of mortality (12)
Population without health insurance coverage in 2000: 11%
Children under 18 without health insurance coverage in 2000: 8%
Short term general hospital admissions per 100,000 population in 2004: 11,155
Short term general hospital beds per 100,000 population in 2004: 156
Emergency room visits per 100,000 population in 2004: 45,416
General practice office based MDs per 100,000 population in 2005: 1,036
Medical specialist MDs per 100,000 population in 2005: 820
Dentists per 100,000 population in 1998: 18
Total births per 100,000 population, July 2005 - July 2006 : 42
Total deaths per 100,000 population, July 2005 - July 2006: 37
Limited-service eating places per 100,000 population in 2005 : 12
Household type by relationship:
Households: 16,207- Male householders: 3,450 (937 living alone), Female householders: 3,256 (904 living alone)
3,481 spouses (3,476 opposite-sex spouses), 650 unmarried partners, (648 opposite-sex unmarried partners), 3,916 children (3,536 natural, 152 adopted, 215 stepchildren), 211 grandchildren, 196 brothers or sisters, 167 parents, 104 foster children, 138 other relatives, 357 non-relatives
- In group quarters: 277
Size of family households: 2,312 2-persons, 728 3-persons, 645 4-persons, 410 5-persons, 202 6-persons, 98 7-or-more-persons.
Size of nonfamily households: 1,842 1-person, 415 2-persons, 51 3-persons, 1 4-persons, 6 5-persons.
2,265 married couples with children.
771 single-parent households (359 men, 412 women).
97.4% of residents of Kanabec speak English at home.
0.8% of residents speak Spanish at home (76% speak English very well, 23% speak English not well, 1% don't speak English at all).
1.5% of residents speak other Indo-European language at home (81% speak English very well, 18% speak English well, 1% don't speak English at all).
0.3% of residents speak Asian or Pacific Island language at home (84% speak English very well, 16% speak English well).
In fiscal year 2004:
Federal Government expenditure: $68,635,000 ($4,275 per capita)
Department of Defense expenditure: $821,000
Federal direct payments to individuals for retirement and disability: $35,511,000
Federal other direct payments to individuals: $11,278,000
Federal direct payments not to individuals: $1,601,000
Federal grants: $16,601,000
Federal procurement contracts: $935,000 ($0,000 Department of Defense)
Federal salaries and wages: $2,709,000 ($0,000 Department of Defense)
Federal Government direct loans: $595,000
Federal guaranteed/insured loans: $6,210,000
Federal Government insurance: $6,895,000
Population change from April 1, 2000 to July 1, 2005:
Births: 888| Here: | 55 per 1000 residents |
| State: | 70 per 1000 residents |
Deaths: 607
| Here: | 37 per 1000 residents |
| State: | 38 per 1000 residents |
Net international migration: +2
| Here: | +0 per 1000 residents |
| State: | +14 per 1000 residents |
Net internal migration: +966
| Here: | |
| State: |
Total withdrawal of fresh water for public supply: 0.40 millions of gallons per day (all from ground)
| Here: | 6.1 |
| State: | 7.1 |
| Here: | 4.4 |
| State: | 3.8 |
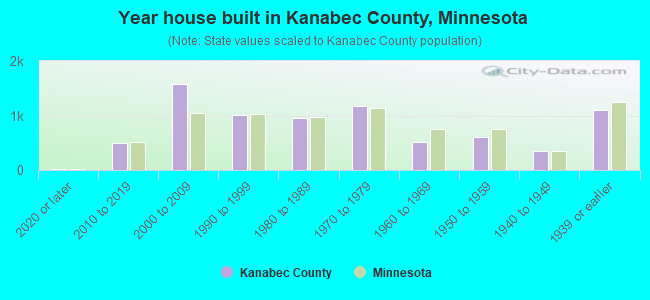
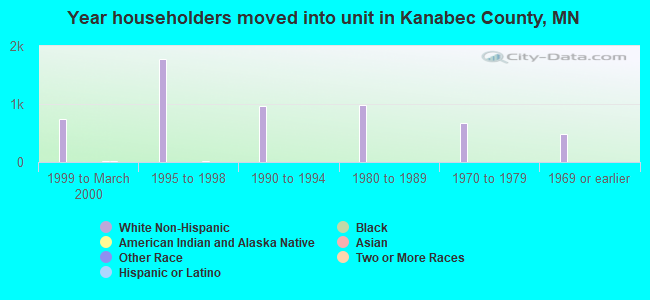
- Year house built in Kanabec County, Minnesota
- 412020 or later
- 5702010 to 2019
- 1,6382000 to 2009
- 9661990 to 1999
- 1,0201980 to 1989
- 1,0971970 to 1979
- 4951960 to 1969
- 6121950 to 1959
- 3181940 to 1949
- 1,0981939 or earlier
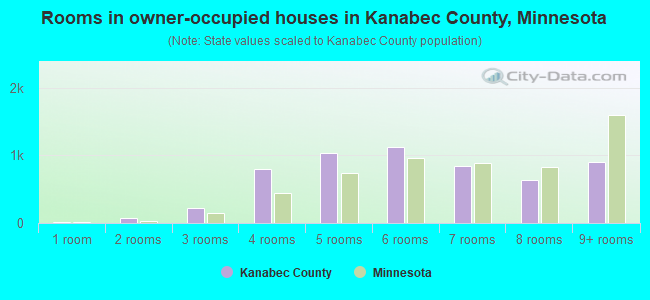
- Rooms in owner-occupied houses in Kanabec County, Minnesota
- 261 room
- 842 rooms
- 2103 rooms
- 7634 rooms
- 1,0265 rooms
- 1,1886 rooms
- 8087 rooms
- 6198 rooms
- 9389+ rooms
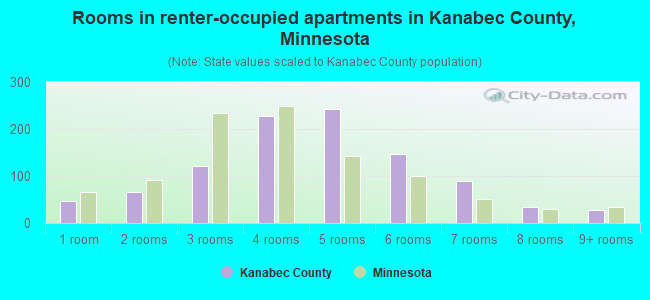
- Rooms in renter-occupied apartments in Kanabec County, Minnesota
- 281 room
- 882 rooms
- 1313 rooms
- 2734 rooms
- 2505 rooms
- 1166 rooms
- 817 rooms
- 298 rooms
- 309+ rooms
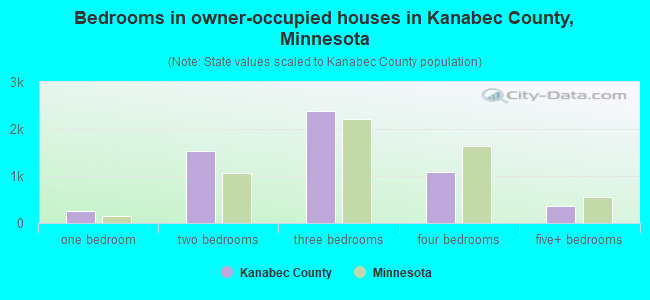
- Bedrooms in owner-occupied houses in Kanabec County, Minnesota
- 31no bedroom
- 2431 bedroom
- 1,4892 bedrooms
- 2,4093 bedrooms
- 1,1194 bedrooms
- 3445+ bedrooms
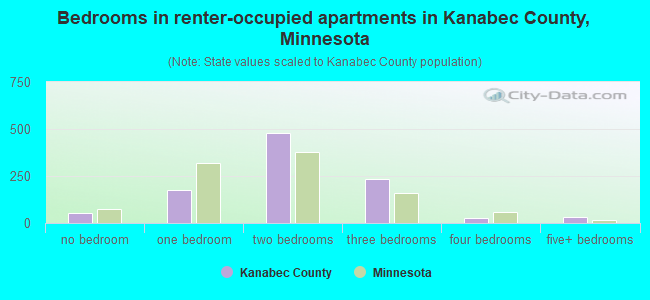
- Bedrooms in renter-occupied apartments in Kanabec County, Minnesota
- 38no bedroom
- 2171 bedroom
- 4602 bedrooms
- 2603 bedrooms
- 264 bedrooms
- 265+ bedrooms
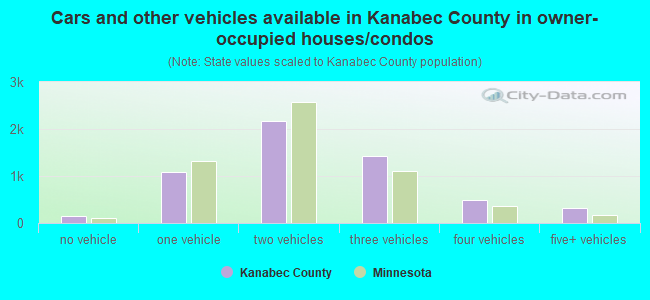
- Cars and other vehicles available in Kanabec County in owner-occupied houses/condos
- 129no vehicle
- 1,0931 vehicle
- 2,2262 vehicles
- 1,3323 vehicles
- 5184 vehicles
- 3505+ vehicles
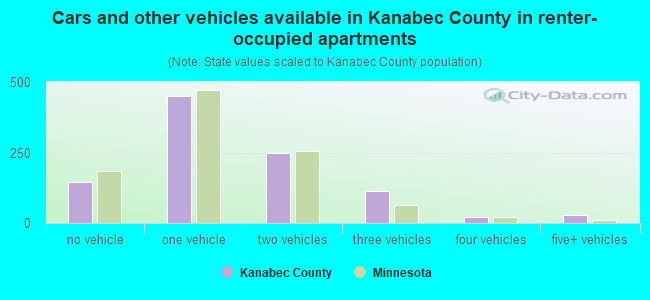
- Cars and other vehicles available in Kanabec County in renter-occupied apartments
- 193no vehicle
- 4491 vehicle
- 2212 vehicles
- 1313 vehicles
- 274 vehicles
- 145+ vehicles
91.9% of Kanabec County residents lived in the same house 1 years ago.
Out of people who lived in different houses, 30% lived in this county.
Out of people who lived in different counties, 83% lived in Minnesota.
| Kanabec County: | 91.9% |
| State average: | 87.4% |
Place of birth for U.S.-born residents:
- This state: 13,454
- Other state: 2,455
- Northeast: 96
- Midwest: 1,610
- South: 314
- West: 425
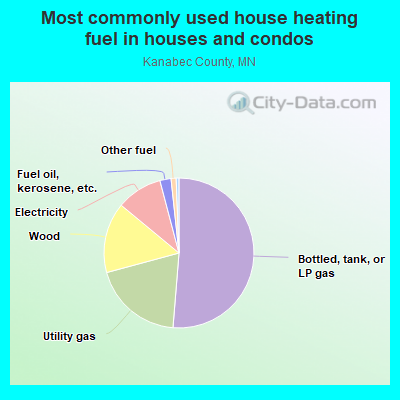
- 51.9%Bottled, tank, or LP gas
- 20.5%Utility gas
- 14.6%Wood
- 9.1%Electricity
- 2.1%Fuel oil, kerosene, etc.
- 0.9%Other fuel
- 0.9%No fuel used
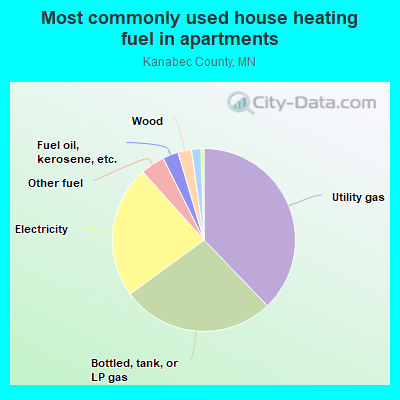
- 33.5%Utility gas
- 30.0%Bottled, tank, or LP gas
- 24.7%Electricity
- 4.4%Other fuel
- 3.1%Fuel oil, kerosene, etc.
- 2.1%Wood
- 2.1%No fuel used
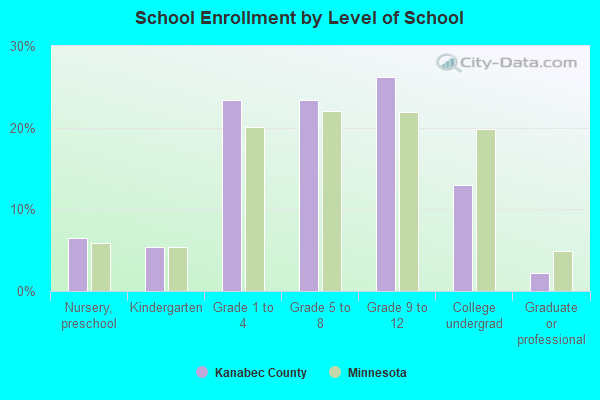
Private vs. public school enrollment:
| Here: | 13.4% |
| Minnesota: | 12.9% |
| Here: | 7.8% |
| Minnesota: | 8.6% |
| Here: | 11.2% |
| Minnesota: | 26.2% |
Kanabec County government finances - Expenditure in 2018:
- Assistance and Subsidies - Public Welfare, Federal Categorical Assistance Programs: $1,833,000
- Charges - Hospital Public: $80,482,000
Other: $3,312,000
Regular Highways: $297,000
- Construction - Regular Highways: $4,113,000
- Current Operations - Hospitals: $79,120,000
Public Welfare - Other: $3,952,000
Correctional Institutions: $3,557,000
General - Other: $3,552,000
Regular Highways: $2,429,000
Police Protection: $2,425,000
Health - Other: $2,402,000
Transit Utilities: $1,505,000
Financial Administration: $1,146,000
Central Staff Services: $176,000
Natural Resources - Other: $174,000
Libraries: $144,000
Solid Waste Management: $91,000
Parks and Recreation: $9,000
- Federal Intergovernmental - Public Welfare: $2,114,000
Highways: $1,104,000
Other: $234,000
- General - Interest on Debt: $1,550,000
- Local Intergovernmental - Other: $142,000
- Long Term Debt - Beginning Outstanding - Unspecified Public Purpose: $38,762,000
Outstanding Unspecified Public Purpose: $27,325,000
Retired Unspecified Public Purpose: $11,528,000
Issue, Unspecified Public Purpose: $92,000
- Miscellaneous - General Revenue - Other: $1,315,000
Special Assessments: $94,000
Fines and Forfeits: $2,000
Interest Earnings: $0
- Other Capital Outlay - Hospitals: $11,134,000
Police Protection: $155,000
Transit Utilities: $85,000
Regular Highways: $71,000
General - Other: $10,000
- Revenue - Transit Utilities: $863,000
- State Intergovernmental - Highways: $4,518,000
Public Welfare: $1,776,000
Other: $1,332,000
General Local Government Support: $1,322,000
Health and Hospitals: $4,000
- Tax - Property: $11,514,000
Other License: $122,000
Kanabec County government finances - Revenue in 2018:
- Assistance and Subsidies - Public Welfare, Federal Categorical Assistance Programs: $1,833,000
- Charges - Hospital Public: $80,482,000
Other: $3,312,000
Regular Highways: $297,000
- Construction - Regular Highways: $4,113,000
- Current Operations - Hospitals: $79,120,000
Public Welfare - Other: $3,952,000
Correctional Institutions: $3,557,000
General - Other: $3,552,000
Regular Highways: $2,429,000
Police Protection: $2,425,000
Health - Other: $2,402,000
Transit Utilities: $1,505,000
Financial Administration: $1,146,000
Central Staff Services: $176,000
Natural Resources - Other: $174,000
Libraries: $144,000
Solid Waste Management: $91,000
Parks and Recreation: $9,000
- Federal Intergovernmental - Public Welfare: $2,114,000
Highways: $1,104,000
Other: $234,000
- General - Interest on Debt: $1,550,000
- Local Intergovernmental - Other: $142,000
- Long Term Debt - Beginning Outstanding - Unspecified Public Purpose: $38,762,000
Outstanding Unspecified Public Purpose: $27,325,000
Retired Unspecified Public Purpose: $11,528,000
Issue, Unspecified Public Purpose: $92,000
- Miscellaneous - General Revenue - Other: $1,315,000
Special Assessments: $94,000
Fines and Forfeits: $2,000
Interest Earnings: $0
- Other Capital Outlay - Hospitals: $11,134,000
Police Protection: $155,000
Transit Utilities: $85,000
Regular Highways: $71,000
General - Other: $10,000
- Revenue - Transit Utilities: $863,000
- State Intergovernmental - Highways: $4,518,000
Public Welfare: $1,776,000
Other: $1,332,000
General Local Government Support: $1,322,000
Health and Hospitals: $4,000
- Tax - Property: $11,514,000
Other License: $122,000
Kanabec County government finances - Debt in 2018:
- Assistance and Subsidies - Public Welfare, Federal Categorical Assistance Programs: $1,833,000
- Charges - Hospital Public: $80,482,000
Other: $3,312,000
Regular Highways: $297,000
- Construction - Regular Highways: $4,113,000
- Current Operations - Hospitals: $79,120,000
Public Welfare - Other: $3,952,000
Correctional Institutions: $3,557,000
General - Other: $3,552,000
Regular Highways: $2,429,000
Police Protection: $2,425,000
Health - Other: $2,402,000
Transit Utilities: $1,505,000
Financial Administration: $1,146,000
Central Staff Services: $176,000
Natural Resources - Other: $174,000
Libraries: $144,000
Solid Waste Management: $91,000
Parks and Recreation: $9,000
- Federal Intergovernmental - Public Welfare: $2,114,000
Highways: $1,104,000
Other: $234,000
- General - Interest on Debt: $1,550,000
- Local Intergovernmental - Other: $142,000
- Long Term Debt - Beginning Outstanding - Unspecified Public Purpose: $38,762,000
Outstanding Unspecified Public Purpose: $27,325,000
Retired Unspecified Public Purpose: $11,528,000
Issue, Unspecified Public Purpose: $92,000
- Miscellaneous - General Revenue - Other: $1,315,000
Special Assessments: $94,000
Fines and Forfeits: $2,000
Interest Earnings: $0
- Other Capital Outlay - Hospitals: $11,134,000
Police Protection: $155,000
Transit Utilities: $85,000
Regular Highways: $71,000
General - Other: $10,000
- Revenue - Transit Utilities: $863,000
- State Intergovernmental - Highways: $4,518,000
Public Welfare: $1,776,000
Other: $1,332,000
General Local Government Support: $1,322,000
Health and Hospitals: $4,000
- Tax - Property: $11,514,000
Other License: $122,000
Kanabec County government finances - Cash and Securities in 2018:
- Assistance and Subsidies - Public Welfare, Federal Categorical Assistance Programs: $1,833,000
- Charges - Hospital Public: $80,482,000
Other: $3,312,000
Regular Highways: $297,000
- Construction - Regular Highways: $4,113,000
- Current Operations - Hospitals: $79,120,000
Public Welfare - Other: $3,952,000
Correctional Institutions: $3,557,000
General - Other: $3,552,000
Regular Highways: $2,429,000
Police Protection: $2,425,000
Health - Other: $2,402,000
Transit Utilities: $1,505,000
Financial Administration: $1,146,000
Central Staff Services: $176,000
Natural Resources - Other: $174,000
Libraries: $144,000
Solid Waste Management: $91,000
Parks and Recreation: $9,000
- Federal Intergovernmental - Public Welfare: $2,114,000
Highways: $1,104,000
Other: $234,000
- General - Interest on Debt: $1,550,000
- Local Intergovernmental - Other: $142,000
- Long Term Debt - Beginning Outstanding - Unspecified Public Purpose: $38,762,000
Outstanding Unspecified Public Purpose: $27,325,000
Retired Unspecified Public Purpose: $11,528,000
Issue, Unspecified Public Purpose: $92,000
- Miscellaneous - General Revenue - Other: $1,315,000
Special Assessments: $94,000
Fines and Forfeits: $2,000
Interest Earnings: $0
- Other Capital Outlay - Hospitals: $11,134,000
Police Protection: $155,000
Transit Utilities: $85,000
Regular Highways: $71,000
General - Other: $10,000
- Revenue - Transit Utilities: $863,000
- State Intergovernmental - Highways: $4,518,000
Public Welfare: $1,776,000
Other: $1,332,000
General Local Government Support: $1,322,000
Health and Hospitals: $4,000
- Tax - Property: $11,514,000
Other License: $122,000
Supplemental Security Income (SSI) in 2006:
- Total number of recipients: 220
- Number of aged recipients: 21
- Number of blind and disabled recipients: 199
- Number of recipients under 18: 32
- Number of recipients between 18 and 64: 148
- Number of recipients older than 64: 40
- Number of recipients also receiving OASDI: 94
- Amount of payments (thousands of dollars): 86
| Most common first names in Kanabec County, MN among deceased individuals | ||
| Name | Count | Lived (average) |
|---|---|---|
| John | 81 | 75.0 years |
| William | 52 | 76.8 years |
| Robert | 50 | 71.4 years |
| George | 50 | 79.8 years |
| Carl | 44 | 76.8 years |
| Mary | 41 | 82.0 years |
| Helen | 36 | 81.3 years |
| Arthur | 36 | 79.7 years |
| James | 35 | 67.8 years |
| Henry | 34 | 75.9 years |
| Most common last names in Kanabec County, MN among deceased individuals | ||
| Last name | Count | Lived (average) |
|---|---|---|
| Johnson | 101 | 77.1 years |
| Nelson | 76 | 79.9 years |
| Anderson | 61 | 76.3 years |
| Olson | 58 | 79.0 years |
| Peterson | 52 | 78.0 years |
| Erickson | 30 | 80.2 years |
| Carlson | 29 | 76.2 years |
| Larson | 27 | 80.0 years |
| Smith | 20 | 78.9 years |
| Miller | 19 | 85.5 years |
| Businesses in Kanabec County, MN | ||||
| Name | Count | Name | Count | |
|---|---|---|---|---|
| Ace Hardware | 1 | Jones New York | 1 | |
| AmericInn | 1 | Lane Furniture | 1 | |
| Chevrolet | 1 | Nike | 1 | |
| Curves | 1 | Pizza Hut | 1 | |
| Dairy Queen | 1 | RadioShack | 1 | |
| FedEx | 1 | Subway | 1 | |
| H&R Block | 1 | U-Haul | 1 | |
| Hardee's | 1 | UPS | 3 | |