Osage County, Kansas (KS)
County owner-occupied free and clear houses and condos in 2010: 1,896
County owner-occupied houses and condos in 2000: 5,176
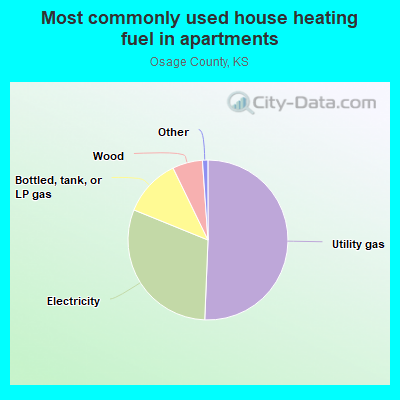
Renter-occupied apartments: 1,401 (it was 1,314 in 2000)
| % of renters here: | 20% |
| State: | 32% |
Land area: 704 sq. mi.
Water area: 15.7 sq. mi.
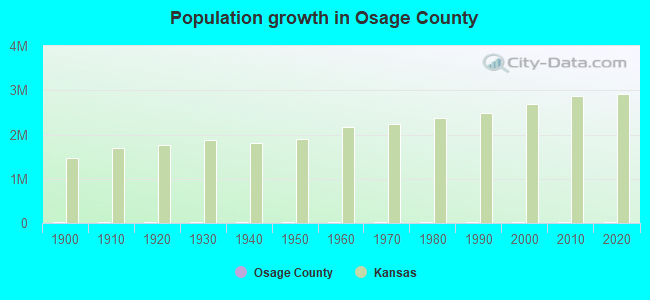
Population density: 22 people per square mile (low).
Industries providing employment: Educational, health and social services (23.9%), Transportation and warehousing,and utilities (11.4%).
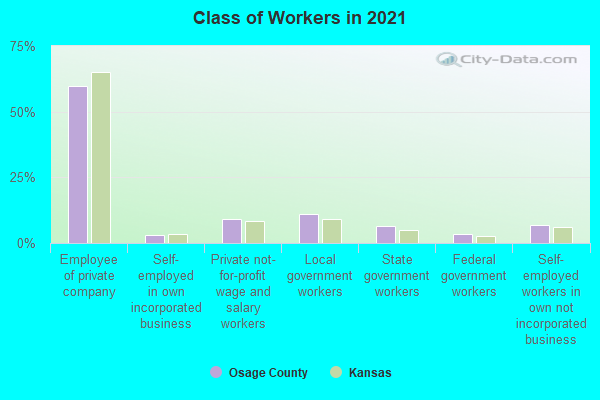
Type of workers:
- Private wage or salary: 74%
- Government: 20%
- Self-employed, not incorporated: 7%
- Unpaid family work: 0%
- OSM Map
- General Map
- Google Map
- MSN Map

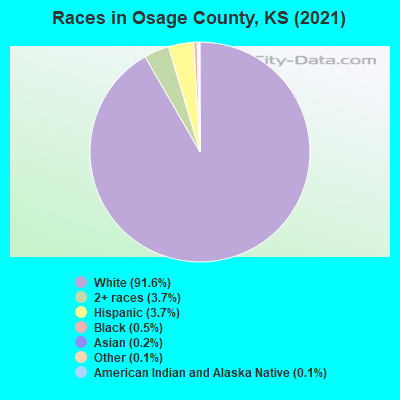
- 14,39491.6%White Non-Hispanic Alone
- 5863.7%Hispanic or Latino
- 5793.7%Two or more races
- 540.3%Black Non-Hispanic Alone
- 460.3%Some other race alone
- 300.2%American Indian and Alaska Native alone
- 210.1%Asian alone
- 30.02%Native Hawaiian and Other
Pacific Islander alone
| Median resident age: | 43.2 years |
| Kansas median age: | 37.6 years |
| Males: 8,100 | |
| Females: 7,693 |

 | The mystery of black leopards in Kansas!? (68 replies) |
| Topeka KS - consider of relocating (51 replies) |
| Moving TO KS ... Help Deciding Where (21 replies) |
| Relocating to Lyon/Coffey area (2 replies) |
| Osage County: | 2.0 people |
| Kansas: | 2 people |
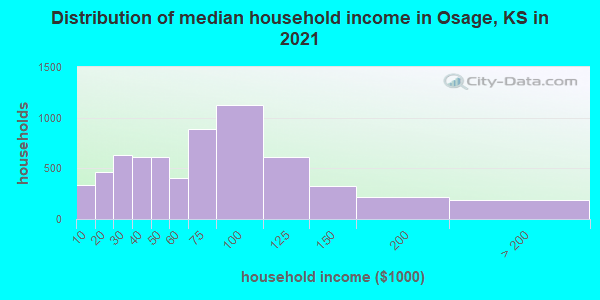
Estimated median household income in 2022: $65,375 ($37,928 in 1999)
| This county: | $65,375 |
| Kansas: | $68,925 |
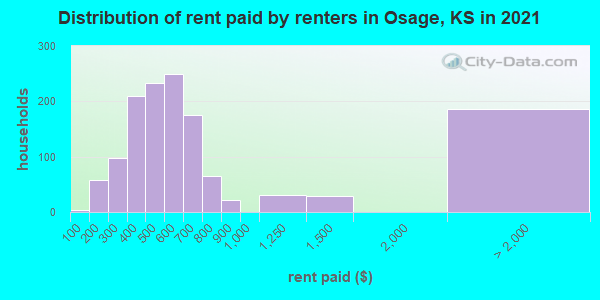
Median contract rent in 2022 for apartments: $508 (lower quartile is $381, upper quartile is $639)
| This county: | $508 |
| State: | $772 |
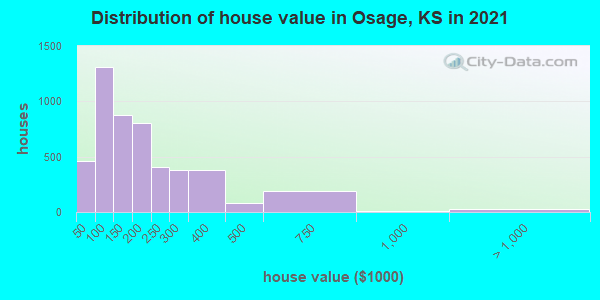
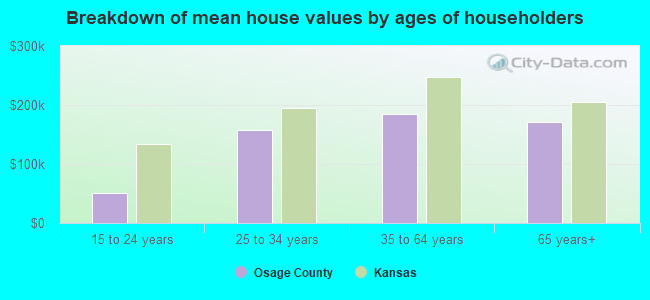
Estimated median house or condo value in 2022: $151,048 (it was $71,500 in 2000)
| Osage: | $151,048 |
| Kansas: | $206,600 |
Median monthly housing costs for homes and condos with a mortgage: $1,256
Median monthly housing costs for units without a mortgage: $567
Institutionalized population: 173
Crime in 2021 (reported by the sheriff's office or county police, not the county total):
- Murders: 0
- Rapes: 1
- Robberies: 0
- Assaults: 20
- Burglaries: 49
- Thefts: 25
- Auto thefts: 1
Crime in 2020 (reported by the sheriff's office or county police, not the county total):
- Murders: 0
- Rapes: 0
- Robberies: 0
- Assaults: 22
- Burglaries: 24
- Thefts: 20
- Auto thefts: 10
Health of residents in Osage County based on CDC Behavioral Risk Factor Surveillance System Survey Questionnaires from 2013 to 2021:
General health status score of residents in this county from 1 (poor) to 5 (excellent) is 3.4. This is about average.70.8% of residents exercised in the past month. This is about average.
44.8% of residents smoked 100+ cigarettes in their lives. This is about average.
50.4% of adult residents drank alcohol in the past 30 days. This is less than average.
72.0% of residents visited a dentist within the past year. This is about average.
Average weight of males is 207 pounds. This is more than average.
Average weight of females is 171 pounds. This is more than average.
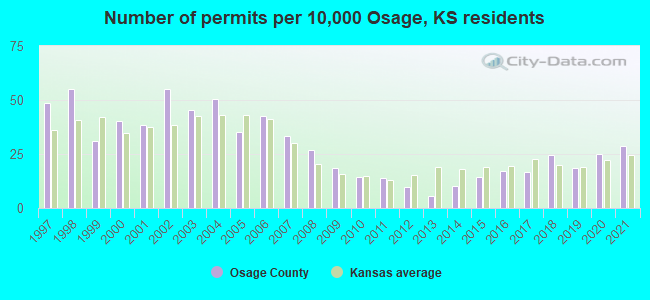
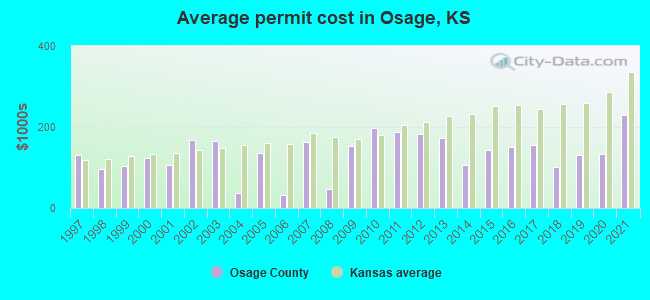
Single-family new house construction building permits:
- 2022: 106 buildings, average cost: $132,700
- 2021: 48 buildings, average cost: $229,500
- 2020: 42 buildings, average cost: $134,200
- 2019: 31 buildings, average cost: $129,900
- 2018: 41 buildings, average cost: $102,300
- 2017: 28 buildings, average cost: $155,300
- 2016: 29 buildings, average cost: $151,400
- 2015: 24 buildings, average cost: $141,900
- 2014: 17 buildings, average cost: $106,600
- 2013: 9 buildings, average cost: $171,700
- 2012: 16 buildings, average cost: $183,300
- 2011: 23 buildings, average cost: $187,700
- 2010: 24 buildings, average cost: $196,500
- 2009: 31 buildings, average cost: $152,500
- 2008: 45 buildings, average cost: $45,900
- 2007: 56 buildings, average cost: $163,400
- 2006: 71 buildings, average cost: $32,900
- 2005: 59 buildings, average cost: $134,500
- 2004: 84 buildings, average cost: $36,500
- 2003: 76 buildings, average cost: $164,600
- 2002: 92 buildings, average cost: $167,900
- 2001: 64 buildings, average cost: $106,800
- 2000: 67 buildings, average cost: $124,400
- 1999: 52 buildings, average cost: $102,900
- 1998: 92 buildings, average cost: $96,400
- 1997: 81 buildings, average cost: $132,200
Median real estate property taxes paid for housing units with mortgages in 2022: $2,304 (1.4%)
Median real estate property taxes paid for housing units with no mortgage in 2022: $2,132 (1.6%)
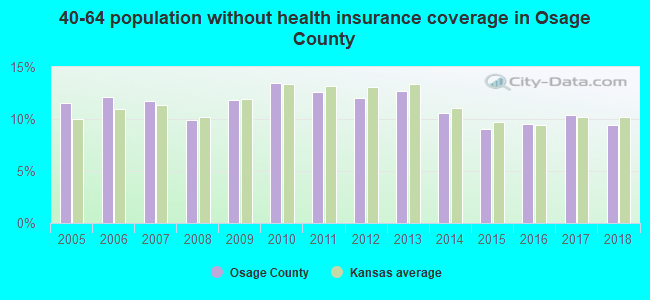
| Osage County: | 11.6% |
| Kansas: | 12.0% |
Median age of residents in 2022: 43.2 years old
(Males: 42.4 years old, Females: 44.2 years old)
(Median age for: White residents: 44.5 years old, Black residents: 42.3 years old, American Indian residents: 61.4 years old, Asian residents: 36.3 years old, Hispanic or Latino residents: 22.4 years old, Other race residents: 31.3 years old)
Area name: Topeka, KS MSA
Fair market rent in 2006 for a 1-bedroom apartment in Osage County is $464 a month.
Fair market rent for a 2-bedroom apartment is $568 a month.
Fair market rent for a 3-bedroom apartment is $720 a month.
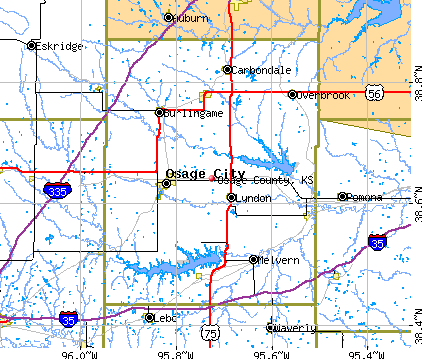
Cities in this county include: Osage City, Carbondale, Lyndon, Burlingame, Overbrook, Scranton, Vassar, Quenemo, Melvern, Olivet.
Neighboring counties: Gallatin County, Kentucky  , Pike County, Indiana , Switzerland County, Indiana , Warren County, Ohio .
| Here: | 2.0% |
| Kansas: | 2.0% |
Current college students: 581
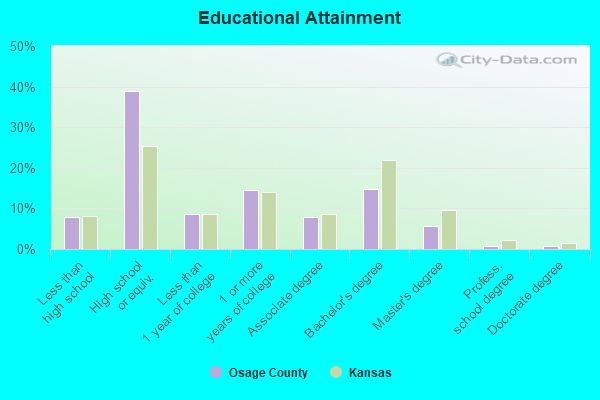
People 25 years of age or older with a high school degree or higher: 92.1%
People 25 years of age or older with a bachelor's degree or higher: 20.0%
Number of foreign born residents: 182 (57.7% naturalized citizens)
| Osage County: | 1.2% |
| Whole state: | 7.1% |
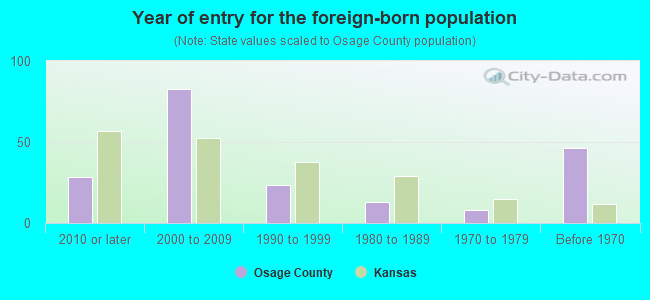
- Year of entry for the foreign-born population
- 452010 or later
- 572000 to 2009
- 241990 to 1999
- 131980 to 1989
- 81970 to 1979
- 46Before 1970
Mean travel time to work (commute): minutes
Percentage of county residents living and working in this county: 98.5%
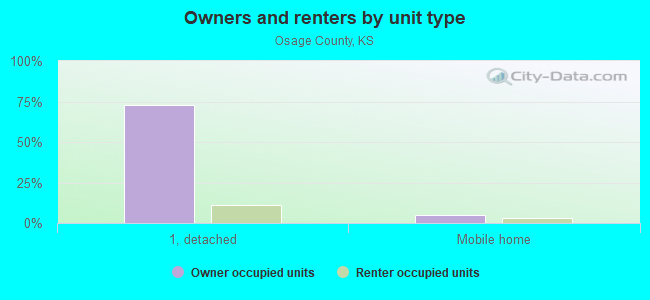
Housing units in structures:
- One, detached: 6,010
- One, attached: 82
- Two: 151
- 3 or 4: 134
- 5 to 9: 81
- 10 to 19: 38
- 20 to 49: 61
- 50 or more: 8
- Mobile homes: 715
- Boats, RVs, vans, etc.: 3
Housing units in Osage County with a mortgage: 2,762 (227 second mortgage, 2 home equity loan, 164 both second mortgage and home equity loan)
Houses without a mortgage: 24
| Here: | 7.7% with mortgage |
| State: | 97.8% with mortgage |
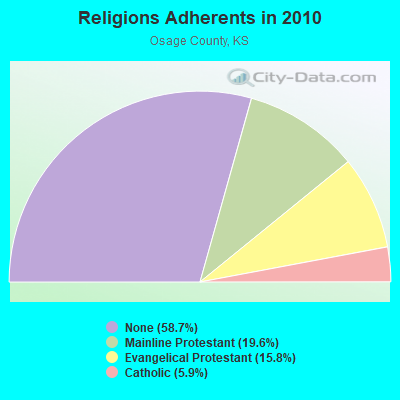
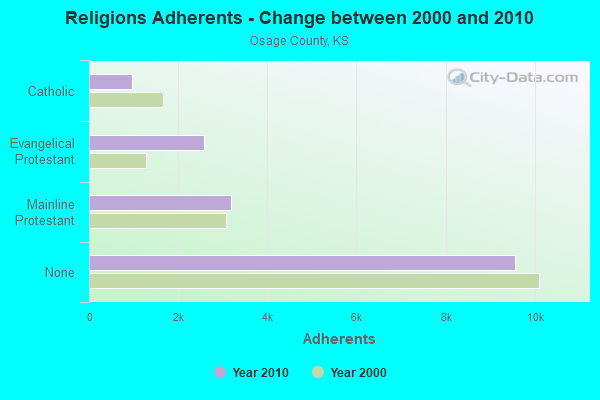
Religion statistics for Osage County
| Religion | Adherents | Congregations |
|---|---|---|
| Mainline Protestant | 3,187 | 12 |
| Evangelical Protestant | 2,573 | 19 |
| Catholic | 958 | 2 |
| Other | 7 | 1 |
| None | 9,570 | - |
Source: Clifford Grammich, Kirk Hadaway, Richard Houseal, Dale E.Jones, Alexei Krindatch, Richie Stanley and Richard H.Taylor. 2012. 2010 U.S.Religion Census: Religious Congregations & Membership Study. Association of Statisticians of American Religious Bodies. Jones, Dale E., et al. 2002. Congregations and Membership in the United States 2000. Nashville, TN: Glenmary Research Center.
Food Environment Statistics:
| Osage County: | 2.44 / 10,000 pop. |
| State: | 1.96 / 10,000 pop. |
| Osage County: | 6.09 / 10,000 pop. |
| Kansas: | 3.84 / 10,000 pop. |
| This county: | 8.53 / 10,000 pop. |
| State: | 7.33 / 10,000 pop. |
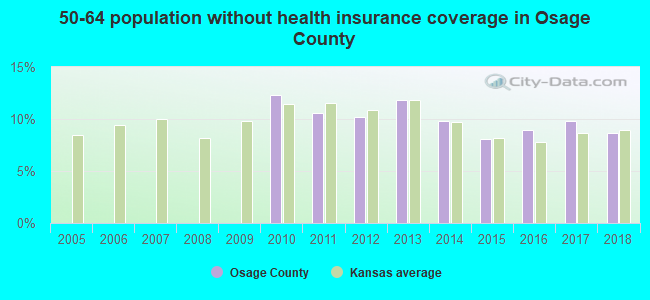
| Osage County: | 8.6% |
| Kansas: | 8.1% |
| Osage County: | 29.8% |
| State: | 27.9% |
| Here: | 14.7% |
| State: | 13.4% |
Agriculture in Osage County:
Average size of farms: 397 acresAverage value of agricultural products sold per farm: $35,489
Average value of crops sold per acre for harvested cropland: $96.09
The value of nursery, greenhouse, floriculture, and sod as a percentage of the total market value of agricultural products sold: 0.66%
The value of livestock, poultry, and their products as a percentage of the total market value of agricultural products sold: 52.38%
Average total farm production expenses per farm: $32,413
Harvested cropland as a percentage of land in farms: 44.29%
Irrigated harvested cropland as a percentage of land in farms: 0.23%
Average market value of all machinery and equipment per farm: $56,333
The percentage of farms operated by a family or individual: 91.46%
Average age of principal farm operators: 56 years
Average number of cattle and calves per 100 acres of all land in farms: 9.33
Milk cows as a percentage of all cattle and calves: 0.50%
Corn for grain: 21471 harvested acres
All wheat for grain: 17280 harvested acres
Soybeans for beans: 63458 harvested acres
Vegetables: 10 harvested acres
Land in orchards: 5 acres
Earthquake activity:
Osage County-area historical earthquake activity is significantly above Kansas state average. It is 611% greater than the overall U.S. average.On 9/3/2016 at 12:02:44, a magnitude 5.8 (5.8 MW, Depth: 3.5 mi, Class: Moderate, Intensity: VI - VII) earthquake occurred 166.8 miles away from Osage County center
On 11/6/2011 at 03:53:10, a magnitude 5.7 (5.7 MW, Depth: 3.2 mi) earthquake occurred 222.4 miles away from the county center
On 11/12/2014 at 21:40:00, a magnitude 4.9 (4.9 MW, Depth: 2.5 mi, Class: Light, Intensity: IV - V) earthquake occurred 140.1 miles away from the county center
On 11/7/2016 at 01:44:24, a magnitude 5.0 (5.0 MW, Depth: 2.8 mi) earthquake occurred 192.5 miles away from the county center
On 2/13/2016 at 17:07:06, a magnitude 5.1 (5.1 MW, Depth: 5.2 mi) earthquake occurred 221.0 miles away from Osage County center
On 1/19/2020 at 19:08:42, a magnitude 4.5 (4.5 MW, Depth: 3.1 mi) earthquake occurred 129.1 miles away from the county center
Magnitude types: moment magnitude (MW)
Most recent natural disasters:
- Kansas Covid-19 Pandemic, Incident Period: January 20, 2020, FEMA Id: 4504, Natural disaster type: Other
- Kansas Severe Storms, Straight-line Winds, Tornadoes, Flooding,landslides,and Mudslides, Incident Period: April 28, 2019, FEMA Id: 4449, Natural disaster type: Storm, Tornado, Mudslide, Landslide, Flood, Wind
- Kansas Severe Storms, Tornadoes, Straight-line Winds, and Flooding, Incident Period: May 04, 2015 to June 21, 2015, Major Disaster (Presidential) Declared DR-4230: July 20, 2015, FEMA Id: 4230, Natural disaster type: Storm, Tornado, Flood, Wind
- Kansas Snowstorm, Incident Period: February 20, 2013 to February 23, 2013, Major Disaster (Presidential) Declared DR-4112: April 26, 2013, FEMA Id: 4112, Natural disaster type: Snowstorm
- Kansas Severe Storms, Straight-line Winds, Tornadoes, and Flooding, Incident Period: May 19, 2011 to June 04, 2011, Major Disaster (Presidential) Declared DR-4010: July 29, 2011, FEMA Id: 4010, Natural disaster type: Storm, Tornado, Flood, Wind
- Kansas Severe Storms, Flooding, and Tornadoes, Incident Period: June 07, 2010 to July 21, 2010, Major Disaster (Presidential) Declared DR-1932: August 10, 2010, FEMA Id: 1932, Natural disaster type: Storm, Tornado, Flood
- Kansas Severe Winter Storms and Snowstorm, Incident Period: December 22, 2009 to January 08, 2010, Major Disaster (Presidential) Declared DR-1885: March 09, 2010, FEMA Id: 1885, Natural disaster type: Snowstorm, Winter Storm
- Kansas Severe Winter Storms, Incident Period: December 06, 2007 to December 19, 2007, Major Disaster (Presidential) Declared DR-1741: February 01, 2008, FEMA Id: 1741, Natural disaster type: Winter Storm
- Kansas Severe Winter Storms, Incident Period: December 06, 2007 to December 19, 2007, Emergency Declared EM-3282: December 12, 2007, FEMA Id: 3282, Natural disaster type: Winter Storm
- Kansas Severe Storms and Flooding, Incident Period: June 26, 2007 to July 25, 2007, Major Disaster (Presidential) Declared DR-1711: July 02, 2007, FEMA Id: 1711, Natural disaster type: Storm, Flood
- 9 other natural disasters have been reported since 1953.
The number of natural disasters in Osage County (19) is greater than the US average (15).
Major Disasters (Presidential) Declared: 15
Emergencies Declared: 2
Causes of natural disasters: Floods: 12, Storms: 11, Tornadoes: 8, Winter Storms: 4, Winds: 3, Snowstorms: 2, Heavy Rain: 1, Hurricane: 1, Ice Storm: 1, Landslide: 1, Mudslide: 1, Other: 1 (Note: some incidents may be assigned to more than one category).
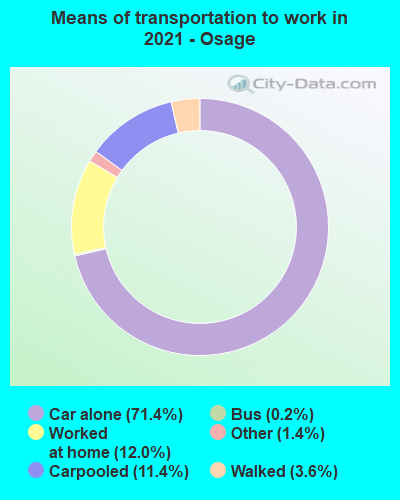
Means of transportation to work:
- Drove a car alone: 2,220 (66.5%)
- Carpooled: 317 (9.5%)
- Bus: 12 (0.4%)
- Taxicab, motorcycle, or other means: 52 (1.6%)
- Walked: 129 (3.9%)
- Worked at home: 669 (20.1%)

- Health care and social assistance (20%)
- Educational services (13%)
- Public administration (7%)
- Retail trade (6%)
- Professional, scientific, and technical services (6%)
- Finance and insurance (5%)
- Manufacturing (5%)
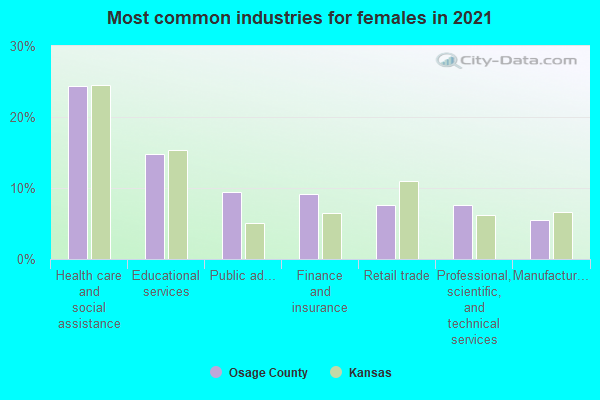
- Health care and social assistance (25%)
- Educational services (16%)
- Public administration (8%)
- Retail trade (8%)
- Professional, scientific, and technical services (7%)
- Finance and insurance (6%)
- Manufacturing (6%)
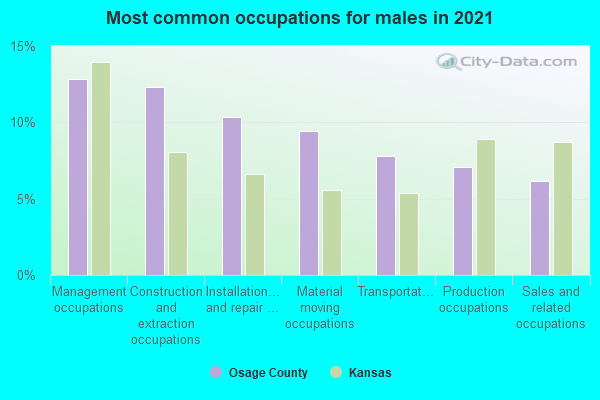
- Management occupations (12%)
- Installation, maintenance, and repair occupations (12%)
- Construction and extraction occupations (12%)
- Material moving occupations (11%)
- Transportation occupations (8%)
- Production occupations (8%)
- Sales and related occupations (6%)
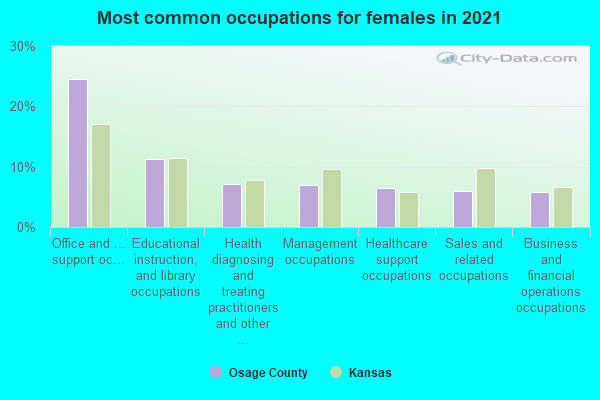
- Office and administrative support occupations (22%)
- Educational instruction, and library occupations (11%)
- Management occupations (7%)
- Healthcare support occupations (7%)
- Food preparation and serving related occupations (7%)
- Production occupations (6%)
- Sales and related occupations (6%)
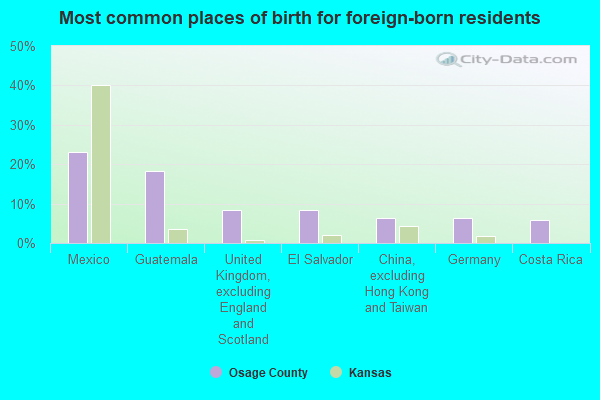
- Mexico (30%)
- Australia (10%)
- El Salvador (10%)
- United Kingdom, excluding England and Scotland (9%)
- China, excluding Hong Kong and Taiwan (5%)
- Costa Rica (5%)
- Norway (5%)
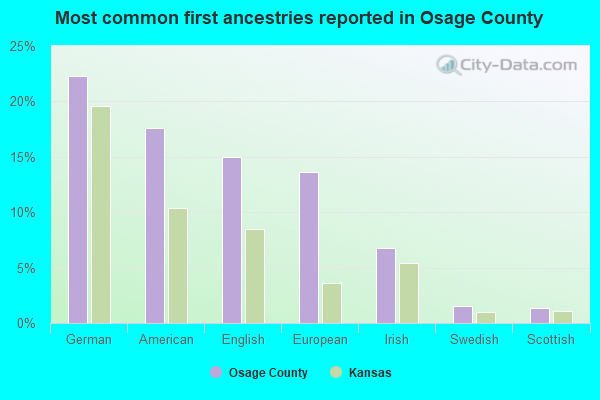
- European (20%)
- German (20%)
- English (15%)
- American (15%)
- Irish (6%)
- Italian (3%)
- Norwegian (2%)
People in group quarters in Osage County, Kansas in 2010:
- 156 people in nursing facilities/skilled-nursing facilities
- 21 people in group homes intended for adults
- 17 people in local jails and other municipal confinement facilities
People in group quarters in Osage County, Kansas in 2000:
- 211 people in nursing homes
- 12 people in other noninstitutional group quarters
- 8 people in local jails and other confinement facilities (including police lockups)
- 2 people in homes for the mentally retarded
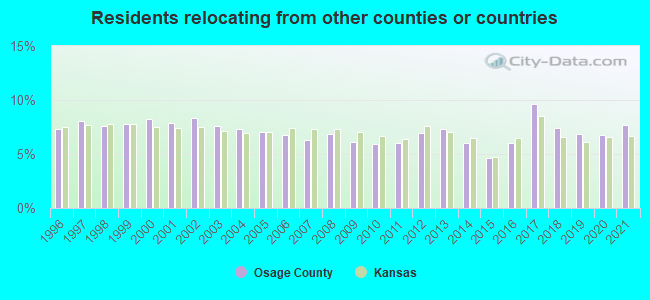
7.70% of this county's 2021 resident taxpayers lived in other counties in 2020 ($49,237 average adjusted gross income)
| Here: | 7.70% |
| Kansas average: | 6.64% |
10 or fewer of this county's residents moved from foreign countries.
6.04% relocated from other counties in Kansas ($38,891 average AGI)
1.66% relocated from other states ($10,346 average AGI)
Osage County: 1.66% Kansas average: 3.37%
Top counties from which taxpayers relocated into this county between 2020 and 2021:
| from Shawnee County, KS | |
| from Franklin County, KS | |
| from Douglas County, KS | |
| from Johnson County, KS | |
| from Lyon County, KS | |
| from Coffey County, KS |
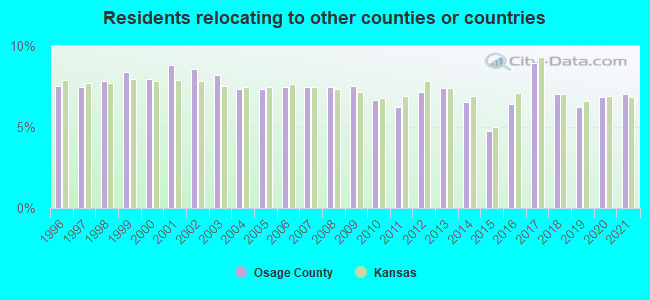
7.01% of this county's 2020 resident taxpayers moved to other counties in 2021 ($41,993 average adjusted gross income)
| Here: | 7.01% |
| Kansas average: | 6.88% |
10 or fewer of this county's residents moved to foreign countries.
5.41% relocated to other counties in Kansas ($32,667 average AGI)
1.60% relocated to other states ($9,326 average AGI)
Osage County: 1.60% Kansas average: 3.62%
Top counties to which taxpayers relocated from this county between 2020 and 2021:
| to Shawnee County, KS | |
| to Douglas County, KS | |
| to Franklin County, KS |
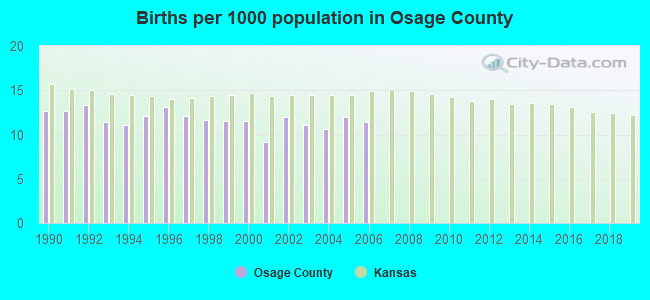
Births per 1000 population from 1990 to 1999: 12.2
Births per 1000 population from 2000 to 2006: 11.1
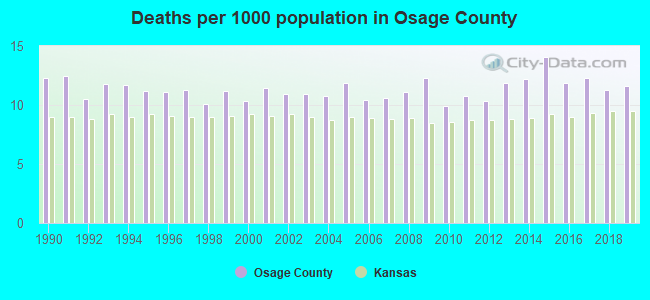
Deaths per 1000 population from 1990 to 1999: 11.4
Deaths per 1000 population from 2000 to 2009: 11.1
Deaths per 1000 population from 2010 to 2020: 12.2
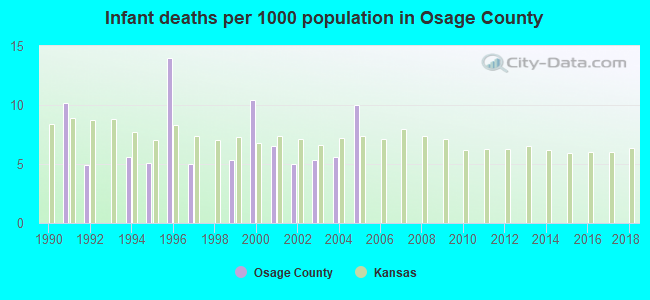
Infant deaths per 1000 live births from 1990 to 1999: 5.0
Infant deaths per 1000 live births from 2000 to 2006: 6.1
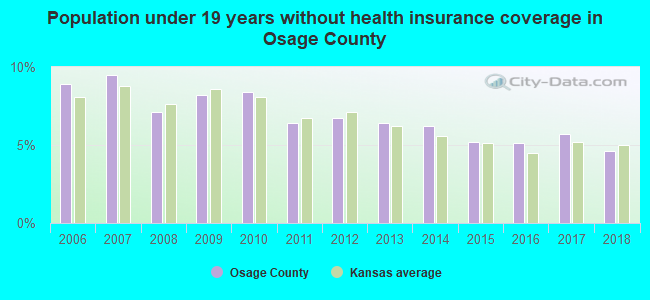
Persons under 19 years old without health insurance coverage in 2018: 4.6%
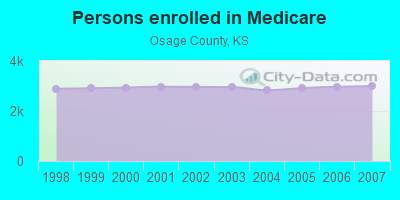
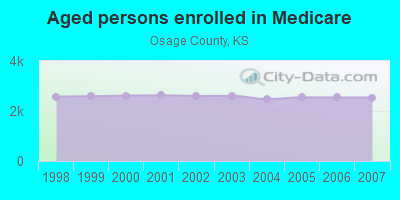
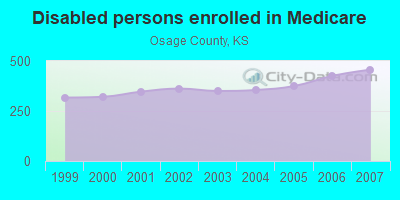
Persons enrolled in hospital insurance and/or supplemental medical insurance (Medicare) in July 1, 2007: 2,996 (2,539 aged, 457 disabled)
Children under 18 without health insurance coverage in 2007: 348 (9%)
Most common underlying causes of death in Osage County, Kansas in 1999 - 2019:
- Atherosclerotic heart disease (265)
- Bronchus or lung, unspecified - Malignant neoplasms (229)
- Chronic obstructive pulmonary disease, unspecified (164)
- Acute myocardial infarction, unspecified (112)
- Stroke, not specified as haemorrhage or infarction (106)
- Cerebrovascular disease, unspecified (97)
- Unspecified dementia (66)
- Congestive heart failure (44)
- Other ill-defined and unspecified causes of mortality (39)
- Alzheimer disease, unspecified (23)
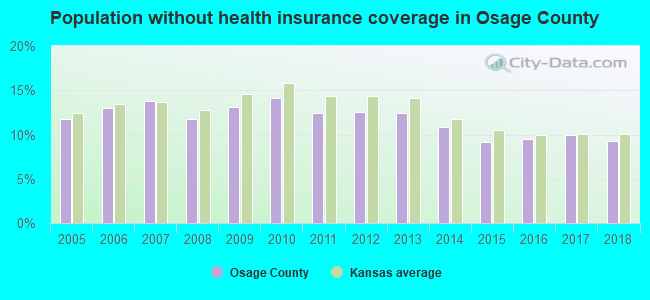
Population without health insurance coverage in 2000: 10%
Children under 18 without health insurance coverage in 2000: 8%
Medical specialist MDs per 100,000 population in 2005: 1,125
Dentists per 100,000 population in 1998: 17
Total births per 100,000 population, July 2005 - July 2006 : 23
Total deaths per 100,000 population, July 2005 - July 2006: 23
Limited-service eating places per 100,000 population in 2005 : 12
Household type by relationship:
Households: 15,793- Male householders: 3,312 (1,078 living alone), Female householders: 3,109 (889 living alone)
3,195 spouses (3,150 opposite-sex spouses), 632 unmarried partners, (604 opposite-sex unmarried partners), 4,343 children (3,760 natural, 144 adopted, 432 stepchildren), 194 grandchildren, 131 brothers or sisters, 136 parents, 61 foster children, 227 other relatives, 253 non-relatives
- In group quarters: 197
Size of family households: 2,238 2-persons, 710 3-persons, 575 4-persons, 382 5-persons, 156 6-persons, 66 7-or-more-persons.
Size of nonfamily households: 1,961 1-person, 314 2-persons, 12 3-persons.
2,245 married couples with children.
1,045 single-parent households (515 men, 530 women).
98.4% of residents of Osage speak English at home.
1.2% of residents speak Spanish at home (70% speak English very well, 30% speak English well).
0.6% of residents speak other Indo-European language at home (95% speak English very well, 5% speak English well).
0.1% of residents speak Asian or Pacific Island language at home (100% speak English very well).
In fiscal year 2004:
Federal Government expenditure: $87,886,000 ($5,142 per capita)
Department of Defense expenditure: $5,260,000
Federal direct payments to individuals for retirement and disability: $48,203,000
Federal other direct payments to individuals: $18,166,000
Federal direct payments not to individuals: $5,385,000
Federal grants: $9,558,000
Federal procurement contracts: $1,598,000 ($836,000 Department of Defense)
Federal salaries and wages: $4,975,000 ($1,899,000 Department of Defense)
Federal Government direct loans: $657,000
Federal guaranteed/insured loans: $5,381,000
Federal Government insurance: $12,339,000
Population change from April 1, 2000 to July 1, 2005:
Births: 946| Here: | 55 per 1000 residents |
| State: | 75 per 1000 residents |
Deaths: 952
| Here: | 56 per 1000 residents |
| State: | 47 per 1000 residents |
Net international migration: +23
| Here: | +1 per 1000 residents |
| State: | +14 per 1000 residents |
Net internal migration: +441
| Here: | |
| State: |
Total withdrawal of fresh water for public supply: 1.63 millions of gallons per day (1% from ground, 99% from surface)
| Here: | 6.4 |
| State: | 6.9 |
| Here: | 4.4 |
| State: | 4.4 |
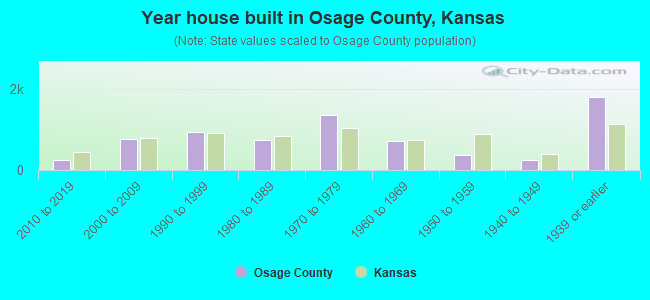
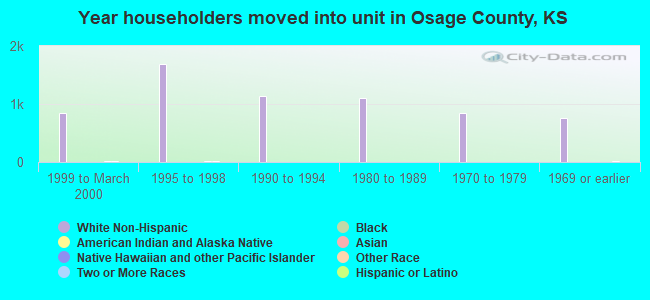
- Year house built in Osage County, Kansas
- 22020 or later
- 2422010 to 2019
- 7162000 to 2009
- 9151990 to 1999
- 7451980 to 1989
- 1,3811970 to 1979
- 7221960 to 1969
- 4161950 to 1959
- 2261940 to 1949
- 1,8511939 or earlier
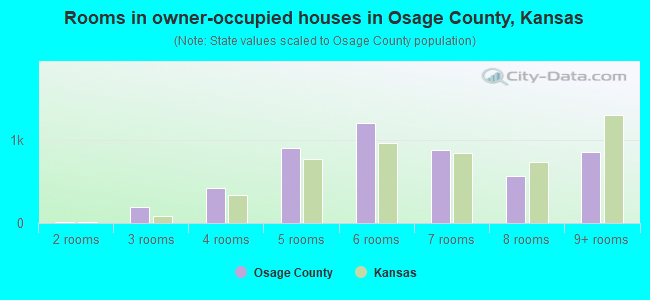
- Rooms in owner-occupied houses in Osage County, Kansas
- 81 room
- 312 rooms
- 2093 rooms
- 4224 rooms
- 8525 rooms
- 1,1906 rooms
- 9767 rooms
- 5898 rooms
- 8389+ rooms
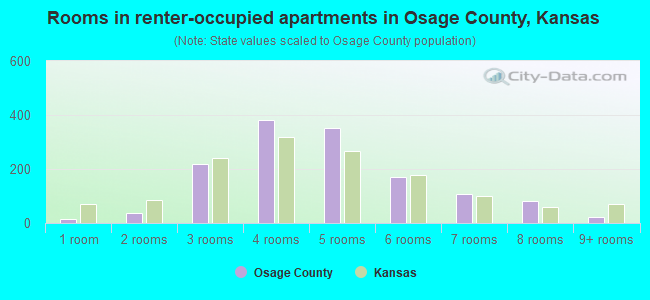
- Rooms in renter-occupied apartments in Osage County, Kansas
- 171 room
- 442 rooms
- 2273 rooms
- 4194 rooms
- 2565 rooms
- 1986 rooms
- 617 rooms
- 1018 rooms
- 209+ rooms
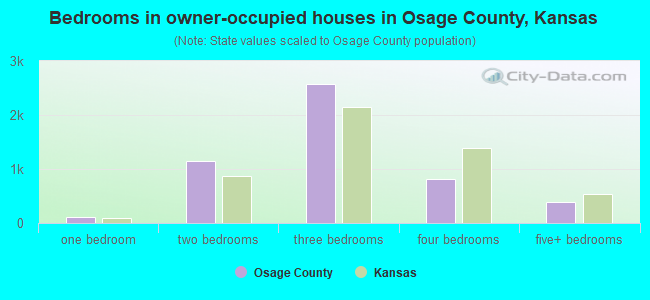
- Bedrooms in owner-occupied houses in Osage County, Kansas
- 19no bedroom
- 1161 bedroom
- 1,0042 bedrooms
- 2,6273 bedrooms
- 9314 bedrooms
- 4095+ bedrooms
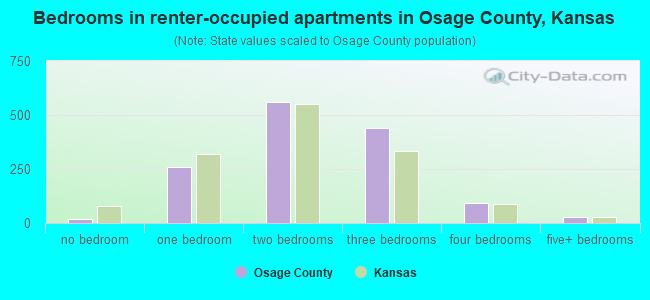
- Bedrooms in renter-occupied apartments in Osage County, Kansas
- 19no bedroom
- 2301 bedroom
- 6092 bedrooms
- 3483 bedrooms
- 934 bedrooms
- 395+ bedrooms
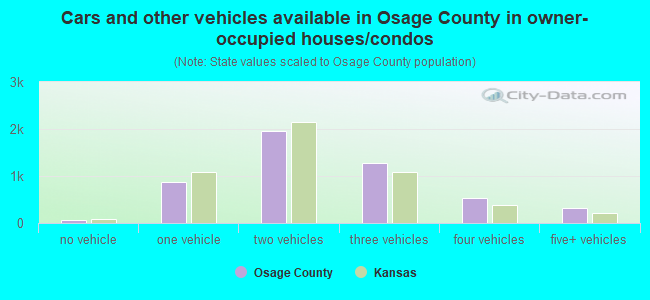
- Cars and other vehicles available in Osage County in owner-occupied houses/condos
- 72no vehicle
- 9961 vehicle
- 1,8802 vehicles
- 1,1933 vehicles
- 5954 vehicles
- 3645+ vehicles
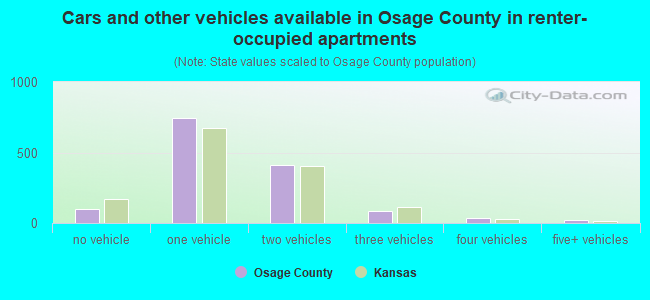
- Cars and other vehicles available in Osage County in renter-occupied apartments
- 86no vehicle
- 6941 vehicle
- 4032 vehicles
- 1043 vehicles
- 424 vehicles
- 85+ vehicles
87.9% of Osage County residents lived in the same house 1 years ago.
Out of people who lived in different houses, 30% lived in this county.
Out of people who lived in different counties, 75% lived in Kansas.
| Osage County: | 87.9% |
| State average: | 85.3% |
Place of birth for U.S.-born residents:
- This state: 12,027
- Other state: 3,536
- Northeast: 176
- Midwest: 1,723
- South: 804
- West: 834
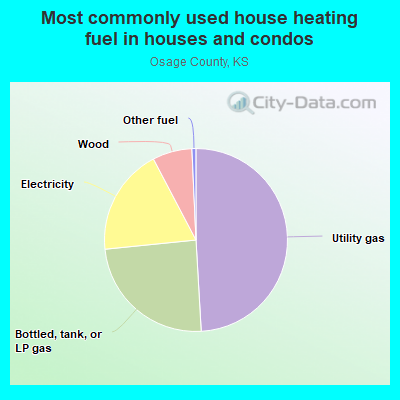
- 49.6%Utility gas
- 25.2%Bottled, tank, or LP gas
- 17.6%Electricity
- 6.7%Wood
- 0.6%Other fuel
- 0.2%Fuel oil, kerosene, etc.
- 0.1%No fuel used
- 54.8%Utility gas
- 32.4%Electricity
- 8.8%Bottled, tank, or LP gas
- 2.7%Wood
- 0.7%Other fuel
- 0.6%No fuel used
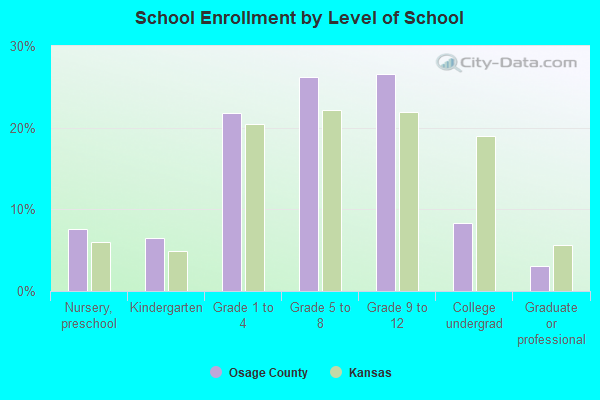
Private vs. public school enrollment:
| Here: | 4.4% |
| Kansas: | 14.1% |
| Here: | 6.2% |
| Kansas: | 10.8% |
| Here: | 5.4% |
| Kansas: | 15.4% |
Osage County government finances - Expenditure in 2017:
- Charges - Solid Waste Management: $456,000
Other: $259,000
Natural Resources - Other: $150,000
- Construction - Natural Resources - Other: $57,000
- Current Operations - General - Other: $3,018,000
Regular Highways: $2,910,000
Police Protection: $2,040,000
General Public Buildings: $743,000
Health - Other: $621,000
Correctional Institutions: $617,000
Financial Administration: $568,000
Solid Waste Management: $539,000
Judicial and Legal Services: $448,000
Central Staff Services: $414,000
Natural Resources - Other: $392,000
- Federal Intergovernmental - Natural Resources: $83,000
General Local Government Support: $81,000
- General - Interest on Debt: $41,000
- Intergovernmental to Local - Other - General - Other: $445,000
- Long Term Debt - Beginning Outstanding - Unspecified Public Purpose: $997,000
Outstanding Unspecified Public Purpose: $810,000
Retired Unspecified Public Purpose: $187,000
- Miscellaneous - General Revenue - Other: $526,000
Interest Earnings: $12,000
- Other Capital Outlay - General - Other: $335,000
Regular Highways: $243,000
Natural Resources - Other: $25,000
Central Staff Services: $17,000
- Other Funds - Cash and Securities: $2,601,000
- Sinking Funds - Cash and Securities: $14,000
- State Intergovernmental - Highways: $634,000
Other: $65,000
General Local Government Support: $18,000
- Tax - Property: $8,284,000
General Sales and Gross Receipts: $1,303,000
Public Utilities Sales: $147,000
Documentary and Stock Transfer: $117,000
- Total Salaries and Wages: $3,594,000
Osage County government finances - Revenue in 2017:
- Charges - Solid Waste Management: $456,000
Other: $259,000
Natural Resources - Other: $150,000
- Construction - Natural Resources - Other: $57,000
- Current Operations - General - Other: $3,018,000
Regular Highways: $2,910,000
Police Protection: $2,040,000
General Public Buildings: $743,000
Health - Other: $621,000
Correctional Institutions: $617,000
Financial Administration: $568,000
Solid Waste Management: $539,000
Judicial and Legal Services: $448,000
Central Staff Services: $414,000
Natural Resources - Other: $392,000
- Federal Intergovernmental - Natural Resources: $83,000
General Local Government Support: $81,000
- General - Interest on Debt: $41,000
- Intergovernmental to Local - Other - General - Other: $445,000
- Long Term Debt - Beginning Outstanding - Unspecified Public Purpose: $997,000
Outstanding Unspecified Public Purpose: $810,000
Retired Unspecified Public Purpose: $187,000
- Miscellaneous - General Revenue - Other: $526,000
Interest Earnings: $12,000
- Other Capital Outlay - General - Other: $335,000
Regular Highways: $243,000
Natural Resources - Other: $25,000
Central Staff Services: $17,000
- Other Funds - Cash and Securities: $2,601,000
- Sinking Funds - Cash and Securities: $14,000
- State Intergovernmental - Highways: $634,000
Other: $65,000
General Local Government Support: $18,000
- Tax - Property: $8,284,000
General Sales and Gross Receipts: $1,303,000
Public Utilities Sales: $147,000
Documentary and Stock Transfer: $117,000
- Total Salaries and Wages: $3,594,000
Osage County government finances - Debt in 2017:
- Charges - Solid Waste Management: $456,000
Other: $259,000
Natural Resources - Other: $150,000
- Construction - Natural Resources - Other: $57,000
- Current Operations - General - Other: $3,018,000
Regular Highways: $2,910,000
Police Protection: $2,040,000
General Public Buildings: $743,000
Health - Other: $621,000
Correctional Institutions: $617,000
Financial Administration: $568,000
Solid Waste Management: $539,000
Judicial and Legal Services: $448,000
Central Staff Services: $414,000
Natural Resources - Other: $392,000
- Federal Intergovernmental - Natural Resources: $83,000
General Local Government Support: $81,000
- General - Interest on Debt: $41,000
- Intergovernmental to Local - Other - General - Other: $445,000
- Long Term Debt - Beginning Outstanding - Unspecified Public Purpose: $997,000
Outstanding Unspecified Public Purpose: $810,000
Retired Unspecified Public Purpose: $187,000
- Miscellaneous - General Revenue - Other: $526,000
Interest Earnings: $12,000
- Other Capital Outlay - General - Other: $335,000
Regular Highways: $243,000
Natural Resources - Other: $25,000
Central Staff Services: $17,000
- Other Funds - Cash and Securities: $2,601,000
- Sinking Funds - Cash and Securities: $14,000
- State Intergovernmental - Highways: $634,000
Other: $65,000
General Local Government Support: $18,000
- Tax - Property: $8,284,000
General Sales and Gross Receipts: $1,303,000
Public Utilities Sales: $147,000
Documentary and Stock Transfer: $117,000
- Total Salaries and Wages: $3,594,000
Osage County government finances - Cash and Securities in 2017:
- Charges - Solid Waste Management: $456,000
Other: $259,000
Natural Resources - Other: $150,000
- Construction - Natural Resources - Other: $57,000
- Current Operations - General - Other: $3,018,000
Regular Highways: $2,910,000
Police Protection: $2,040,000
General Public Buildings: $743,000
Health - Other: $621,000
Correctional Institutions: $617,000
Financial Administration: $568,000
Solid Waste Management: $539,000
Judicial and Legal Services: $448,000
Central Staff Services: $414,000
Natural Resources - Other: $392,000
- Federal Intergovernmental - Natural Resources: $83,000
General Local Government Support: $81,000
- General - Interest on Debt: $41,000
- Intergovernmental to Local - Other - General - Other: $445,000
- Long Term Debt - Beginning Outstanding - Unspecified Public Purpose: $997,000
Outstanding Unspecified Public Purpose: $810,000
Retired Unspecified Public Purpose: $187,000
- Miscellaneous - General Revenue - Other: $526,000
Interest Earnings: $12,000
- Other Capital Outlay - General - Other: $335,000
Regular Highways: $243,000
Natural Resources - Other: $25,000
Central Staff Services: $17,000
- Other Funds - Cash and Securities: $2,601,000
- Sinking Funds - Cash and Securities: $14,000
- State Intergovernmental - Highways: $634,000
Other: $65,000
General Local Government Support: $18,000
- Tax - Property: $8,284,000
General Sales and Gross Receipts: $1,303,000
Public Utilities Sales: $147,000
Documentary and Stock Transfer: $117,000
- Total Salaries and Wages: $3,594,000
Supplemental Security Income (SSI) in 2006:
- Total number of recipients: 276
- Number of aged recipients: 16
- Number of blind and disabled recipients: 260
- Number of recipients under 18: 56
- Number of recipients between 18 and 64: 187
- Number of recipients older than 64: 33
- Number of recipients also receiving OASDI: 105
- Amount of payments (thousands of dollars): 118
| Most common first names in Osage County, KS among deceased individuals | ||
| Name | Count | Lived (average) |
|---|---|---|
| John | 140 | 75.8 years |
| Mary | 122 | 80.8 years |
| William | 118 | 78.2 years |
| James | 92 | 74.0 years |
| Charles | 88 | 74.9 years |
| George | 76 | 80.0 years |
| Robert | 74 | 73.0 years |
| Helen | 53 | 82.4 years |
| Dorothy | 49 | 78.0 years |
| Albert | 49 | 79.2 years |
| Most common last names in Osage County, KS among deceased individuals | ||
| Last name | Count | Lived (average) |
|---|---|---|
| Johnson | 71 | 78.7 years |
| Smith | 61 | 74.5 years |
| Jones | 44 | 79.0 years |
| Miller | 40 | 77.0 years |
| Anderson | 40 | 79.2 years |
| Wilson | 28 | 80.4 years |
| Williams | 27 | 78.1 years |
| Peterson | 26 | 81.1 years |
| Brown | 25 | 72.4 years |
| Coffman | 25 | 78.9 years |
| Businesses in Osage County, KS | ||||
| Name | Count | Name | Count | |
|---|---|---|---|---|
| Chevrolet | 1 | SONIC Drive-In | 1 | |
| H&R Block | 1 | Subway | 1 | |
| Pizza Hut | 1 | U-Haul | 2 | |
| RadioShack | 1 | |||
Osage County on our top lists:
- #36 on the list of "Top 101 counties with the lowest ground withdrawal of fresh water for public supply"