Crime rate in Edison, New Jersey (NJ): murders, rapes, robberies, assaults, burglaries, thefts, auto thefts, arson, law enforcement employees, police officers, crime map
Crime rate in Edison, NJ
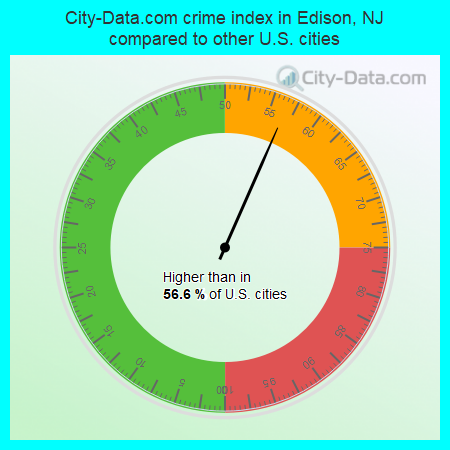
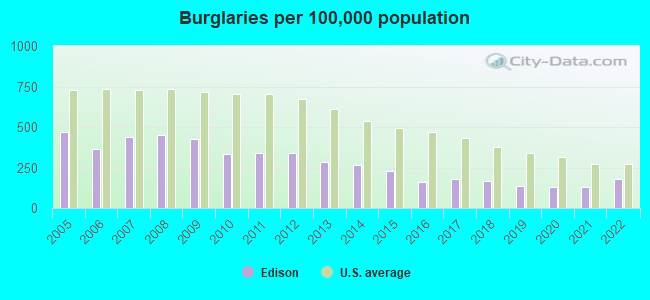
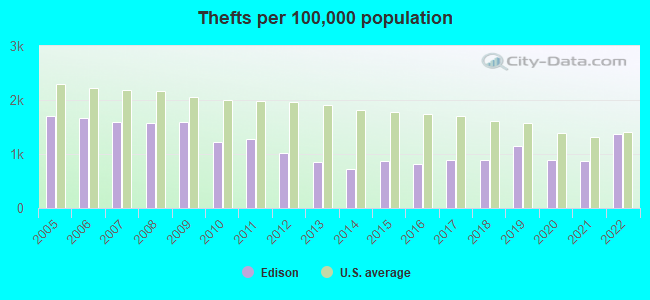
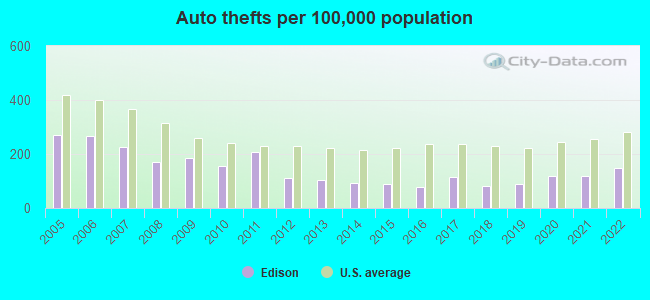
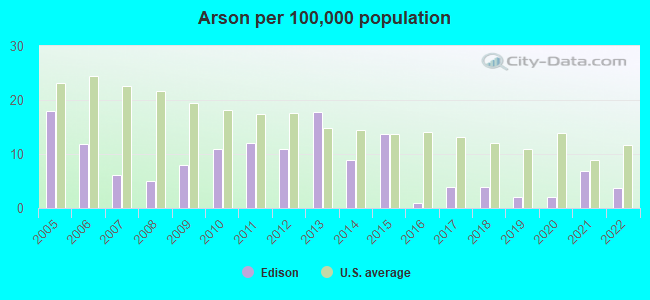
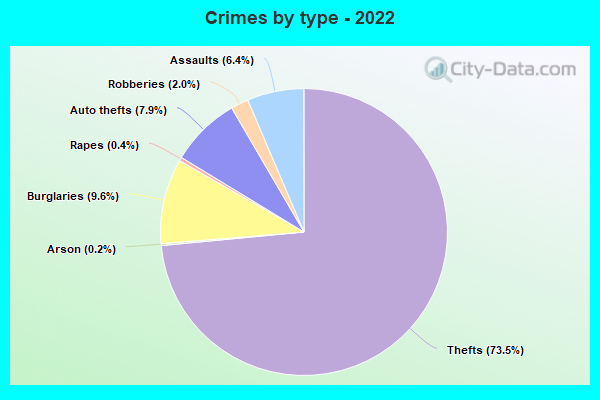
The 2022 crime rate in Edison, NJ is 120 (City-Data.com crime index), which is 2.1 times lower than the U.S. average. It was higher than in 56.6% U.S. cities. The 2022 Edison crime rate rose by 41% compared to 2021. In the last 5 years Edison has seen rise of violent crime and rise of property crime.See how dangerous Edison, NJ is compared to the nearest cities:
(Note: Higher means more crime)
(Note: Higher means more crime)
| Edison: | 119.9 |
| Metuchen: | 42.7 |
| South Plainfield: | 101.9 |
| Highland Park: | 78.6 |
| New Brunswick: | 375.4 |
| Woodbridge: | 131.6 |
| Perth Amboy: | 160.5 |
| Plainfield: | 188.2 |
| Sayreville: | 70.3 |
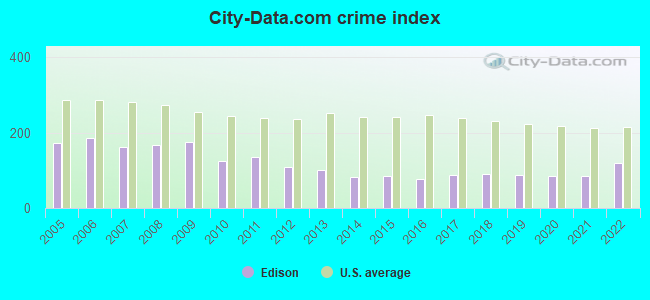
The City-Data.com crime index weighs serious crimes and violent crimes more heavily. Higher means more crime, U.S. average is 246.1. It adjusts for the number of visitors and daily workers commuting into cities.
- means the value is smaller than the state average.- means the value is about the same as the state average.
- means the value is bigger than the state average.
According to our research of New Jersey and other state lists, there were 12 registered sex offenders living in Edison, New Jersey as of April 26, 2024.
The ratio of all residents to sex offenders in Edison is 8,434 to 1.
The ratio of registered sex offenders to all residents in this city is much lower than the state average.
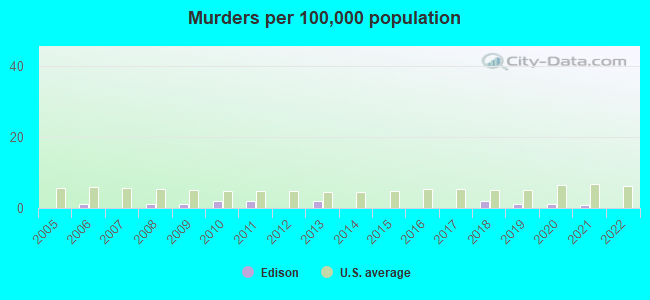
Violent crime rate in 2022
| Edison: | 85.6 |
| U.S. Average: | 219.8 |
Violent crime rate in 2021
| Edison: | 60.4 |
| U.S. Average: | 224.8 |
Violent crime rate in 2020
| Edison: | 57.7 |
| U.S. Average: | 228.2 |
Violent crime rate in 2019
| Edison: | 47.9 |
| U.S. Average: | 219.9 |
Violent crime rate in 2018
| Edison: | 66.1 |
| U.S. Average: | 221.2 |
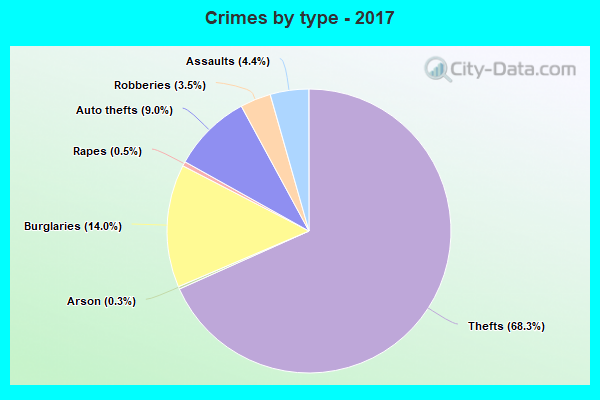
Violent crime rate in 2017
| Edison: | 57.9 |
| U.S. Average: | 226.2 |
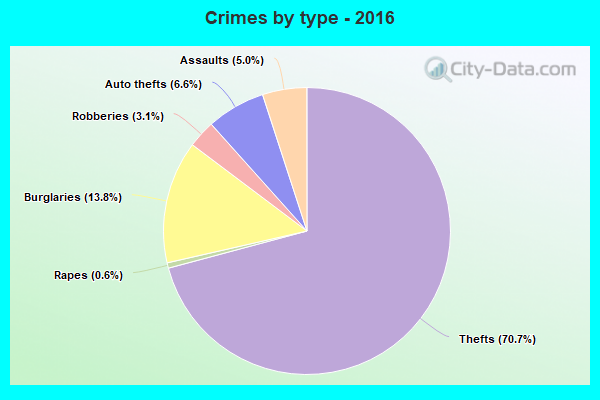
Violent crime rate in 2016
| Edison: | 54.1 |
| U.S. Average: | 227.3 |
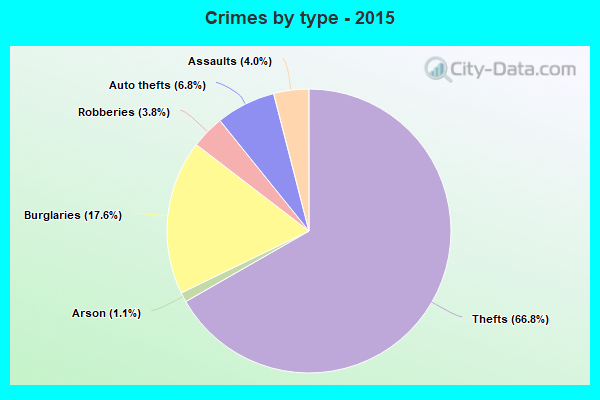
Violent crime rate in 2015
| Edison: | 51.3 |
| U.S. Average: | 219.3 |
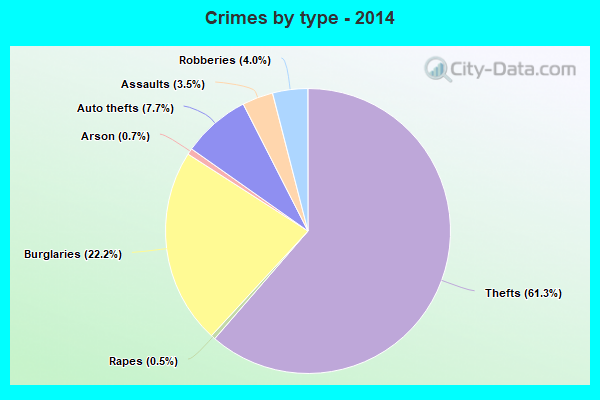
Violent crime rate in 2014
| Edison: | 51.0 |
| U.S. Average: | 211.1 |
Violent crime rate in 2013
| Edison: | 67.6 |
| U.S. Average: | 214.2 |
Violent crime rate in 2012
| Edison: | 64.8 |
| U.S. Average: | 187.4 |
Violent crime rate in 2011
| Edison: | 78.3 |
| U.S. Average: | 187.1 |
Violent crime rate in 2010
| Edison: | 76.0 |
| U.S. Average: | 195.7 |
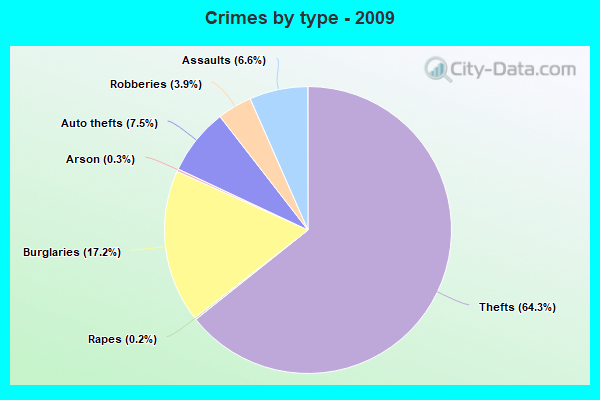
Violent crime rate in 2009
| Edison: | 136.4 |
| U.S. Average: | 208.9 |
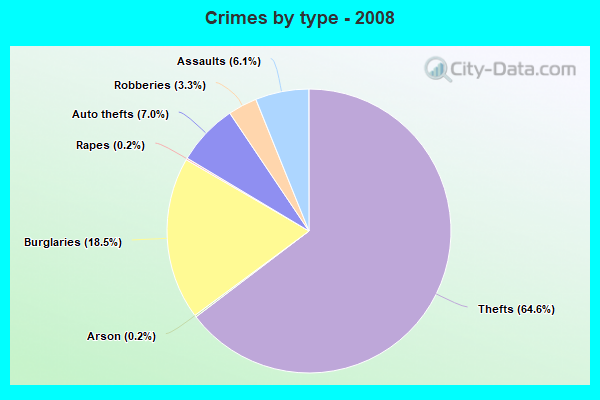
Violent crime rate in 2008
| Edison: | 122.0 |
| U.S. Average: | 222.5 |
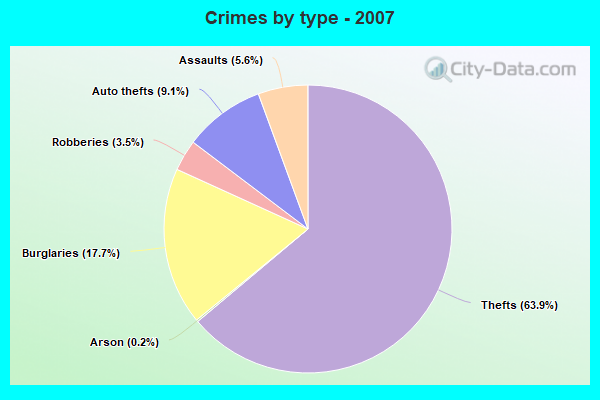
Violent crime rate in 2007
| Edison: | 109.4 |
| U.S. Average: | 229.1 |
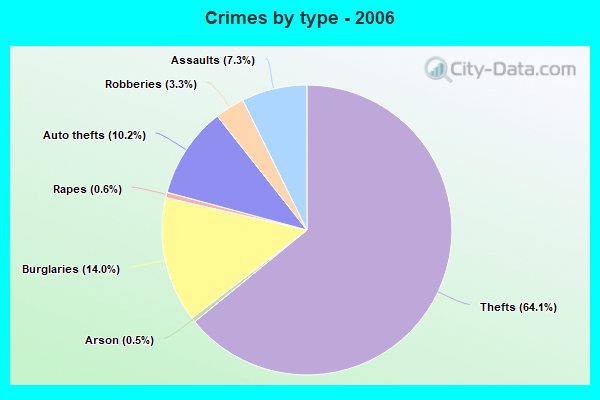
Violent crime rate in 2006
| Edison: | 149.9 |
| U.S. Average: | 232.6 |
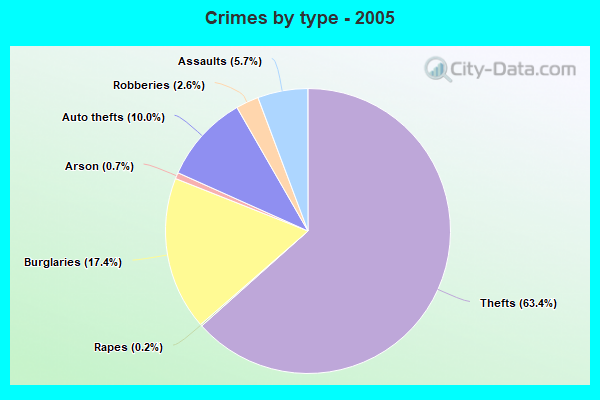
Violent crime rate in 2005
| Edison: | 113.8 |
| U.S. Average: | 227.0 |
Property crime rate in 2022
| Edison: | 125.9 |
| U.S. Average: | 166.5 |
Property crime rate in 2021
| Edison: | 87.5 |
| U.S. Average: | 157.8 |
Property crime rate in 2020
| Edison: | 88.4 |
| U.S. Average: | 169.6 |
Property crime rate in 2019
| Edison: | 98.0 |
| U.S. Average: | 179.7 |
Property crime rate in 2018
| Edison: | 89.3 |
| U.S. Average: | 190.2 |
Property crime rate in 2017
| Edison: | 97.5 |
| U.S. Average: | 206.4 |
Property crime rate in 2016
| Edison: | 84.8 |
| U.S. Average: | 216.6 |
Property crime rate in 2015
| Edison: | 102.6 |
| U.S. Average: | 221.5 |
Property crime rate in 2014
| Edison: | 102.9 |
| U.S. Average: | 230.8 |
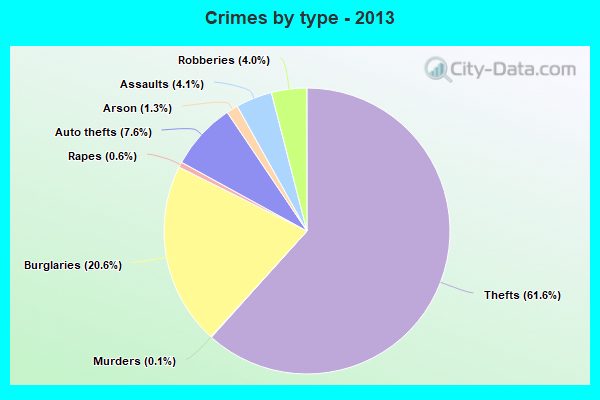
Property crime rate in 2013
| Edison: | 114.1 |
| U.S. Average: | 250.4 |
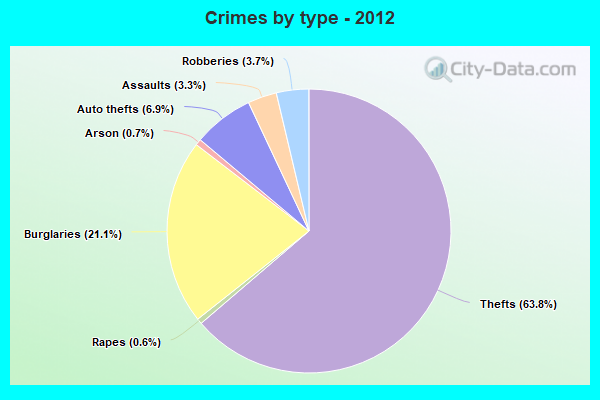
Property crime rate in 2012
| Edison: | 134.9 |
| U.S. Average: | 267.3 |
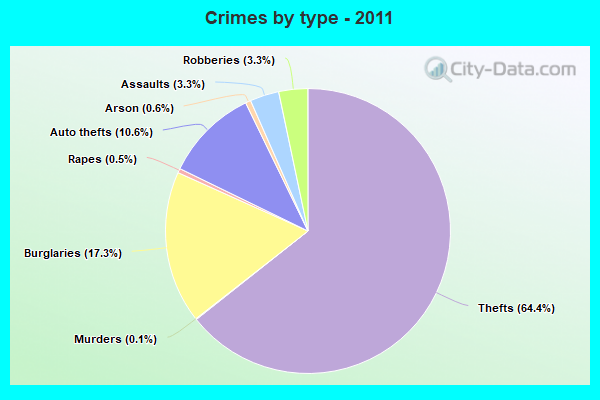
Property crime rate in 2011
| Edison: | 163.6 |
| U.S. Average: | 273.5 |
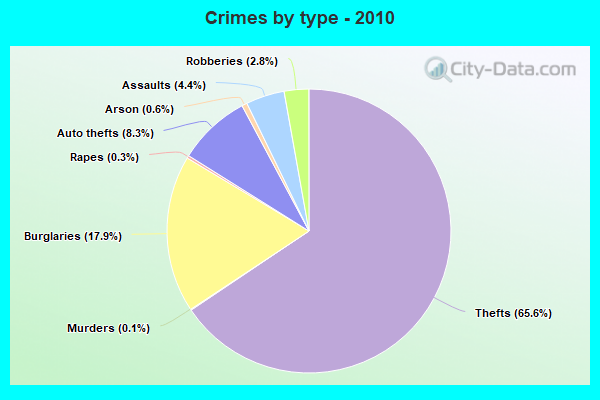
Property crime rate in 2010
| Edison: | 151.1 |
| U.S. Average: | 276.4 |
Property crime rate in 2009
| Edison: | 192.7 |
| U.S. Average: | 285.6 |
Property crime rate in 2008
| Edison: | 193.7 |
| U.S. Average: | 302.2 |
Property crime rate in 2007
| Edison: | 194.4 |
| U.S. Average: | 309.2 |
Property crime rate in 2006
| Edison: | 189.7 |
| U.S. Average: | 317.3 |
Property crime rate in 2005
| Edison: | 211.6 |
| U.S. Average: | 322.3 |


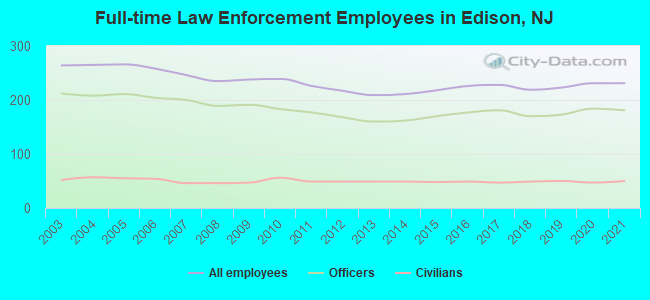
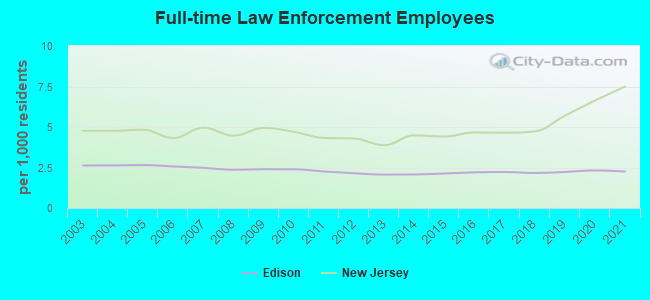
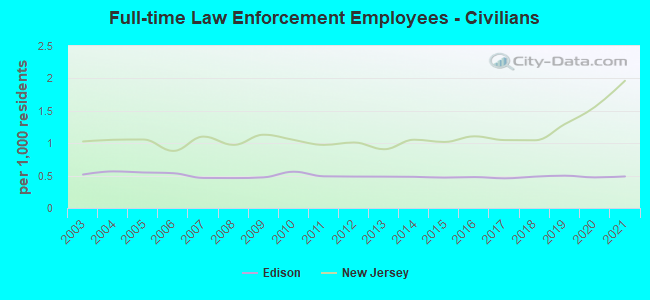
Full-time law enforcement employees in 2021, including police officers: 231 (181 officers - 165 male; 16 female).
| Officers per 1,000 residents here: | 1.76 |
| New Jersey average: | 5.53 |
Full-time law enforcement employees in 2020, including police officers: 231 (184 officers - 170 male; 14 female).
| Officers per 1,000 residents here: | 1.85 |
| New Jersey average: | 5.07 |
Full-time law enforcement employees in 2019, including police officers: 223 (173 officers - 164 male; 9 female).
| Officers per 1,000 residents here: | 1.73 |
| New Jersey average: | 4.40 |
Full-time law enforcement employees in 2018, including police officers: 219 (170 officers - 161 male; 9 female).
| Officers per 1,000 residents here: | 1.68 |
| New Jersey average: | 3.68 |
Full-time law enforcement employees in 2017, including police officers: 228 (181 officers - 170 male; 11 female).
| Officers per 1,000 residents here: | 1.76 |
| New Jersey average: | 3.60 |
Full-time law enforcement employees in 2016, including police officers: 226 (177 officers - 167 male; 10 female).
| Officers per 1,000 residents here: | 1.72 |
| New Jersey average: | 3.56 |
Full-time law enforcement employees in 2015, including police officers: 218 (170 officers - 161 male; 9 female).
| Officers per 1,000 residents here: | 1.66 |
| New Jersey average: | 3.39 |
Full-time law enforcement employees in 2014, including police officers: 211 (162 officers - 155 male; 7 female).
| Officers per 1,000 residents here: | 1.59 |
| New Jersey average: | 3.43 |
Full-time law enforcement employees in 2013, including police officers: 209 (160 officers - 154 male; 6 female).
| Officers per 1,000 residents here: | 1.58 |
| New Jersey average: | 2.97 |
Full-time law enforcement employees in 2012, including police officers: 217 (168 officers - 162 male; 6 female).
| Officers per 1,000 residents here: | 1.66 |
| New Jersey average: | 3.28 |
Full-time law enforcement employees in 2011, including police officers: 226 (177 officers - 171 male; 6 female).
| Officers per 1,000 residents here: | 1.76 |
| New Jersey average: | 3.35 |
Full-time law enforcement employees in 2010, including police officers: 239 (183 officers - 176 male; 7 female).
| Officers per 1,000 residents here: | 1.83 |
| New Jersey average: | 3.66 |
Full-time law enforcement employees in 2009, including police officers: 238 (191 officers - 184 male; 7 female).
| Officers per 1,000 residents here: | 1.92 |
| New Jersey average: | 3.81 |
Full-time law enforcement employees in 2008, including police officers: 235 (189 officers - 184 male; 5 female).
| Officers per 1,000 residents here: | 1.90 |
| New Jersey average: | 3.49 |
Full-time law enforcement employees in 2007, including police officers: 246 (200 officers - 195 male; 5 female).
| Officers per 1,000 residents here: | 2.02 |
| New Jersey average: | 3.86 |
Full-time law enforcement employees in 2006, including police officers: 258 (204 officers - 199 male; 5 female).
| Officers per 1,000 residents here: | 2.03 |
| New Jersey average: | 3.44 |
Full-time law enforcement employees in 2005, including police officers: 266 (211 officers - 207 male; 4 female).
| Officers per 1,000 residents here: | 2.10 |
| New Jersey average: | 3.77 |
Full-time law enforcement employees in 2004, including police officers: 265 (208 officers - 205 male; 3 female).
| Officers per 1,000 residents here: | 2.06 |
| New Jersey average: | 3.71 |
Full-time law enforcement employees in 2003, including police officers: 264 (212 officers - 210 male; 2 female).
| Officers per 1,000 residents here: | 2.11 |
| New Jersey average: | 3.74 |

Zip codes: 08817.