Crime rate in Fort Collins, Colorado (CO): murders, rapes, robberies, assaults, burglaries, thefts, auto thefts, arson, law enforcement employees, police officers, crime map
Crime rate in Fort Collins, CO
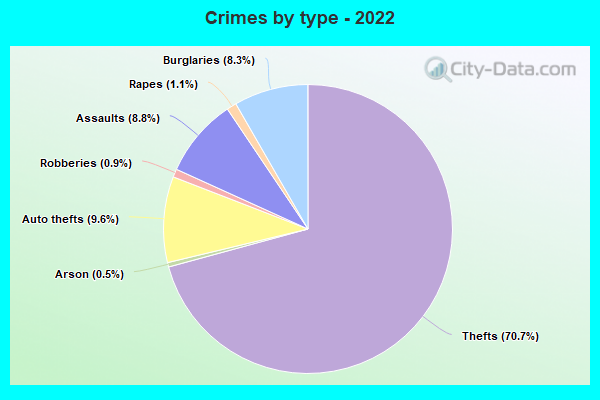
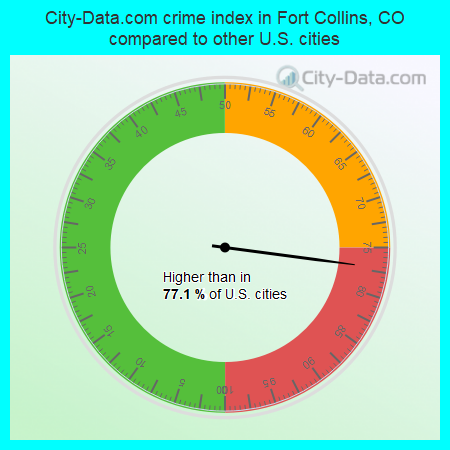
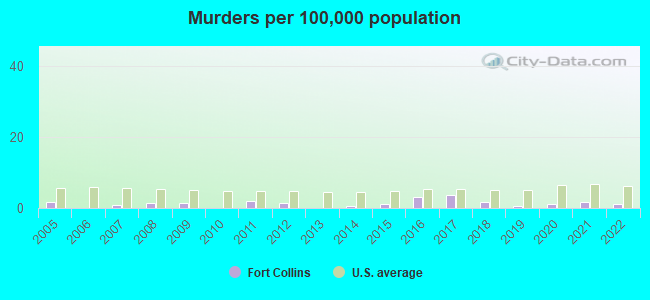
The 2022 crime rate in Fort Collins, CO is 212 (City-Data.com crime index), which is about the average for the U.S. cities. It was higher than in 77.1% U.S. cities. The 2022 Fort Collins crime rate rose by 5% compared to 2021. The number of homicides stood at 2 - a decrease of 1 compared to 2021. In the last 5 years Fort Collins has seen rise of violent crime and rise of property crime.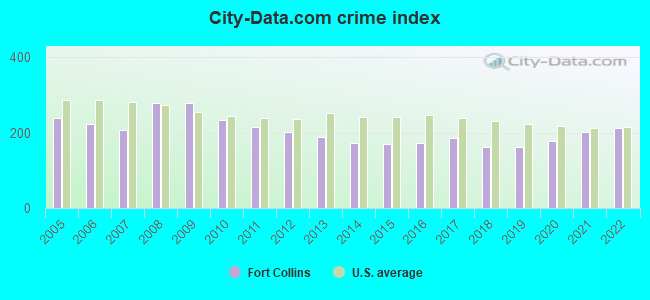
The City-Data.com crime index weighs serious crimes and violent crimes more heavily. Higher means more crime, U.S. average is 246.1. It adjusts for the number of visitors and daily workers commuting into cities.
- means the value is smaller than the state average.- means the value is about the same as the state average.
- means the value is bigger than the state average.
- means the value is much bigger than the state average.
According to our research of Colorado and other state lists, there were 335 registered sex offenders living in Fort Collins, Colorado as of May 10, 2024.
The ratio of all residents to sex offenders in Fort Collins is 490 to 1.
The ratio of registered sex offenders to all residents in this city is near the state average.
Violent crime rate in 2022
| Fort Collins: | 179.1 |
| U.S. Average: | 219.8 |
Violent crime rate in 2021
| Fort Collins: | 187.4 |
| U.S. Average: | 224.8 |
Violent crime rate in 2020
| Fort Collins: | 150.3 |
| U.S. Average: | 228.2 |
Violent crime rate in 2019
| Fort Collins: | 124.9 |
| U.S. Average: | 219.9 |
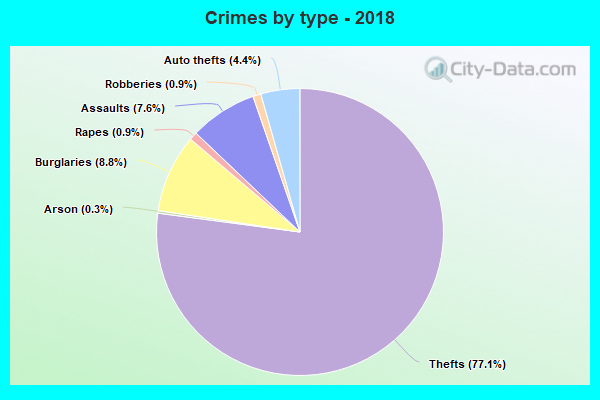
Violent crime rate in 2018
| Fort Collins: | 128.7 |
| U.S. Average: | 221.2 |
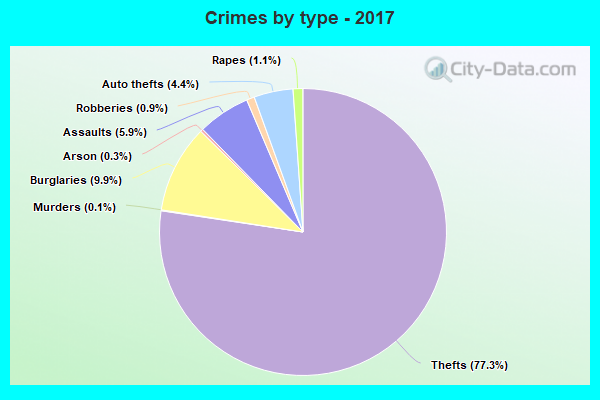
Violent crime rate in 2017
| Fort Collins: | 131.5 |
| U.S. Average: | 226.2 |
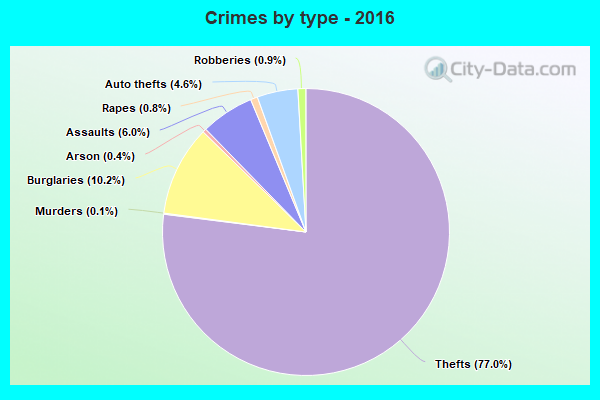
Violent crime rate in 2016
| Fort Collins: | 119.3 |
| U.S. Average: | 227.3 |
Violent crime rate in 2015
| Fort Collins: | 107.4 |
| U.S. Average: | 219.3 |
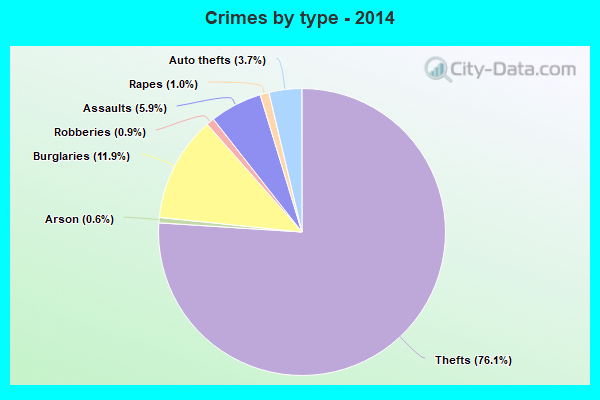
Violent crime rate in 2014
| Fort Collins: | 119.1 |
| U.S. Average: | 211.1 |
Violent crime rate in 2013
| Fort Collins: | 137.9 |
| U.S. Average: | 214.2 |
Violent crime rate in 2012
| Fort Collins: | 149.2 |
| U.S. Average: | 187.4 |
Violent crime rate in 2011
| Fort Collins: | 153.9 |
| U.S. Average: | 187.1 |
Violent crime rate in 2010
| Fort Collins: | 173.6 |
| U.S. Average: | 195.7 |
Violent crime rate in 2009
| Fort Collins: | 226.7 |
| U.S. Average: | 208.9 |
Violent crime rate in 2008
| Fort Collins: | 232.0 |
| U.S. Average: | 222.5 |
Violent crime rate in 2007
| Fort Collins: | 149.9 |
| U.S. Average: | 229.1 |
Violent crime rate in 2006
| Fort Collins: | 173.6 |
| U.S. Average: | 232.6 |
Violent crime rate in 2005
| Fort Collins: | 175.0 |
| U.S. Average: | 227.0 |
Property crime rate in 2022
| Fort Collins: | 195.2 |
| U.S. Average: | 166.5 |
Property crime rate in 2021
| Fort Collins: | 154.1 |
| U.S. Average: | 157.8 |
Property crime rate in 2020
| Fort Collins: | 155.3 |
| U.S. Average: | 169.6 |
Property crime rate in 2019
| Fort Collins: | 153.1 |
| U.S. Average: | 179.7 |
Property crime rate in 2018
| Fort Collins: | 152.8 |
| U.S. Average: | 190.2 |
Property crime rate in 2017
| Fort Collins: | 180.8 |
| U.S. Average: | 206.4 |
Property crime rate in 2016
| Fort Collins: | 176.2 |
| U.S. Average: | 216.6 |
Property crime rate in 2015
| Fort Collins: | 188.9 |
| U.S. Average: | 221.5 |
Property crime rate in 2014
| Fort Collins: | 180.3 |
| U.S. Average: | 230.8 |
Property crime rate in 2013
| Fort Collins: | 189.1 |
| U.S. Average: | 250.4 |
Property crime rate in 2012
| Fort Collins: | 208.3 |
| U.S. Average: | 267.3 |
Property crime rate in 2011
| Fort Collins: | 214.0 |
| U.S. Average: | 273.5 |
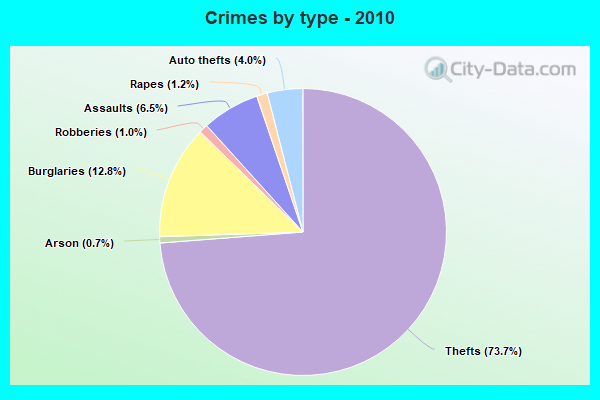
Property crime rate in 2010
| Fort Collins: | 239.1 |
| U.S. Average: | 276.4 |
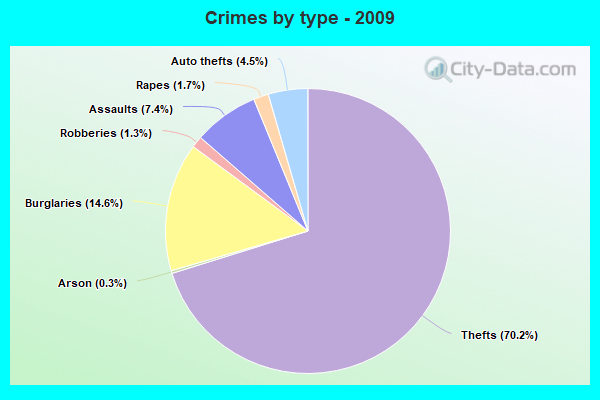
Property crime rate in 2009
| Fort Collins: | 263.5 |
| U.S. Average: | 285.6 |
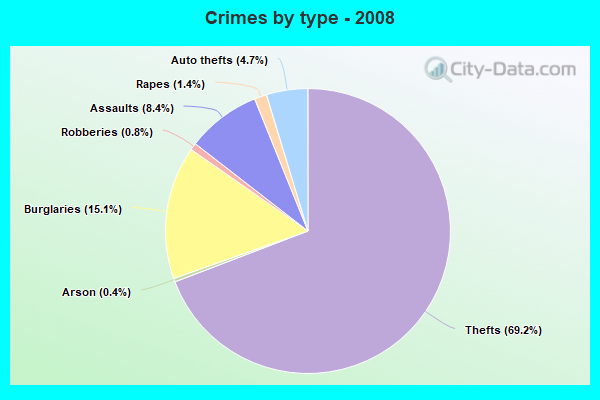
Property crime rate in 2008
| Fort Collins: | 274.0 |
| U.S. Average: | 302.2 |
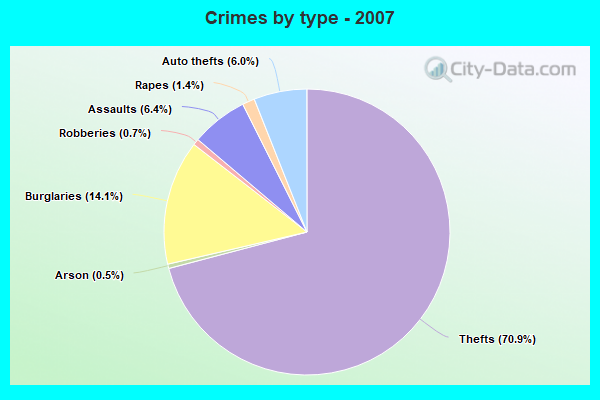
Property crime rate in 2007
| Fort Collins: | 217.3 |
| U.S. Average: | 309.2 |
Property crime rate in 2006
| Fort Collins: | 221.0 |
| U.S. Average: | 317.3 |
Property crime rate in 2005
| Fort Collins: | 234.6 |
| U.S. Average: | 322.3 |
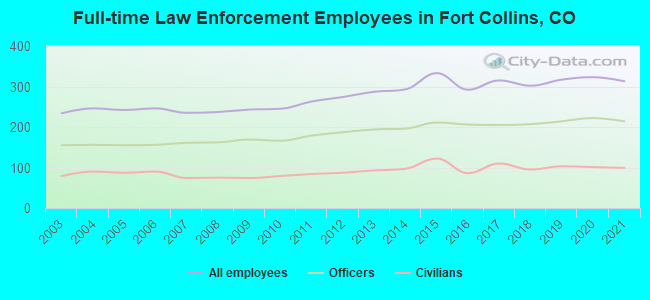
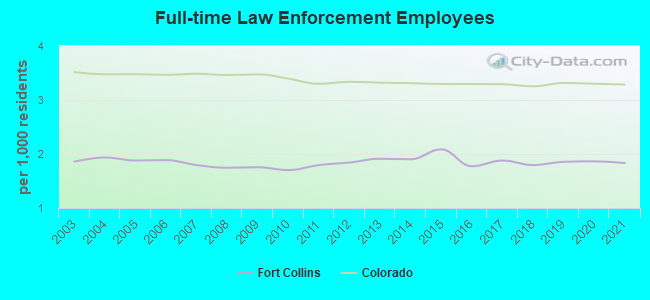
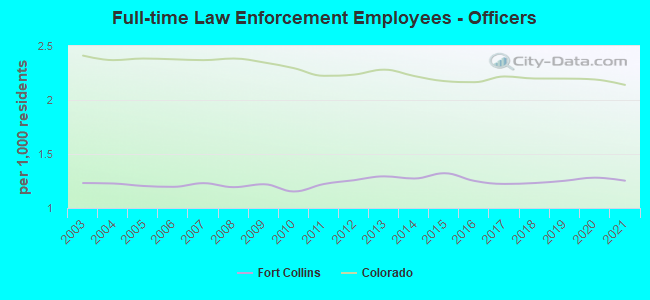
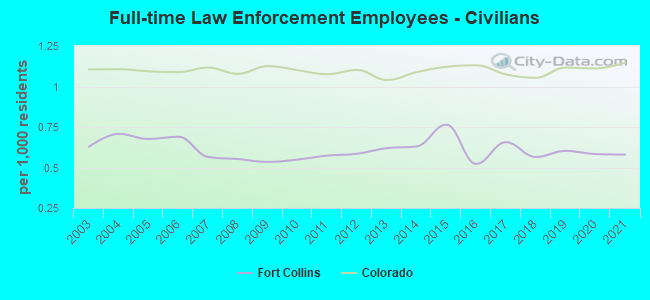
Full-time law enforcement employees in 2021, including police officers: 313 (214 officers - 186 male; 28 female).
| Officers per 1,000 residents here: | 1.25 |
| Colorado average: | 2.14 |
Full-time law enforcement employees in 2020, including police officers: 323 (222 officers - 194 male; 28 female).
| Officers per 1,000 residents here: | 1.28 |
| Colorado average: | 2.19 |
Full-time law enforcement employees in 2019, including police officers: 317 (214 officers - 184 male; 30 female).
| Officers per 1,000 residents here: | 1.25 |
| Colorado average: | 2.20 |
Full-time law enforcement employees in 2018, including police officers: 302 (207 officers - 178 male; 29 female).
| Officers per 1,000 residents here: | 1.23 |
| Colorado average: | 2.20 |
Full-time law enforcement employees in 2017, including police officers: 315 (205 officers - 173 male; 32 female).
| Officers per 1,000 residents here: | 1.22 |
| Colorado average: | 2.22 |
Full-time law enforcement employees in 2016, including police officers: 292 (206 officers - 173 male; 33 female).
| Officers per 1,000 residents here: | 1.25 |
| Colorado average: | 2.17 |
Full-time law enforcement employees in 2015, including police officers: 333 (211 officers - 177 male; 34 female).
| Officers per 1,000 residents here: | 1.32 |
| Colorado average: | 2.18 |
Full-time law enforcement employees in 2014, including police officers: 293 (196 officers - 167 male; 29 female).
| Officers per 1,000 residents here: | 1.27 |
| Colorado average: | 2.22 |
Full-time law enforcement employees in 2013, including police officers: 287 (194 officers - 165 male; 29 female).
| Officers per 1,000 residents here: | 1.29 |
| Colorado average: | 2.28 |
Full-time law enforcement employees in 2012, including police officers: 274 (187 officers - 158 male; 29 female).
| Officers per 1,000 residents here: | 1.26 |
| Colorado average: | 2.23 |
Full-time law enforcement employees in 2011, including police officers: 263 (179 officers - 151 male; 28 female).
| Officers per 1,000 residents here: | 1.22 |
| Colorado average: | 2.22 |
Full-time law enforcement employees in 2010, including police officers: 245 (166 officers - 140 male; 26 female).
| Officers per 1,000 residents here: | 1.15 |
| Colorado average: | 2.30 |
Full-time law enforcement employees in 2009, including police officers: 243 (169 officers - 142 male; 27 female).
| Officers per 1,000 residents here: | 1.22 |
| Colorado average: | 2.35 |
Full-time law enforcement employees in 2008, including police officers: 237 (162 officers - 135 male; 27 female).
| Officers per 1,000 residents here: | 1.19 |
| Colorado average: | 2.38 |
Full-time law enforcement employees in 2007, including police officers: 235 (161 officers - 133 male; 28 female).
| Officers per 1,000 residents here: | 1.23 |
| Colorado average: | 2.37 |
Full-time law enforcement employees in 2006, including police officers: 246 (156 officers - 129 male; 27 female).
| Officers per 1,000 residents here: | 1.20 |
| Colorado average: | 2.38 |
Full-time law enforcement employees in 2005, including police officers: 242 (155 officers - 127 male; 28 female).
| Officers per 1,000 residents here: | 1.20 |
| Colorado average: | 2.38 |
Full-time law enforcement employees in 2004, including police officers: 246 (156 officers - 130 male; 26 female).
| Officers per 1,000 residents here: | 1.23 |
| Colorado average: | 2.37 |
Full-time law enforcement employees in 2003, including police officers: 234 (155 officers - 129 male; 26 female).
| Officers per 1,000 residents here: | 1.23 |
| Colorado average: | 2.41 |