Crime rate in Lawton, Oklahoma (OK): murders, rapes, robberies, assaults, burglaries, thefts, auto thefts, arson, law enforcement employees, police officers, crime map
Crime rate in Lawton, OK
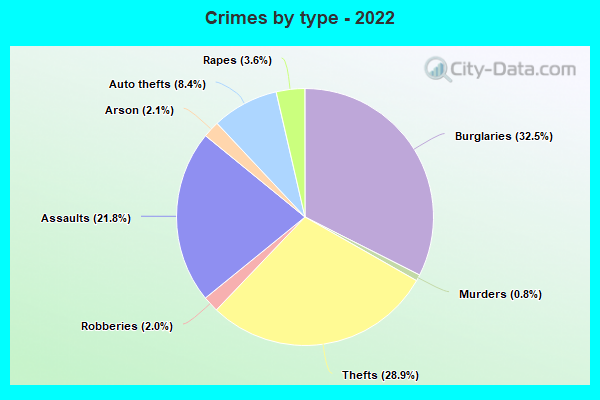
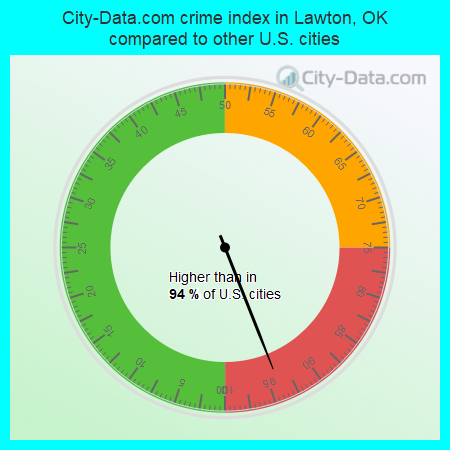
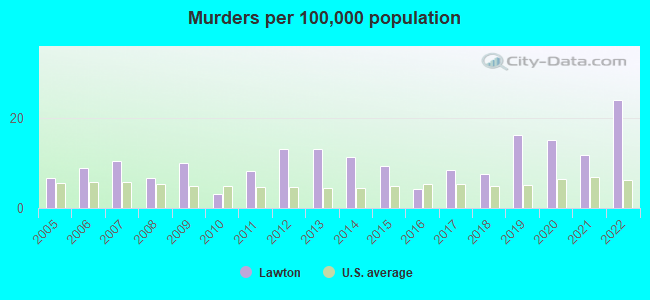
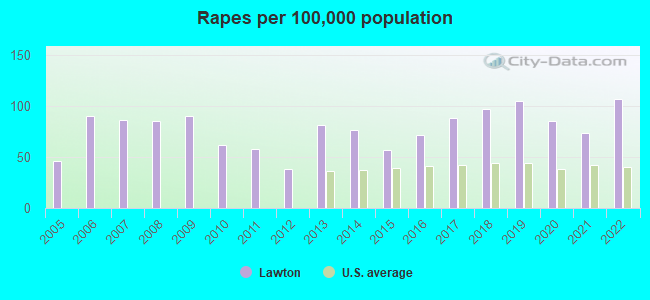
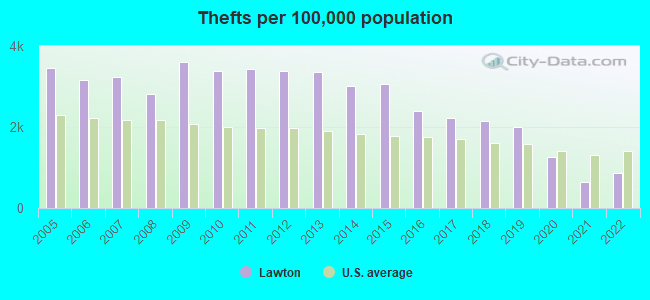
The 2022 crime rate in Lawton, OK is 403 (City-Data.com crime index), which is 1.6 times higher than the U.S. average. It was higher than in 94.0% U.S. cities. The 2022 Lawton crime rate rose by 34% compared to 2021. The number of homicides stood at 22 - an increase of 11 compared to 2021. In the last 5 years Lawton has seen decline of violent crime and decline of property crime.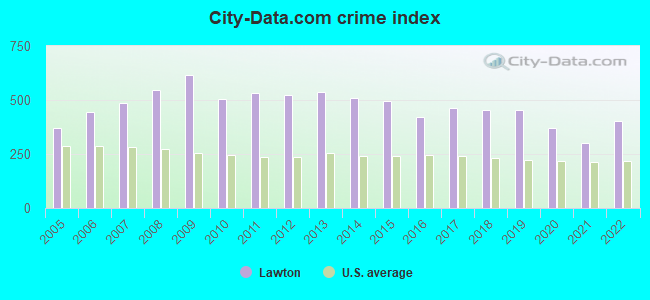
The City-Data.com crime index weighs serious crimes and violent crimes more heavily. Higher means more crime, U.S. average is 246.1. It adjusts for the number of visitors and daily workers commuting into cities.
- means the value is smaller than the state average.- means the value is about the same as the state average.
- means the value is bigger than the state average.
- means the value is much bigger than the state average.
According to our research of Oklahoma and other state lists, there were 121 registered sex offenders living in Lawton, Oklahoma as of April 28, 2024.
The ratio of all residents to sex offenders in Lawton is 782 to 1.
The ratio of registered sex offenders to all residents in this city is lower than the state average.
Violent crime rate in 2022
| Lawton: | 508.2 |
| U.S. Average: | 219.8 |
Violent crime rate in 2021
| Lawton: | 381.3 |
| U.S. Average: | 224.8 |
Violent crime rate in 2020
| Lawton: | 458.3 |
| U.S. Average: | 228.2 |
Violent crime rate in 2019
| Lawton: | 539.8 |
| U.S. Average: | 219.9 |
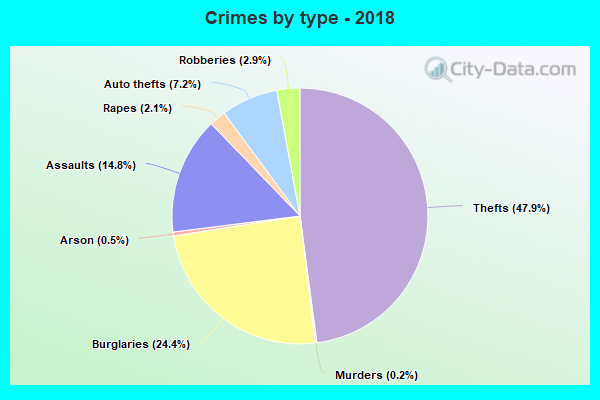
Violent crime rate in 2018
| Lawton: | 510.5 |
| U.S. Average: | 221.2 |
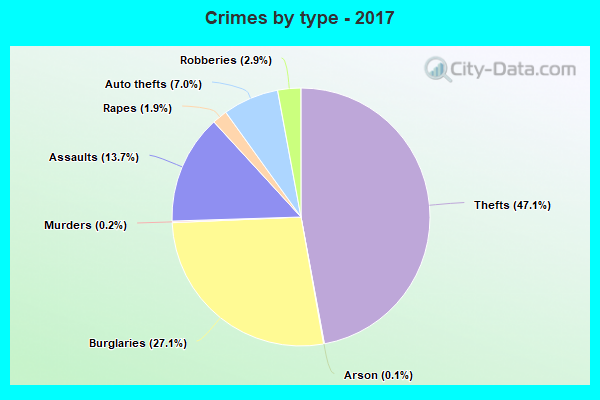
Violent crime rate in 2017
| Lawton: | 498.2 |
| U.S. Average: | 226.2 |
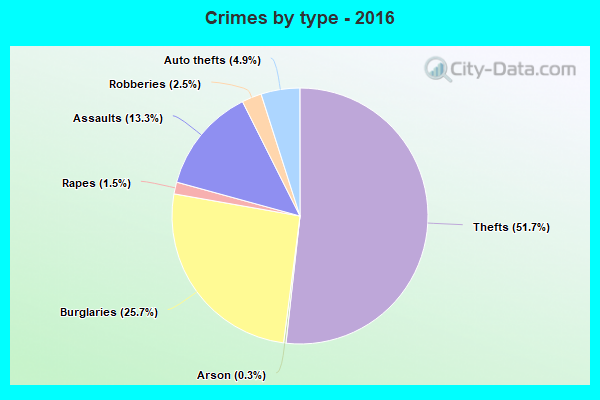
Violent crime rate in 2016
| Lawton: | 447.0 |
| U.S. Average: | 227.3 |
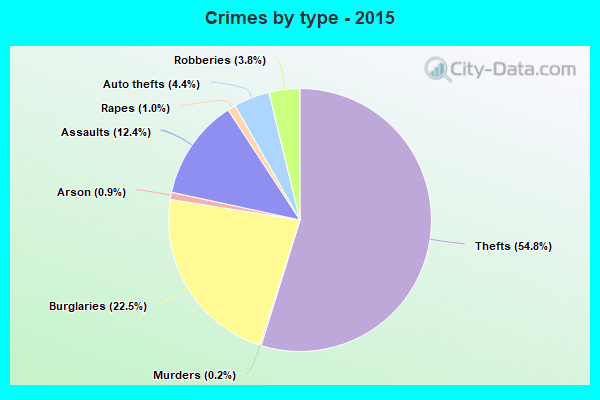
Violent crime rate in 2015
| Lawton: | 528.9 |
| U.S. Average: | 219.3 |
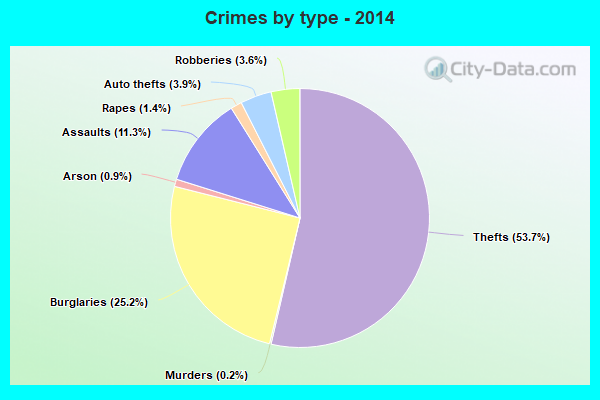
Violent crime rate in 2014
| Lawton: | 516.2 |
| U.S. Average: | 211.1 |
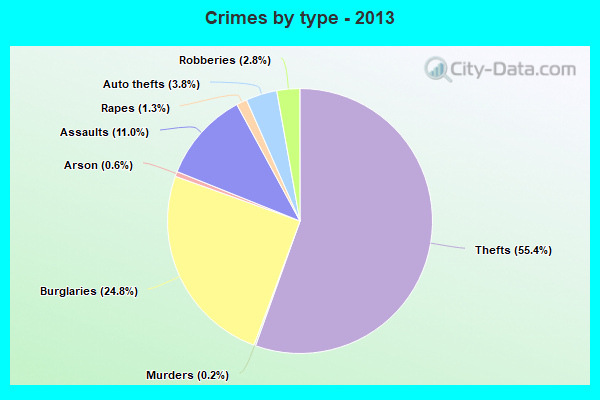
Violent crime rate in 2013
| Lawton: | 526.6 |
| U.S. Average: | 214.2 |
Violent crime rate in 2012
| Lawton: | 504.7 |
| U.S. Average: | 187.4 |
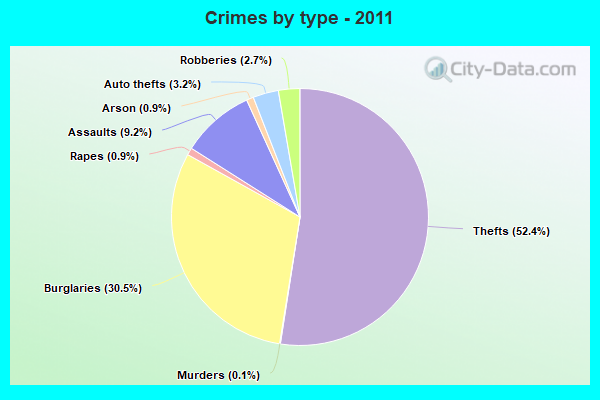
Violent crime rate in 2011
| Lawton: | 464.7 |
| U.S. Average: | 187.1 |
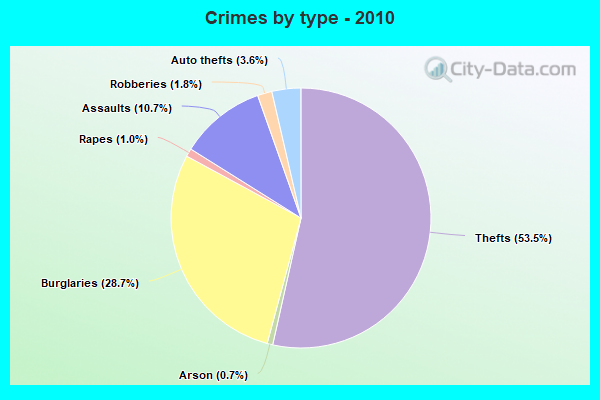
Violent crime rate in 2010
| Lawton: | 464.6 |
| U.S. Average: | 195.7 |
Violent crime rate in 2009
| Lawton: | 671.2 |
| U.S. Average: | 208.9 |
Violent crime rate in 2008
| Lawton: | 599.7 |
| U.S. Average: | 222.5 |
Violent crime rate in 2007
| Lawton: | 532.9 |
| U.S. Average: | 229.1 |
Violent crime rate in 2006
| Lawton: | 447.2 |
| U.S. Average: | 232.6 |
Violent crime rate in 2005
| Lawton: | 322.3 |
| U.S. Average: | 227.0 |
Property crime rate in 2022
| Lawton: | 273.3 |
| U.S. Average: | 166.5 |
Property crime rate in 2021
| Lawton: | 220.9 |
| U.S. Average: | 157.8 |
Property crime rate in 2020
| Lawton: | 243.9 |
| U.S. Average: | 169.6 |
Property crime rate in 2019
| Lawton: | 331.7 |
| U.S. Average: | 179.7 |
Property crime rate in 2018
| Lawton: | 376.6 |
| U.S. Average: | 190.2 |
Property crime rate in 2017
| Lawton: | 417.9 |
| U.S. Average: | 206.4 |
Property crime rate in 2016
| Lawton: | 393.5 |
| U.S. Average: | 216.6 |
Property crime rate in 2015
| Lawton: | 441.6 |
| U.S. Average: | 221.5 |
Property crime rate in 2014
| Lawton: | 466.3 |
| U.S. Average: | 230.8 |
Property crime rate in 2013
| Lawton: | 504.3 |
| U.S. Average: | 250.4 |
Property crime rate in 2012
| Lawton: | 530.8 |
| U.S. Average: | 267.3 |
Property crime rate in 2011
| Lawton: | 603.8 |
| U.S. Average: | 273.5 |
Property crime rate in 2010
| Lawton: | 565.8 |
| U.S. Average: | 276.4 |
Property crime rate in 2009
| Lawton: | 541.8 |
| U.S. Average: | 285.6 |
Property crime rate in 2008
| Lawton: | 494.3 |
| U.S. Average: | 302.2 |
Property crime rate in 2007
| Lawton: | 445.6 |
| U.S. Average: | 309.2 |
Property crime rate in 2006
| Lawton: | 430.3 |
| U.S. Average: | 317.3 |
Property crime rate in 2005
| Lawton: | 405.8 |
| U.S. Average: | 322.3 |
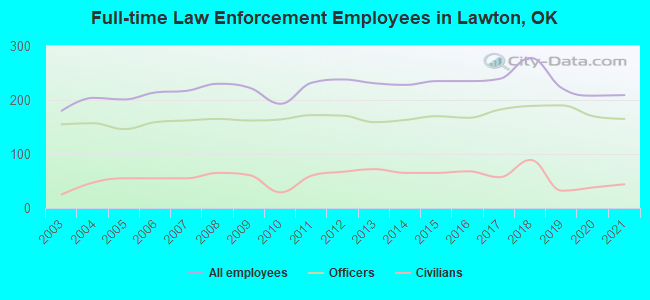
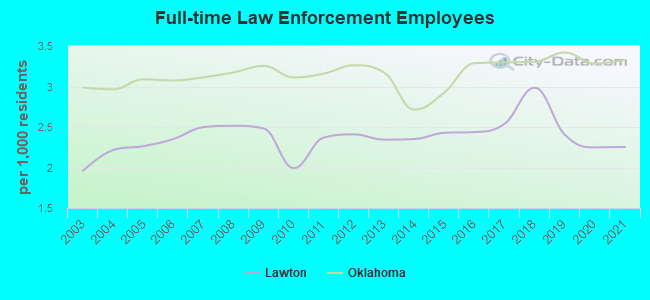
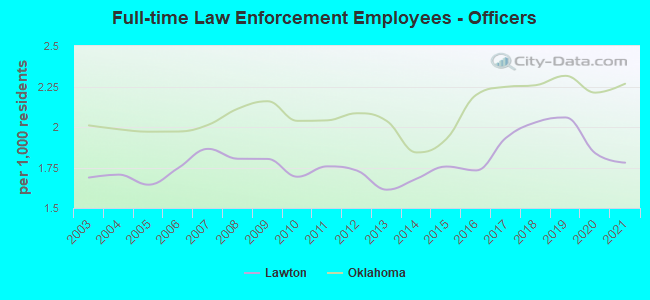
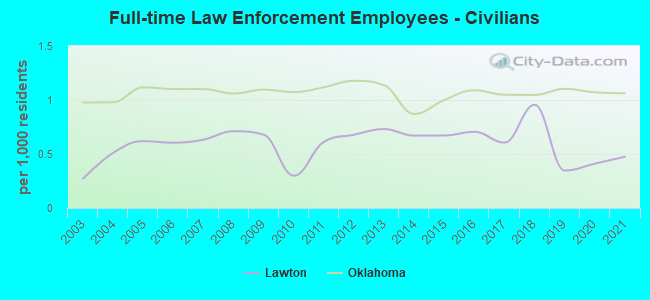
Full-time law enforcement employees in 2021, including police officers: 209 (165 officers - 155 male; 10 female).
| Officers per 1,000 residents here: | 1.78 |
| Oklahoma average: | 2.27 |
Full-time law enforcement employees in 2020, including police officers: 208 (170 officers - 159 male; 11 female).
| Officers per 1,000 residents here: | 1.84 |
| Oklahoma average: | 2.21 |
Full-time law enforcement employees in 2019, including police officers: 222 (190 officers - 175 male; 15 female).
| Officers per 1,000 residents here: | 2.06 |
| Oklahoma average: | 2.32 |
Full-time law enforcement employees in 2018, including police officers: 278 (189 officers - 174 male; 15 female).
| Officers per 1,000 residents here: | 2.03 |
| Oklahoma average: | 2.26 |
Full-time law enforcement employees in 2017, including police officers: 239 (182 officers - 168 male; 14 female).
| Officers per 1,000 residents here: | 1.93 |
| Oklahoma average: | 2.25 |
Full-time law enforcement employees in 2016, including police officers: 235 (167 officers - 154 male; 13 female).
| Officers per 1,000 residents here: | 1.73 |
| Oklahoma average: | 2.20 |
Full-time law enforcement employees in 2015, including police officers: 235 (170 officers - 155 male; 15 female).
| Officers per 1,000 residents here: | 1.76 |
| Oklahoma average: | 1.93 |
Full-time law enforcement employees in 2014, including police officers: 228 (163 officers - 149 male; 14 female).
| Officers per 1,000 residents here: | 1.68 |
| Oklahoma average: | 1.84 |
Full-time law enforcement employees in 2013, including police officers: 231 (159 officers - 146 male; 13 female).
| Officers per 1,000 residents here: | 1.61 |
| Oklahoma average: | 2.04 |
Full-time law enforcement employees in 2012, including police officers: 238 (171 officers - 158 male; 13 female).
| Officers per 1,000 residents here: | 1.73 |
| Oklahoma average: | 2.08 |
Full-time law enforcement employees in 2011, including police officers: 232 (172 officers - 159 male; 13 female).
| Officers per 1,000 residents here: | 1.76 |
| Oklahoma average: | 2.04 |
Full-time law enforcement employees in 2010, including police officers: 193 (164 officers - 153 male; 11 female).
| Officers per 1,000 residents here: | 1.69 |
| Oklahoma average: | 2.04 |
Full-time law enforcement employees in 2009, including police officers: 223 (162 officers - 151 male; 11 female).
| Officers per 1,000 residents here: | 1.80 |
| Oklahoma average: | 2.16 |
Full-time law enforcement employees in 2008, including police officers: 230 (165 officers - 155 male; 10 female).
| Officers per 1,000 residents here: | 1.80 |
| Oklahoma average: | 2.11 |
Full-time law enforcement employees in 2007, including police officers: 217 (162 officers - 156 male; 6 female).
| Officers per 1,000 residents here: | 1.86 |
| Oklahoma average: | 2.01 |
Full-time law enforcement employees in 2006, including police officers: 214 (159 officers - 153 male; 6 female).
| Officers per 1,000 residents here: | 1.75 |
| Oklahoma average: | 1.97 |
Full-time law enforcement employees in 2005, including police officers: 201 (146 officers - 140 male; 6 female).
| Officers per 1,000 residents here: | 1.64 |
| Oklahoma average: | 1.97 |
Full-time law enforcement employees in 2004, including police officers: 204 (157 officers - 152 male; 5 female).
| Officers per 1,000 residents here: | 1.71 |
| Oklahoma average: | 1.99 |
Full-time law enforcement employees in 2003, including police officers: 180 (155 officers - 148 male; 7 female).
| Officers per 1,000 residents here: | 1.69 |
| Oklahoma average: | 2.01 |