Crime rate in Pompano Beach, Florida (FL): murders, rapes, robberies, assaults, burglaries, thefts, auto thefts, arson, law enforcement employees, police officers, crime map
Crime rate in Pompano Beach, FL
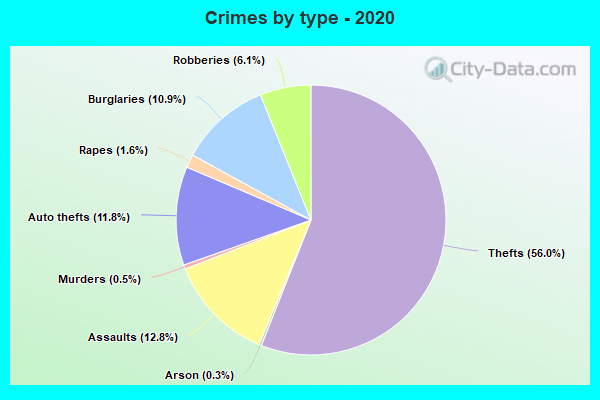
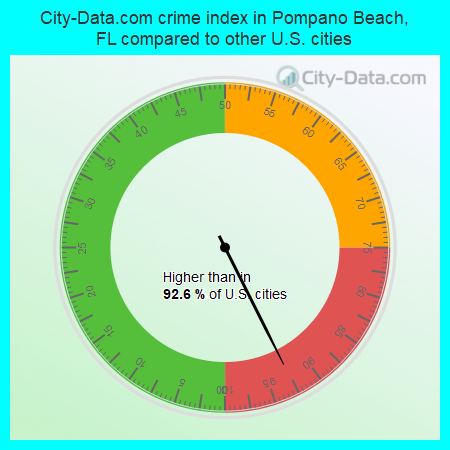
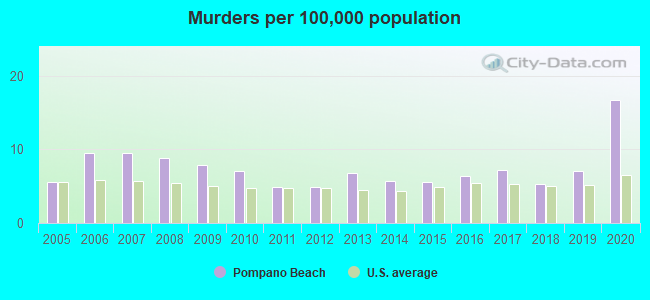
The 2020 crime rate in Pompano Beach, FL is 371 (City-Data.com crime index), which is 1.5 times greater than the U.S. average. It was higher than in 92.6% U.S. cities. The 2020 Pompano Beach crime rate fell by 13% compared to 2019. The number of homicides stood at 19 - an increase of 11 compared to 2019. In the last 5 years Pompano Beach has seen decreasing violent crime and decline of property crime.See how dangerous Pompano Beach, FL is compared to the nearest cities:
(Note: Higher means more crime)
(Note: Higher means more crime)
| Pompano Beach: | 370.5 |
| Sea Ranch Lakes: | 127.3 |
| Lighthouse Point: | 94.0 |
| Lauderdale-by-the-Sea: | 147.0 |
| Oakland Park: | 327.4 |
| Coconut Creek: | 90.8 |
| Deerfield Beach: | 191.2 |
| Hillsboro Beach: | 29.9 |
| Wilton Manors: | 270.6 |
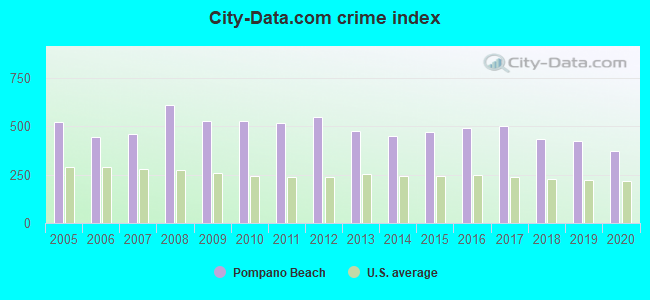
The City-Data.com crime index weighs serious crimes and violent crimes more heavily. Higher means more crime, U.S. average is 246.1. It adjusts for the number of visitors and daily workers commuting into cities.
- means the value is smaller than the state average.- means the value is about the same as the state average.
- means the value is bigger than the state average.
- means the value is much bigger than the state average.
According to our research of Florida and other state lists, there were 100 registered sex offenders living in Pompano Beach, Florida as of April 27, 2024.
The ratio of all residents to sex offenders in Pompano Beach is 1,094 to 1.
The ratio of registered sex offenders to all residents in this city is lower than the state average.
Violent crime rate in 2020
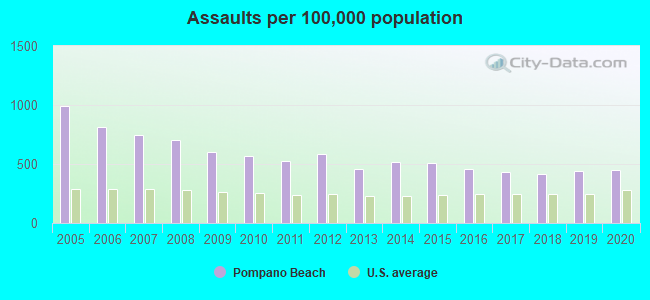
| Pompano Beach: | 421.0 |
| U.S. Average: | 228.2 |
Violent crime rate in 2019
| Pompano Beach: | 439.1 |
| U.S. Average: | 219.9 |
Violent crime rate in 2018
| Pompano Beach: | 439.6 |
| U.S. Average: | 221.2 |
Violent crime rate in 2017
| Pompano Beach: | 469.7 |
| U.S. Average: | 226.2 |
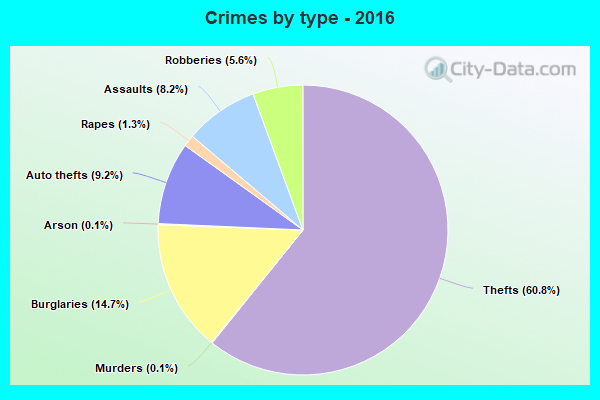
Violent crime rate in 2016
| Pompano Beach: | 470.5 |
| U.S. Average: | 227.3 |
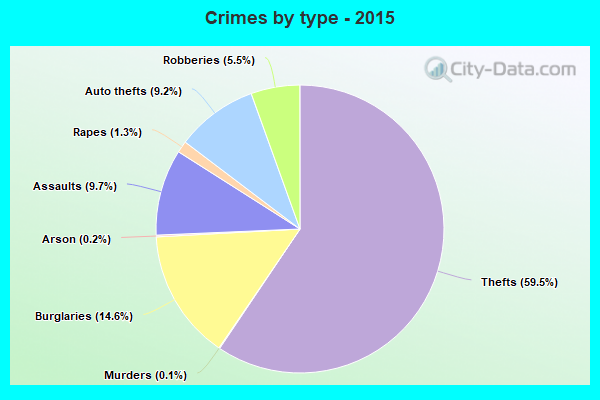
Violent crime rate in 2015
| Pompano Beach: | 478.4 |
| U.S. Average: | 219.3 |
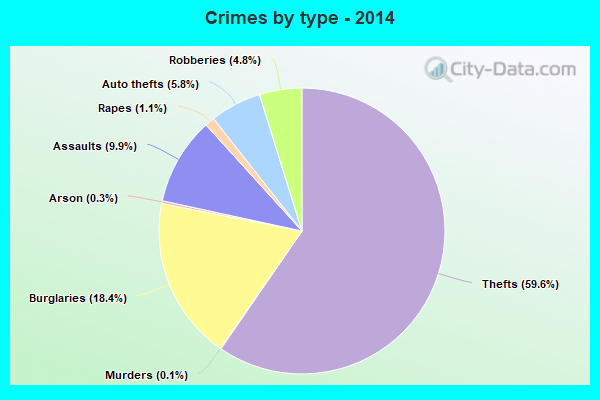
Violent crime rate in 2014
| Pompano Beach: | 449.7 |
| U.S. Average: | 211.1 |
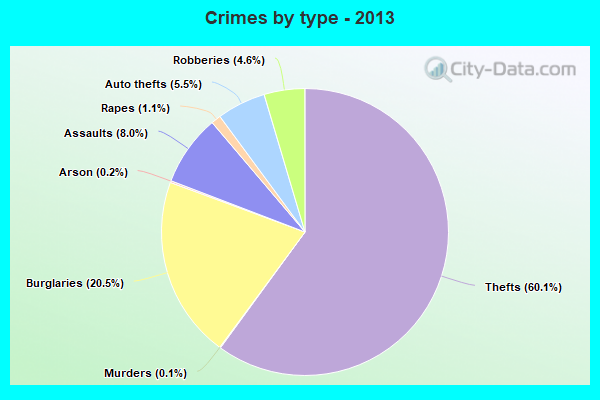
Violent crime rate in 2013
| Pompano Beach: | 434.7 |
| U.S. Average: | 214.2 |
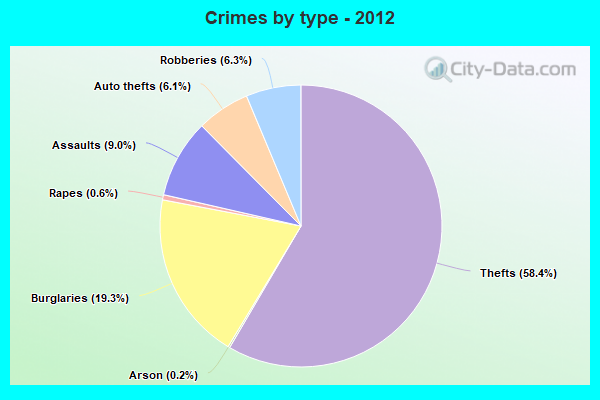
Violent crime rate in 2012
| Pompano Beach: | 539.8 |
| U.S. Average: | 187.4 |
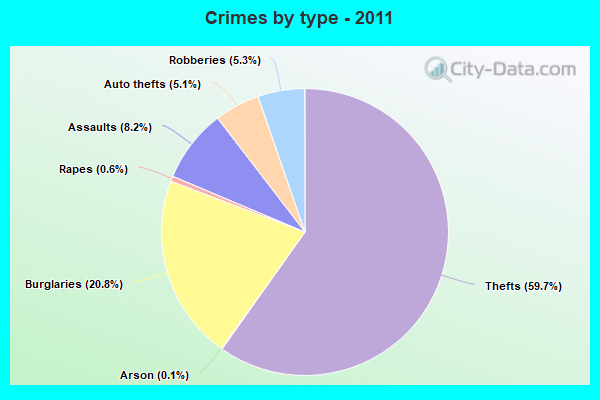
Violent crime rate in 2011
| Pompano Beach: | 480.7 |
| U.S. Average: | 187.1 |
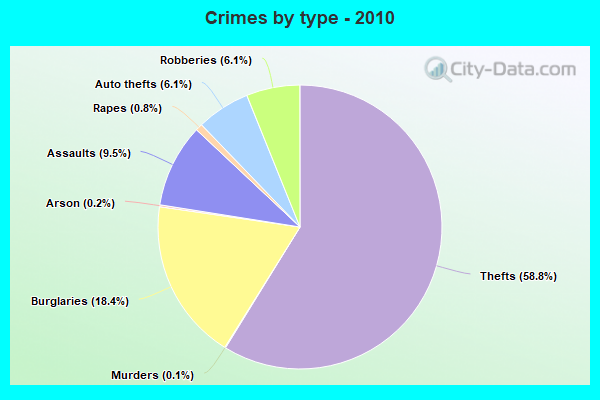
Violent crime rate in 2010
| Pompano Beach: | 532.3 |
| U.S. Average: | 195.7 |
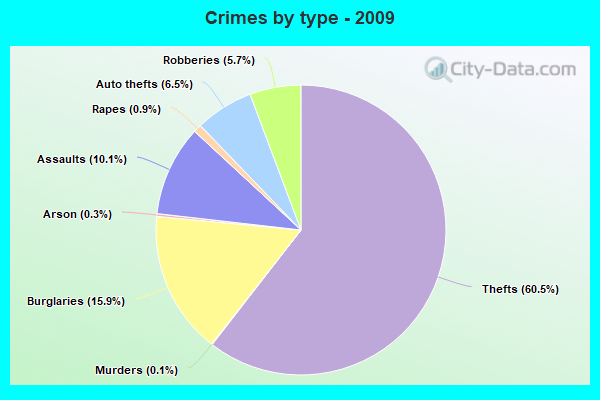
Violent crime rate in 2009
| Pompano Beach: | 545.0 |
| U.S. Average: | 208.9 |
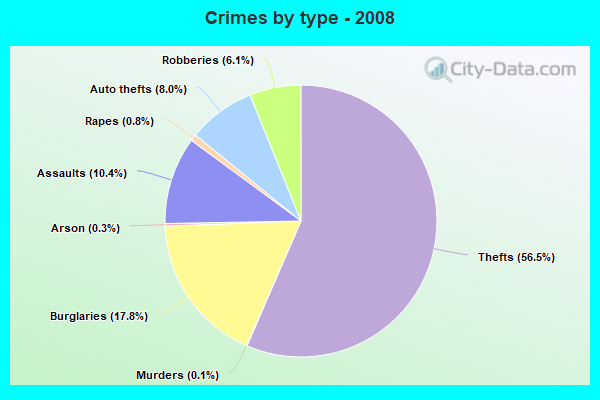
Violent crime rate in 2008
| Pompano Beach: | 635.3 |
| U.S. Average: | 222.5 |
Violent crime rate in 2007
| Pompano Beach: | 505.7 |
| U.S. Average: | 229.1 |
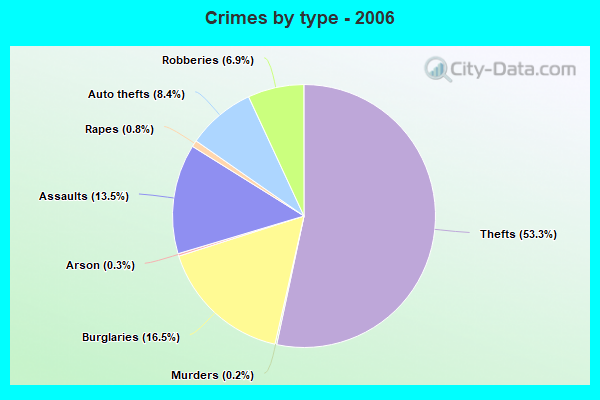
Violent crime rate in 2006
| Pompano Beach: | 518.3 |
| U.S. Average: | 232.6 |
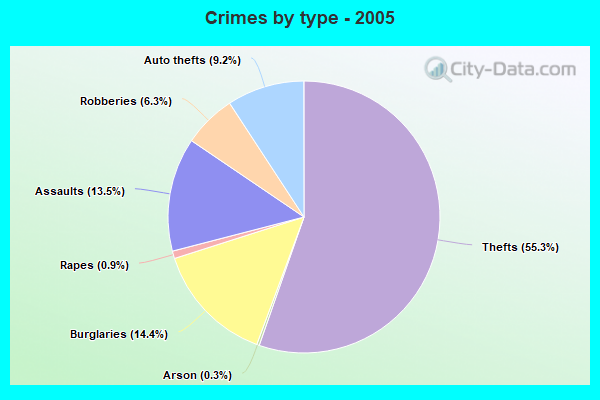
Violent crime rate in 2005
| Pompano Beach: | 605.4 |
| U.S. Average: | 227.0 |
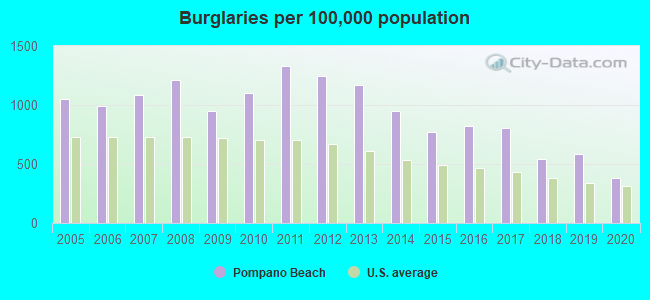
Property crime rate in 2020
| Pompano Beach: | 237.2 |
| U.S. Average: | 169.6 |
Property crime rate in 2019
| Pompano Beach: | 324.8 |
| U.S. Average: | 179.7 |
Property crime rate in 2018
| Pompano Beach: | 325.2 |
| U.S. Average: | 190.2 |
Property crime rate in 2017
| Pompano Beach: | 434.1 |
| U.S. Average: | 206.4 |
Property crime rate in 2016
| Pompano Beach: | 413.4 |
| U.S. Average: | 216.6 |
Property crime rate in 2015
| Pompano Beach: | 383.8 |
| U.S. Average: | 221.5 |
Property crime rate in 2014
| Pompano Beach: | 388.9 |
| U.S. Average: | 230.8 |
Property crime rate in 2013
| Pompano Beach: | 454.3 |
| U.S. Average: | 250.4 |
Property crime rate in 2012
| Pompano Beach: | 496.0 |
| U.S. Average: | 267.3 |
Property crime rate in 2011
| Pompano Beach: | 504.5 |
| U.S. Average: | 273.5 |
Property crime rate in 2010
| Pompano Beach: | 452.4 |
| U.S. Average: | 276.4 |
Property crime rate in 2009
| Pompano Beach: | 430.7 |
| U.S. Average: | 285.6 |
Property crime rate in 2008
| Pompano Beach: | 515.4 |
| U.S. Average: | 302.2 |
Property crime rate in 2007
| Pompano Beach: | 361.9 |
| U.S. Average: | 309.2 |
Property crime rate in 2006
| Pompano Beach: | 328.9 |
| U.S. Average: | 317.3 |
Property crime rate in 2005
| Pompano Beach: | 389.3 |
| U.S. Average: | 322.3 |

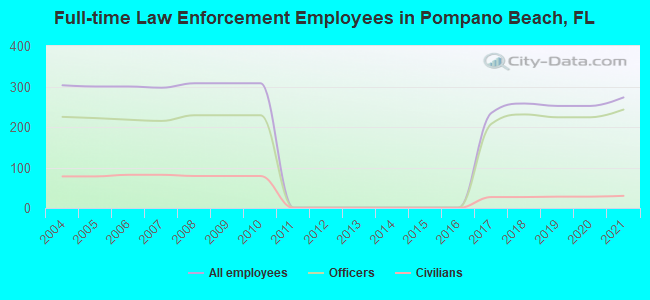
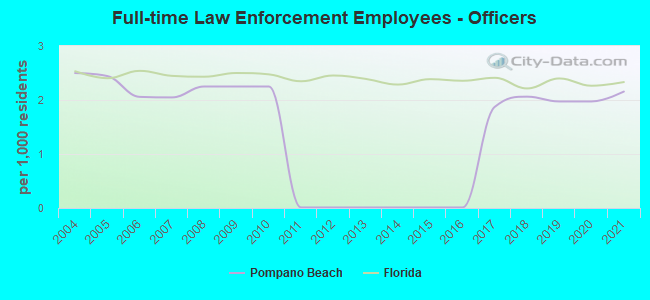
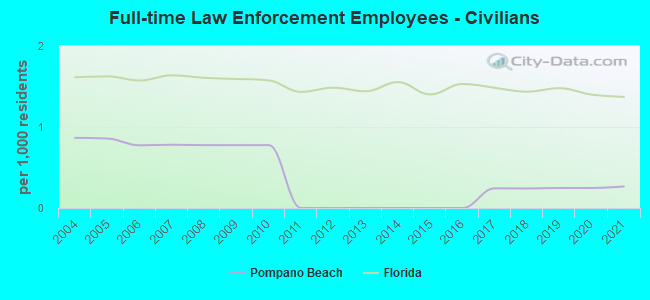
Full-time law enforcement employees in 2021, including police officers: 273 (243 officers - 214 male; 29 female).
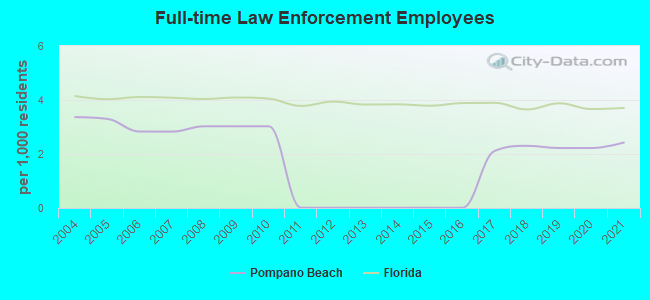
| Officers per 1,000 residents here: | 2.16 |
| Florida average: | 2.33 |
Full-time law enforcement employees in 2019, including police officers: 252 (224 officers - 192 male; 32 female).
| Officers per 1,000 residents here: | 1.97 |
| Florida average: | 2.40 |
Full-time law enforcement employees in 2018, including police officers: 258 (231 officers - 203 male; 28 female).
| Officers per 1,000 residents here: | 2.06 |
| Florida average: | 2.21 |
Full-time law enforcement employees in 2017, including police officers: 235 (208 officers - 191 male; 17 female).
| Officers per 1,000 residents here: | 1.87 |
| Florida average: | 2.41 |
Full-time law enforcement employees in 2011, including police officers: 1 (1 officers - 1 male; 0 female).
| Officers per 1,000 residents here: | 0.01 |
| Florida average: | 2.35 |
Full-time law enforcement employees in 2008, including police officers: 308 (229 officers - 204 male; 25 female).
| Officers per 1,000 residents here: | 2.25 |
| Florida average: | 2.43 |
Full-time law enforcement employees in 2007, including police officers: 297 (215 officers - 196 male; 19 female).
| Officers per 1,000 residents here: | 2.05 |
| Florida average: | 2.45 |
Full-time law enforcement employees in 2006, including police officers: 300 (218 officers - 200 male; 18 female).
| Officers per 1,000 residents here: | 2.06 |
| Florida average: | 2.54 |
Full-time law enforcement employees in 2005, including police officers: 300 (222 officers - 200 male; 22 female).
| Officers per 1,000 residents here: | 2.44 |
| Florida average: | 2.40 |
Full-time law enforcement employees in 2004, including police officers: 303 (225 officers - 205 male; 20 female).
| Officers per 1,000 residents here: | 2.50 |
| Florida average: | 2.53 |