Crime rate in Richmond, Virginia (VA): murders, rapes, robberies, assaults, burglaries, thefts, auto thefts, arson, law enforcement employees, police officers, crime map
Crime rate in Richmond, VA
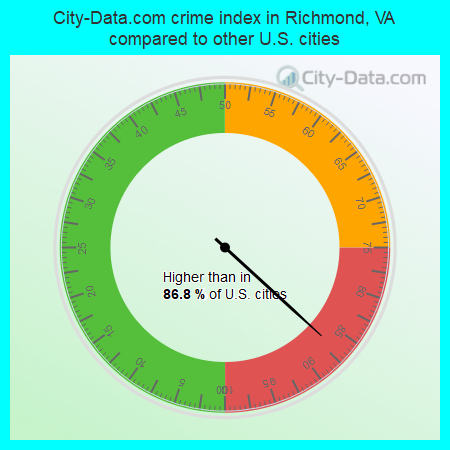
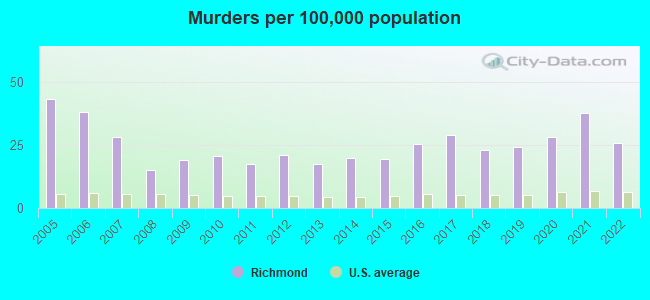
The 2022 crime rate in Richmond, VA is 292 (City-Data.com crime index), which is comparable to the U.S. average. It was higher than in 86.8% U.S. cities. The 2022 Richmond crime rate rose by 2% compared to 2021. The number of homicides stood at 59 - a decrease of 30 compared to 2021. In the last 5 years Richmond has seen decline of violent crime and decline of property crime.See how dangerous Richmond, VA is compared to the nearest cities:
(Note: Higher means more crime)
(Note: Higher means more crime)
| Richmond: | 292.2 |
| Ashland: | 239.8 |
| Hopewell: | 310.1 |
| Colonial Heights: | 247.7 |
| Petersburg: | 439.7 |
| West Point: | 59.9 |
| Bowling Green: | 13.5 |
| Tappahannock: | 270.1 |
| Blackstone: | 180.2 |
The City-Data.com crime index weighs serious crimes and violent crimes more heavily. Higher means more crime, U.S. average is 246.1. It adjusts for the number of visitors and daily workers commuting into cities.
- means the value is smaller than the state average.- means the value is about the same as the state average.
- means the value is bigger than the state average.
- means the value is much bigger than the state average.
According to our research of Virginia and other state lists, there were 7,076 registered sex offenders living in Richmond, Virginia as of May 10, 2024.
The ratio of all residents to sex offenders in Richmond is 32 to 1.
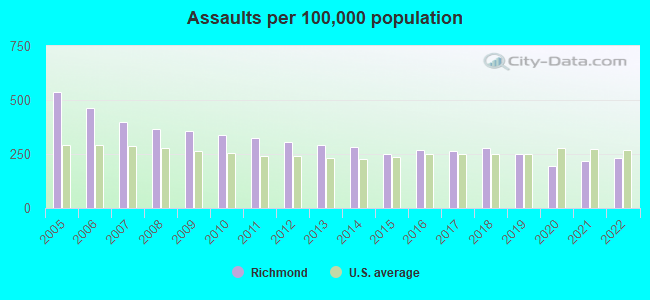
Violent crime rate in 2022
| Richmond: | 221.1 |
| U.S. Average: | 219.8 |
Violent crime rate in 2021
| Richmond: | 247.9 |
| U.S. Average: | 224.8 |
Violent crime rate in 2020
| Richmond: | 224.6 |
| U.S. Average: | 228.2 |
Violent crime rate in 2019
| Richmond: | 278.9 |
| U.S. Average: | 219.9 |
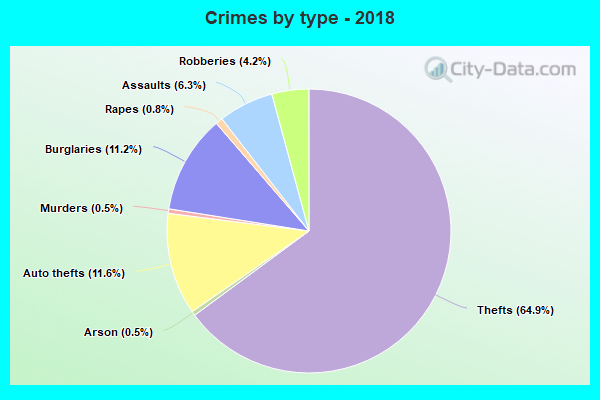
Violent crime rate in 2018
| Richmond: | 312.1 |
| U.S. Average: | 221.2 |
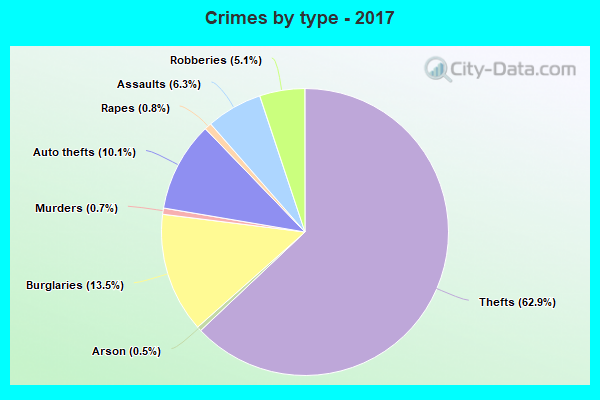
Violent crime rate in 2017
| Richmond: | 331.3 |
| U.S. Average: | 226.2 |
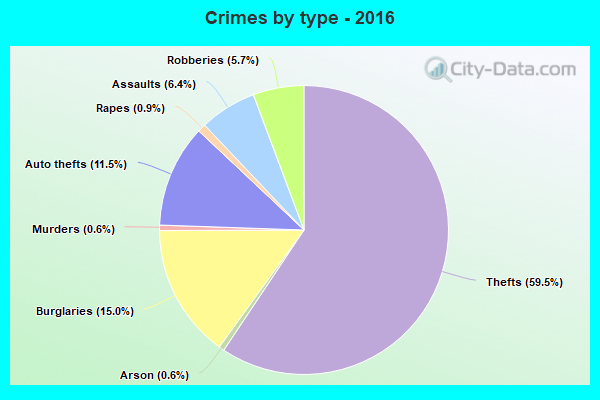
Violent crime rate in 2016
| Richmond: | 340.8 |
| U.S. Average: | 227.3 |
Violent crime rate in 2015
| Richmond: | 309.6 |
| U.S. Average: | 219.3 |
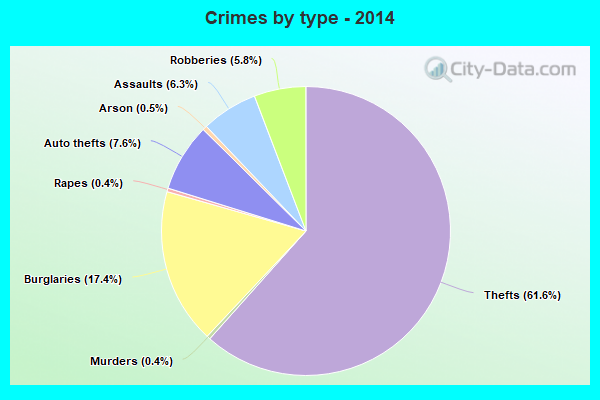
Violent crime rate in 2014
| Richmond: | 331.3 |
| U.S. Average: | 211.1 |
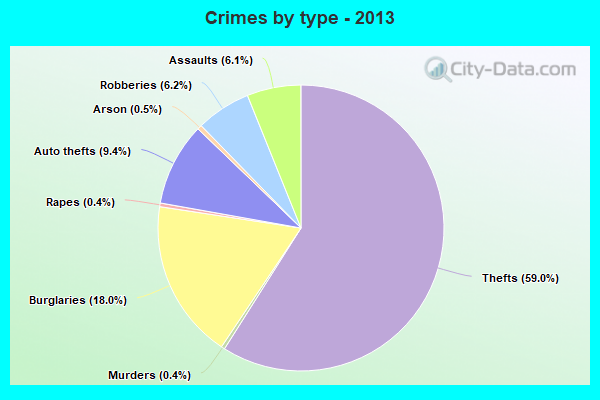
Violent crime rate in 2013
| Richmond: | 347.7 |
| U.S. Average: | 214.2 |
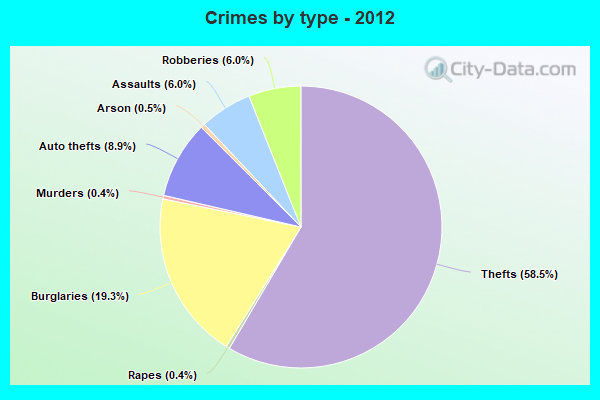
Violent crime rate in 2012
| Richmond: | 367.2 |
| U.S. Average: | 187.4 |
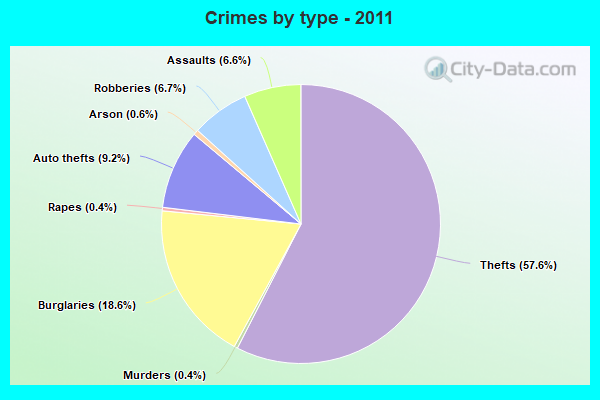
Violent crime rate in 2011
| Richmond: | 383.2 |
| U.S. Average: | 187.1 |
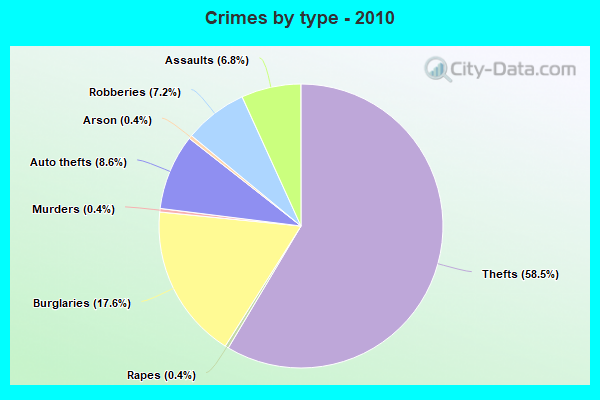
Violent crime rate in 2010
| Richmond: | 411.6 |
| U.S. Average: | 195.7 |
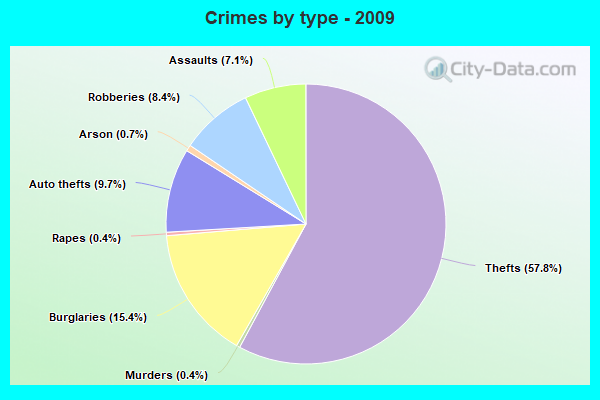
Violent crime rate in 2009
| Richmond: | 446.0 |
| U.S. Average: | 208.9 |
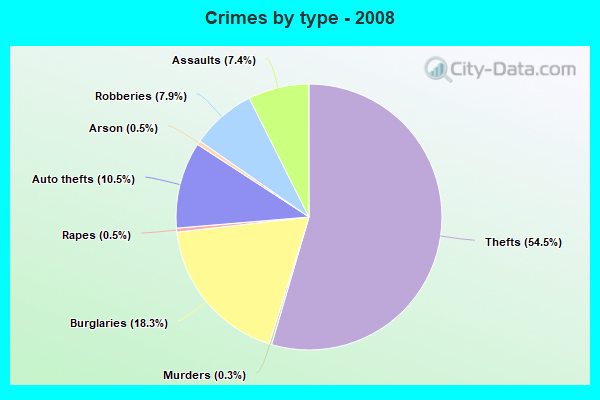
Violent crime rate in 2008
| Richmond: | 433.0 |
| U.S. Average: | 222.5 |
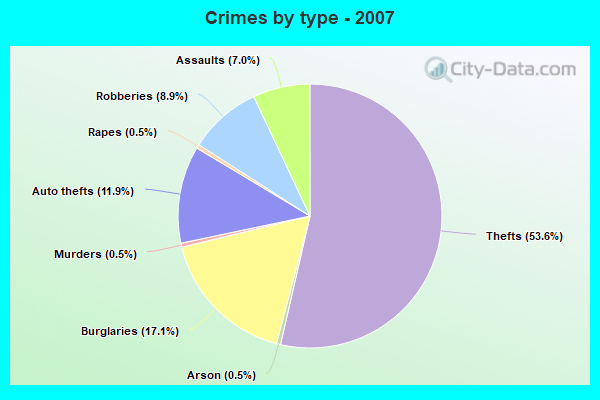
Violent crime rate in 2007
| Richmond: | 419.4 |
| U.S. Average: | 229.1 |
Violent crime rate in 2006
| Richmond: | 468.4 |
| U.S. Average: | 232.6 |
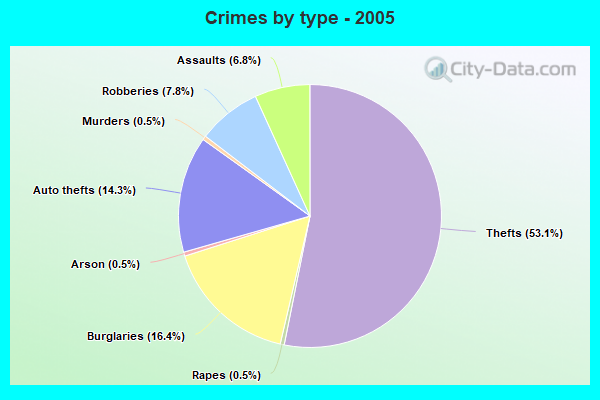
Violent crime rate in 2005
| Richmond: | 550.1 |
| U.S. Average: | 227.0 |
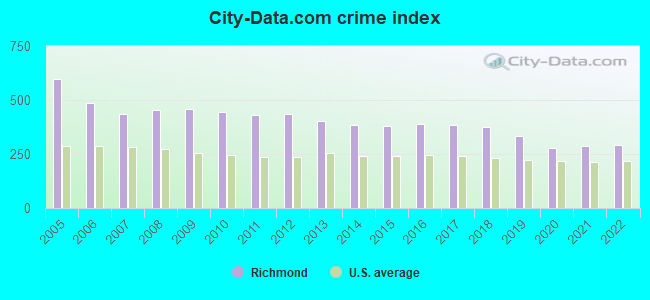
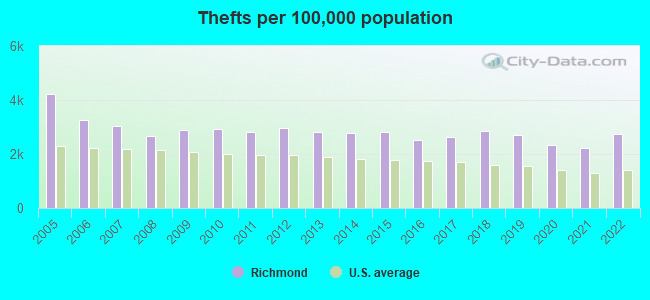
Property crime rate in 2022
| Richmond: | 257.1 |
| U.S. Average: | 166.5 |
Property crime rate in 2021
| Richmond: | 206.2 |
| U.S. Average: | 157.8 |
Property crime rate in 2020
| Richmond: | 222.9 |
| U.S. Average: | 169.6 |
Property crime rate in 2019
| Richmond: | 276.3 |
| U.S. Average: | 179.7 |
Property crime rate in 2018
| Richmond: | 316.3 |
| U.S. Average: | 190.2 |
Property crime rate in 2017
| Richmond: | 310.2 |
| U.S. Average: | 206.4 |
Property crime rate in 2016
| Richmond: | 325.2 |
| U.S. Average: | 216.6 |
Property crime rate in 2015
| Richmond: | 345.8 |
| U.S. Average: | 221.5 |
Property crime rate in 2014
| Richmond: | 345.4 |
| U.S. Average: | 230.8 |
Property crime rate in 2013
| Richmond: | 378.0 |
| U.S. Average: | 250.4 |
Property crime rate in 2012
| Richmond: | 411.4 |
| U.S. Average: | 267.3 |
Property crime rate in 2011
| Richmond: | 392.1 |
| U.S. Average: | 273.5 |
Property crime rate in 2010
| Richmond: | 384.3 |
| U.S. Average: | 276.4 |
Property crime rate in 2009
| Richmond: | 372.0 |
| U.S. Average: | 285.6 |
Property crime rate in 2008
| Richmond: | 391.2 |
| U.S. Average: | 302.2 |
Property crime rate in 2007
| Richmond: | 349.8 |
| U.S. Average: | 309.2 |
Property crime rate in 2006
| Richmond: | 397.1 |
| U.S. Average: | 317.3 |
Property crime rate in 2005
| Richmond: | 500.9 |
| U.S. Average: | 322.3 |
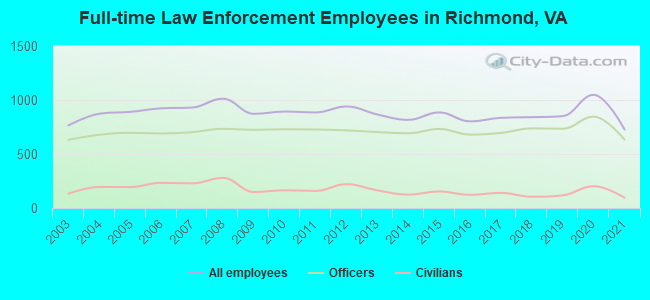
Full-time law enforcement employees in 2021, including police officers: 727 (632 officers - 522 male; 110 female).
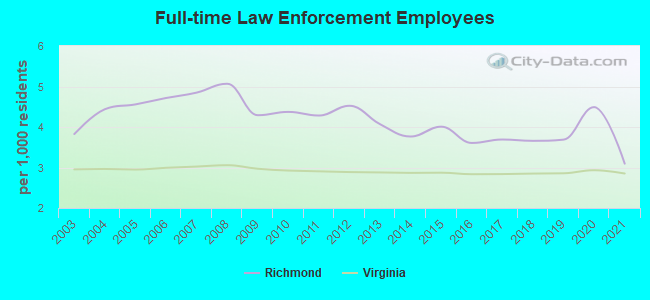
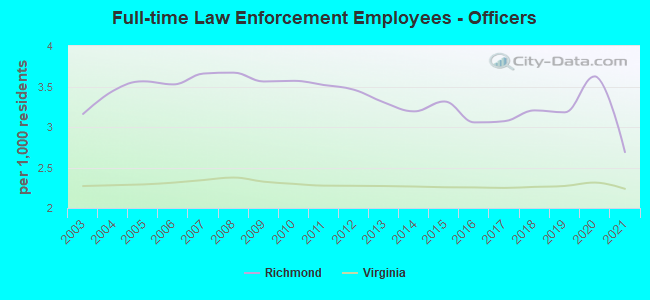
| Officers per 1,000 residents here: | 2.69 |
| Virginia average: | 2.24 |
Full-time law enforcement employees in 2020, including police officers: 1,048 (846 officers - 687 male; 159 female).
| Officers per 1,000 residents here: | 3.63 |
| Virginia average: | 2.31 |
Full-time law enforcement employees in 2019, including police officers: 851 (734 officers - 605 male; 129 female).
| Officers per 1,000 residents here: | 3.18 |
| Virginia average: | 2.27 |
Full-time law enforcement employees in 2018, including police officers: 841 (737 officers - 603 male; 134 female).
| Officers per 1,000 residents here: | 3.21 |
| Virginia average: | 2.26 |
Full-time law enforcement employees in 2017, including police officers: 835 (695 officers - 578 male; 117 female).
| Officers per 1,000 residents here: | 3.07 |
| Virginia average: | 2.25 |
Full-time law enforcement employees in 2016, including police officers: 802 (680 officers - 569 male; 111 female).
| Officers per 1,000 residents here: | 3.06 |
| Virginia average: | 2.25 |
Full-time law enforcement employees in 2015, including police officers: 885 (732 officers - 617 male; 115 female).
| Officers per 1,000 residents here: | 3.32 |
| Virginia average: | 2.26 |
Full-time law enforcement employees in 2014, including police officers: 816 (692 officers - 583 male; 109 female).
| Officers per 1,000 residents here: | 3.19 |
| Virginia average: | 2.27 |
Full-time law enforcement employees in 2013, including police officers: 866 (703 officers - 592 male; 111 female).
| Officers per 1,000 residents here: | 3.30 |
| Virginia average: | 2.27 |
Full-time law enforcement employees in 2012, including police officers: 940 (719 officers - 604 male; 115 female).
| Officers per 1,000 residents here: | 3.46 |
| Virginia average: | 2.27 |
Full-time law enforcement employees in 2011, including police officers: 885 (727 officers - 616 male; 111 female).
| Officers per 1,000 residents here: | 3.52 |
| Virginia average: | 2.28 |
Full-time law enforcement employees in 2010, including police officers: 893 (729 officers - 622 male; 107 female).
| Officers per 1,000 residents here: | 3.57 |
| Virginia average: | 2.30 |
Full-time law enforcement employees in 2009, including police officers: 872 (724 officers - 618 male; 106 female).
| Officers per 1,000 residents here: | 3.56 |
| Virginia average: | 2.32 |
Full-time law enforcement employees in 2008, including police officers: 1,012 (733 officers - 619 male; 114 female).
| Officers per 1,000 residents here: | 3.67 |
| Virginia average: | 2.38 |
Full-time law enforcement employees in 2007, including police officers: 930 (702 officers - 605 male; 97 female).
| Officers per 1,000 residents here: | 3.66 |
| Virginia average: | 2.34 |
Full-time law enforcement employees in 2006, including police officers: 923 (690 officers - 591 male; 99 female).
| Officers per 1,000 residents here: | 3.53 |
| Virginia average: | 2.31 |
Full-time law enforcement employees in 2005, including police officers: 890 (696 officers - 620 male; 76 female).
| Officers per 1,000 residents here: | 3.56 |
| Virginia average: | 2.29 |
Full-time law enforcement employees in 2004, including police officers: 873 (678 officers - 582 male; 96 female).
| Officers per 1,000 residents here: | 3.45 |
| Virginia average: | 2.28 |
Full-time law enforcement employees in 2003, including police officers: 765 (632 officers - 538 male; 94 female).
| Officers per 1,000 residents here: | 3.16 |
| Virginia average: | 2.27 |