Crime rate in Rock Hill, South Carolina (SC): murders, rapes, robberies, assaults, burglaries, thefts, auto thefts, arson, law enforcement employees, police officers, crime map
Crime rate in Rock Hill, SC
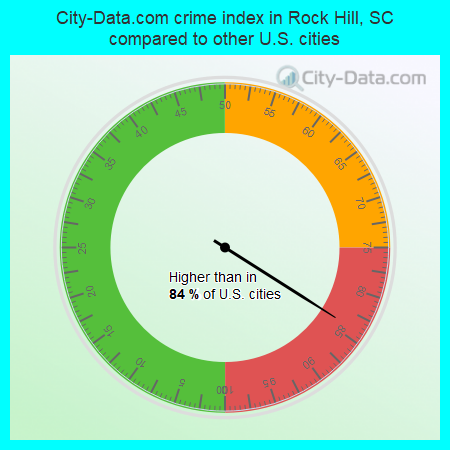
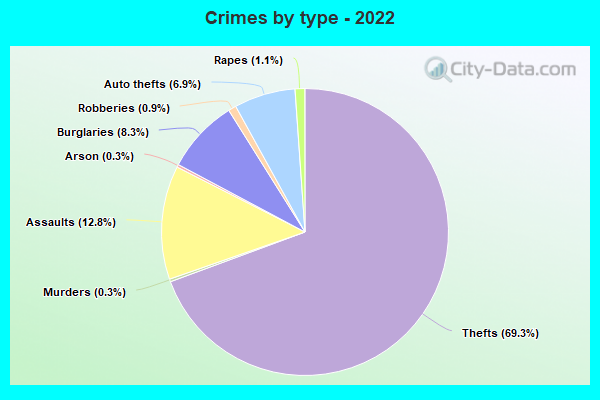
The 2022 crime rate in Rock Hill, SC is 262 (City-Data.com crime index), which is comparable to the U.S. average. It was higher than in 84.0% U.S. cities. The 2022 Rock Hill crime rate fell by 12% compared to 2021. The number of homicides stood at 8 - a decrease of 5 compared to 2021. In the last 5 years Rock Hill has seen decline of violent crime and decreasing property crime.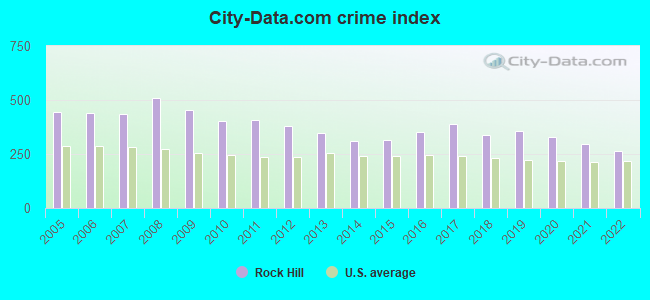
The City-Data.com crime index weighs serious crimes and violent crimes more heavily. Higher means more crime, U.S. average is 246.1. It adjusts for the number of visitors and daily workers commuting into cities.
- means the value is smaller than the state average.- means the value is about the same as the state average.
- means the value is bigger than the state average.
- means the value is much bigger than the state average.
According to our research of South Carolina and other state lists, there were 58 registered sex offenders living in Rock Hill, South Carolina as of April 28, 2024.
The ratio of all residents to sex offenders in Rock Hill is 1,275 to 1.
The ratio of registered sex offenders to all residents in this city is near the state average.
Violent crime rate in 2022
| Rock Hill: | 272.8 |
| U.S. Average: | 219.8 |
Violent crime rate in 2021
| Rock Hill: | 357.5 |
| U.S. Average: | 224.8 |
Violent crime rate in 2020
| Rock Hill: | 395.3 |
| U.S. Average: | 228.2 |
Violent crime rate in 2019
| Rock Hill: | 381.6 |
| U.S. Average: | 219.9 |
Violent crime rate in 2018
| Rock Hill: | 294.4 |
| U.S. Average: | 221.2 |
Violent crime rate in 2017
| Rock Hill: | 372.0 |
| U.S. Average: | 226.2 |
Violent crime rate in 2016
| Rock Hill: | 358.2 |
| U.S. Average: | 227.3 |
Violent crime rate in 2015
| Rock Hill: | 317.5 |
| U.S. Average: | 219.3 |
Violent crime rate in 2014
| Rock Hill: | 292.5 |
| U.S. Average: | 211.1 |
Violent crime rate in 2013
| Rock Hill: | 317.0 |
| U.S. Average: | 214.2 |
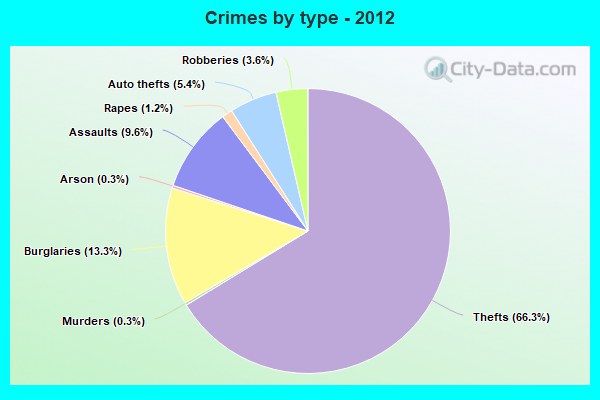
Violent crime rate in 2012
| Rock Hill: | 370.2 |
| U.S. Average: | 187.4 |
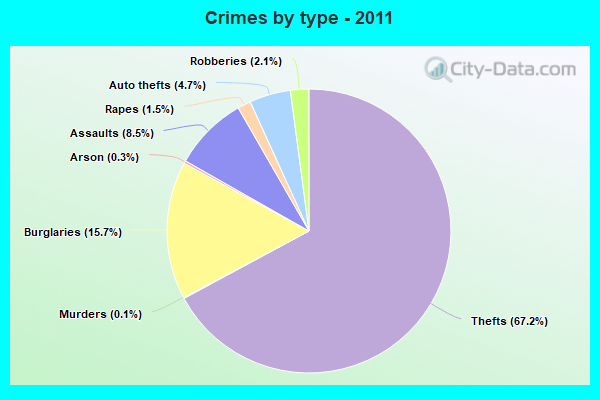
Violent crime rate in 2011
| Rock Hill: | 359.4 |
| U.S. Average: | 187.1 |
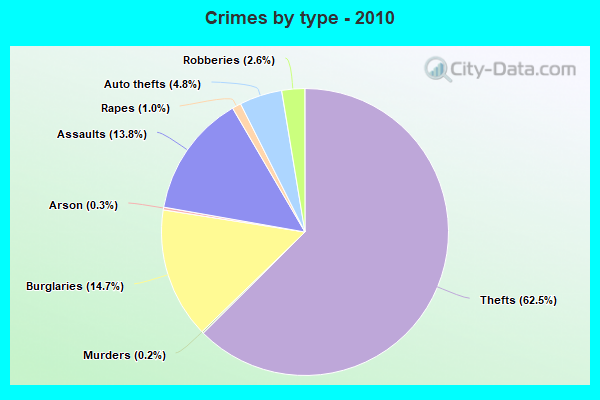
Violent crime rate in 2010
| Rock Hill: | 445.9 |
| U.S. Average: | 195.7 |
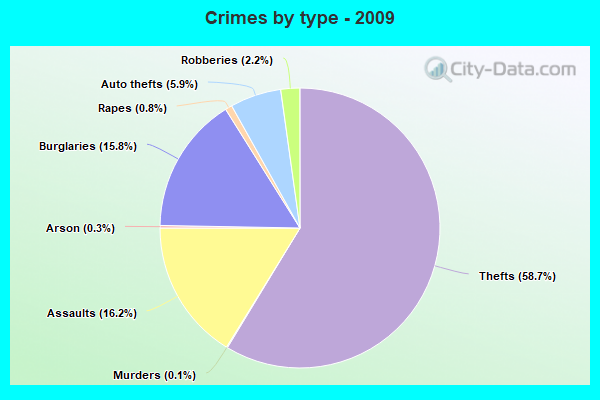
Violent crime rate in 2009
| Rock Hill: | 536.6 |
| U.S. Average: | 208.9 |
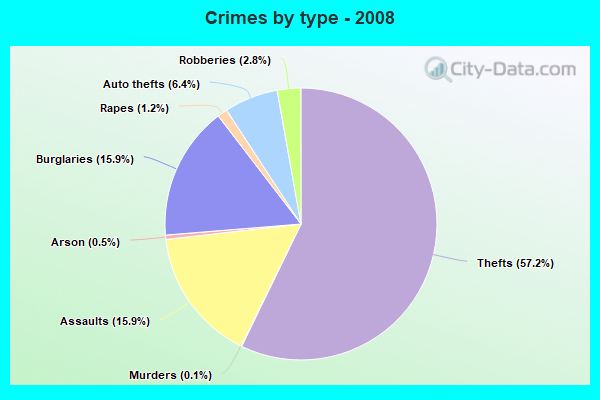
Violent crime rate in 2008
| Rock Hill: | 600.1 |
| U.S. Average: | 222.5 |
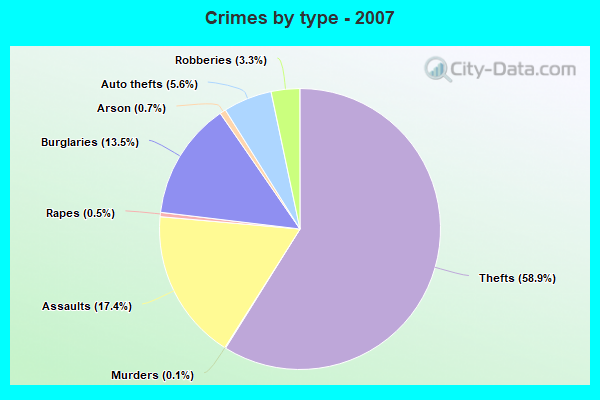
Violent crime rate in 2007
| Rock Hill: | 541.7 |
| U.S. Average: | 229.1 |
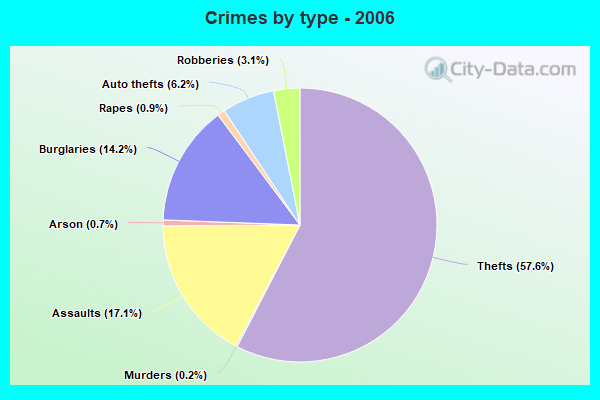
Violent crime rate in 2006
| Rock Hill: | 544.5 |
| U.S. Average: | 232.6 |
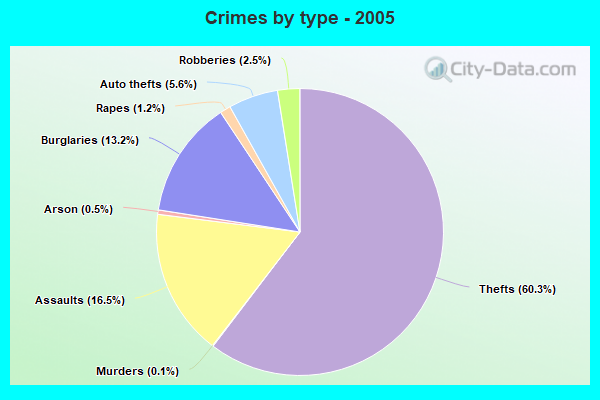
Violent crime rate in 2005
| Rock Hill: | 540.7 |
| U.S. Average: | 227.0 |
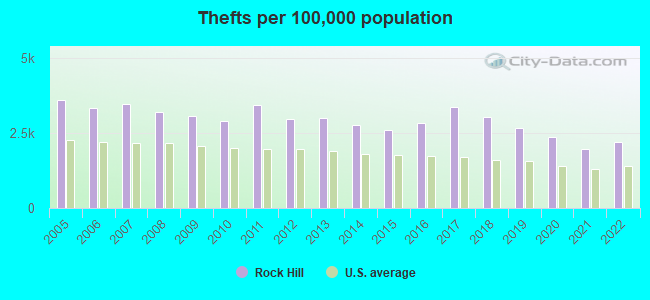
Property crime rate in 2022
| Rock Hill: | 195.3 |
| U.S. Average: | 166.5 |
Property crime rate in 2021
| Rock Hill: | 168.9 |
| U.S. Average: | 157.8 |
Property crime rate in 2020
| Rock Hill: | 202.8 |
| U.S. Average: | 169.6 |
Property crime rate in 2019
| Rock Hill: | 257.4 |
| U.S. Average: | 179.7 |
Property crime rate in 2018
| Rock Hill: | 282.4 |
| U.S. Average: | 190.2 |
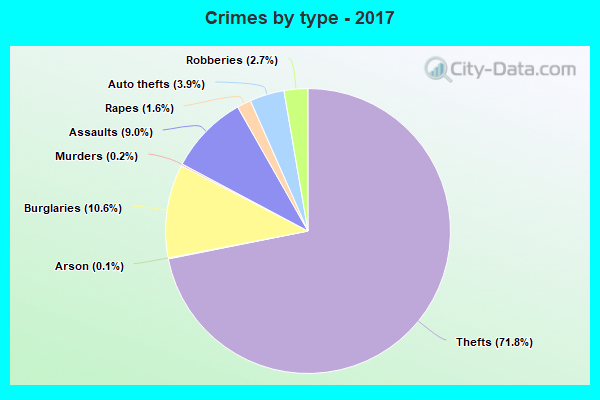
Property crime rate in 2017
| Rock Hill: | 295.7 |
| U.S. Average: | 206.4 |
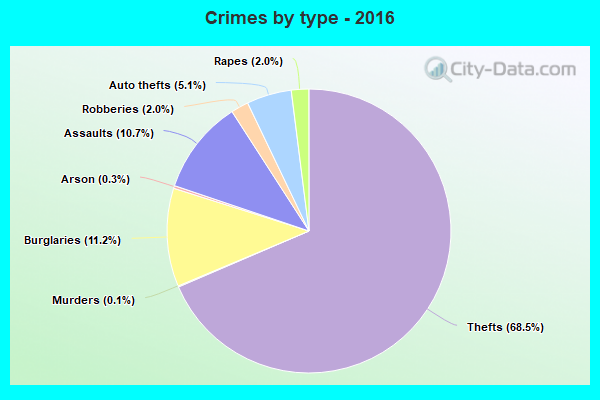
Property crime rate in 2016
| Rock Hill: | 266.0 |
| U.S. Average: | 216.6 |
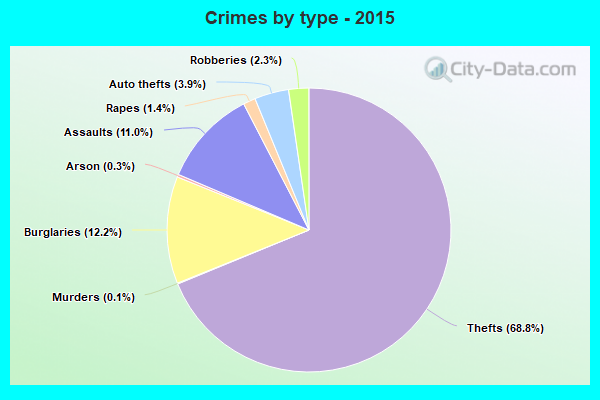
Property crime rate in 2015
| Rock Hill: | 246.0 |
| U.S. Average: | 221.5 |
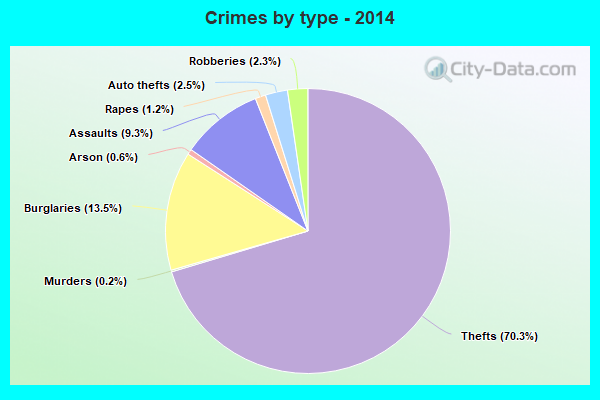
Property crime rate in 2014
| Rock Hill: | 259.8 |
| U.S. Average: | 230.8 |
Property crime rate in 2013
| Rock Hill: | 292.7 |
| U.S. Average: | 250.4 |
Property crime rate in 2012
| Rock Hill: | 303.6 |
| U.S. Average: | 267.3 |
Property crime rate in 2011
| Rock Hill: | 368.6 |
| U.S. Average: | 273.5 |
Property crime rate in 2010
| Rock Hill: | 315.2 |
| U.S. Average: | 276.4 |
Property crime rate in 2009
| Rock Hill: | 367.1 |
| U.S. Average: | 285.6 |
Property crime rate in 2008
| Rock Hill: | 391.9 |
| U.S. Average: | 302.2 |
Property crime rate in 2007
| Rock Hill: | 316.6 |
| U.S. Average: | 309.2 |
Property crime rate in 2006
| Rock Hill: | 317.7 |
| U.S. Average: | 317.3 |
Property crime rate in 2005
| Rock Hill: | 321.5 |
| U.S. Average: | 322.3 |
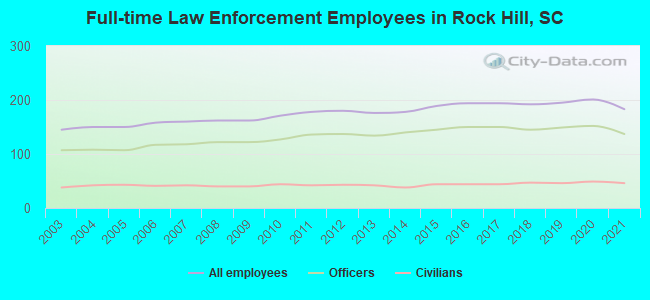
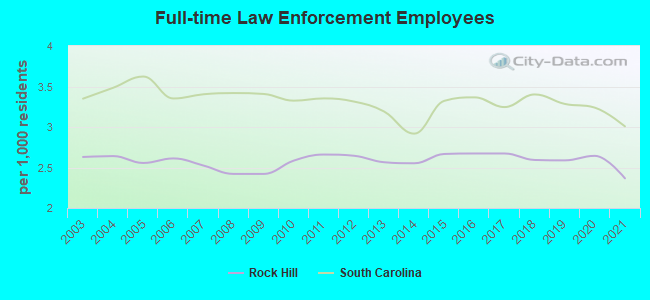
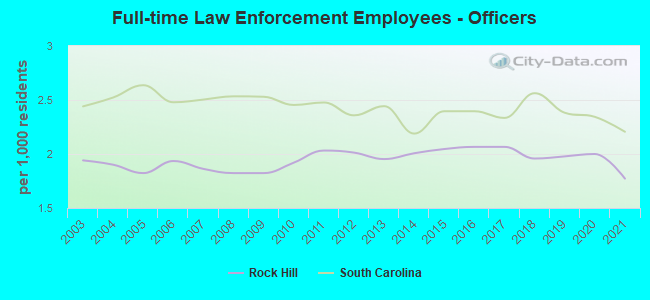
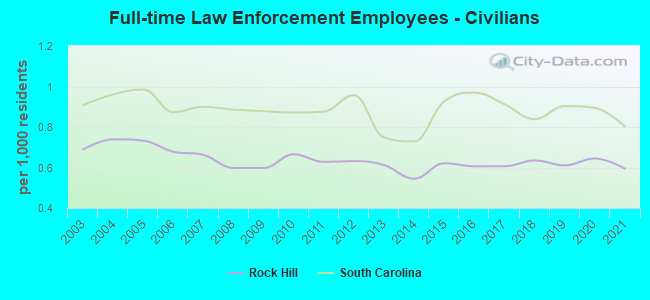
Full-time law enforcement employees in 2021, including police officers: 183 (137 officers - 111 male; 26 female).
| Officers per 1,000 residents here: | 1.77 |
| South Carolina average: | 2.21 |
Full-time law enforcement employees in 2020, including police officers: 201 (152 officers - 126 male; 26 female).
| Officers per 1,000 residents here: | 2.00 |
| South Carolina average: | 2.34 |
Full-time law enforcement employees in 2019, including police officers: 195 (149 officers - 125 male; 24 female).
| Officers per 1,000 residents here: | 1.98 |
| South Carolina average: | 2.38 |
Full-time law enforcement employees in 2018, including police officers: 192 (145 officers - 128 male; 17 female).
| Officers per 1,000 residents here: | 1.96 |
| South Carolina average: | 2.56 |
Full-time law enforcement employees in 2016, including police officers: 194 (150 officers - 133 male; 17 female).
| Officers per 1,000 residents here: | 2.07 |
| South Carolina average: | 2.40 |
Full-time law enforcement employees in 2015, including police officers: 189 (145 officers - 129 male; 16 female).
| Officers per 1,000 residents here: | 2.05 |
| South Carolina average: | 2.40 |
Full-time law enforcement employees in 2014, including police officers: 178 (140 officers - 128 male; 12 female).
| Officers per 1,000 residents here: | 2.01 |
| South Carolina average: | 2.19 |
Full-time law enforcement employees in 2013, including police officers: 176 (134 officers - 124 male; 10 female).
| Officers per 1,000 residents here: | 1.95 |
| South Carolina average: | 2.44 |
Full-time law enforcement employees in 2012, including police officers: 180 (137 officers - 125 male; 12 female).
| Officers per 1,000 residents here: | 2.01 |
| South Carolina average: | 2.36 |
Full-time law enforcement employees in 2011, including police officers: 178 (136 officers - 123 male; 13 female).
| Officers per 1,000 residents here: | 2.03 |
| South Carolina average: | 2.48 |
Full-time law enforcement employees in 2010, including police officers: 171 (127 officers - 113 male; 14 female).
| Officers per 1,000 residents here: | 1.92 |
| South Carolina average: | 2.45 |
Full-time law enforcement employees in 2008, including police officers: 162 (122 officers - 108 male; 14 female).
| Officers per 1,000 residents here: | 1.82 |
| South Carolina average: | 2.53 |
Full-time law enforcement employees in 2007, including police officers: 160 (118 officers - 103 male; 15 female).
| Officers per 1,000 residents here: | 1.86 |
| South Carolina average: | 2.50 |
Full-time law enforcement employees in 2006, including police officers: 158 (117 officers - 104 male; 13 female).
| Officers per 1,000 residents here: | 1.93 |
| South Carolina average: | 2.48 |
Full-time law enforcement employees in 2005, including police officers: 150 (107 officers - 93 male; 14 female).
| Officers per 1,000 residents here: | 1.82 |
| South Carolina average: | 2.64 |
Full-time law enforcement employees in 2004, including police officers: 150 (108 officers - 97 male; 11 female).
| Officers per 1,000 residents here: | 1.90 |
| South Carolina average: | 2.52 |
Full-time law enforcement employees in 2003, including police officers: 145 (107 officers - 95 male; 12 female).
| Officers per 1,000 residents here: | 1.94 |
| South Carolina average: | 2.44 |

Zip codes: 29733.