Crime rate in Santa Ana, California (CA): murders, rapes, robberies, assaults, burglaries, thefts, auto thefts, arson, law enforcement employees, police officers, crime map
Crime rate in Santa Ana, CA
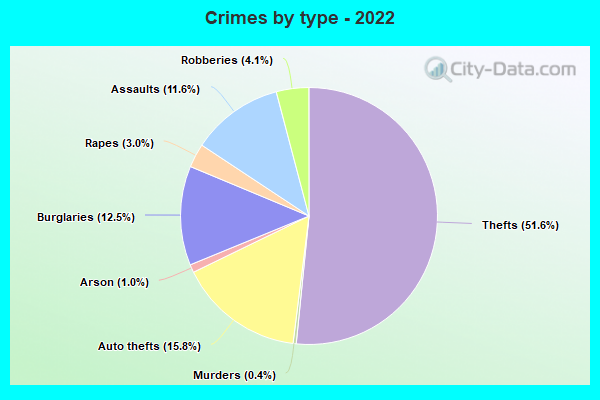
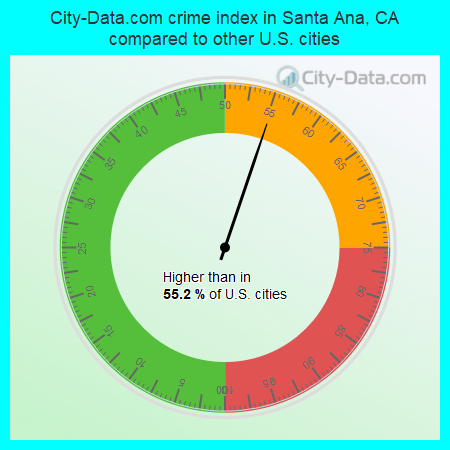
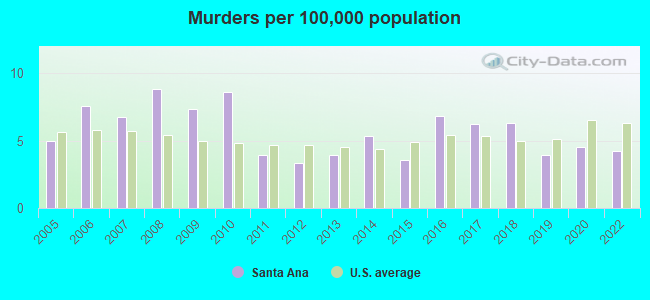
The 2022 crime rate in Santa Ana, CA is 115 (City-Data.com crime index), which is 2.1 times lower than the U.S. average. It was higher than in 55.2% U.S. cities. The 2022 Santa Ana crime rate fell by 53% compared to 2020. The number of homicides stood at 13 - a decrease of 2 compared to 2020. In the last 5 years Santa Ana has seen decreasing violent crime and decline of property crime.See how dangerous Santa Ana, CA is compared to the nearest cities:
(Note: Higher means more crime)
(Note: Higher means more crime)
| Santa Ana: | 115.0 |
| Tustin: | 208.4 |
| Fountain Valley: | 154.6 |
| Orange: | 124.8 |
| Garden Grove: | 207.0 |
| Costa Mesa: | 339.2 |
| Irvine: | 96.3 |
| Westminster: | 270.2 |
| Villa Park: | 54.3 |
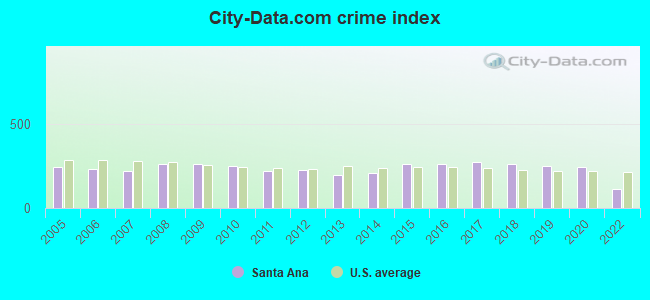
The City-Data.com crime index weighs serious crimes and violent crimes more heavily. Higher means more crime, U.S. average is 246.1. It adjusts for the number of visitors and daily workers commuting into cities.
- means the value is smaller than the state average.- means the value is about the same as the state average.
- means the value is bigger than the state average.
- means the value is much bigger than the state average.
According to our research of California and other state lists, there were 414 registered sex offenders living in Santa Ana, California as of April 27, 2024.
The ratio of all residents to sex offenders in Santa Ana is 807 to 1.
The ratio of registered sex offenders to all residents in this city is near the state average.
Violent crime rate in 2022
| Santa Ana: | 122.3 |
| U.S. Average: | 219.8 |
Violent crime rate in 2020
| Santa Ana: | 243.0 |
| U.S. Average: | 228.2 |
Violent crime rate in 2019
| Santa Ana: | 254.6 |
| U.S. Average: | 219.9 |
Violent crime rate in 2018
| Santa Ana: | 277.9 |
| U.S. Average: | 221.2 |
Violent crime rate in 2017
| Santa Ana: | 281.7 |
| U.S. Average: | 226.2 |
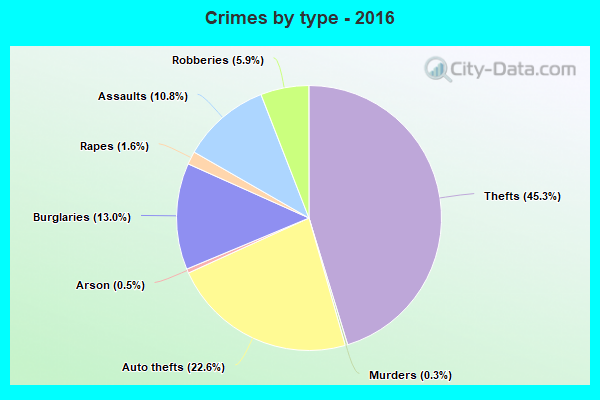
Violent crime rate in 2016
| Santa Ana: | 270.1 |
| U.S. Average: | 227.3 |
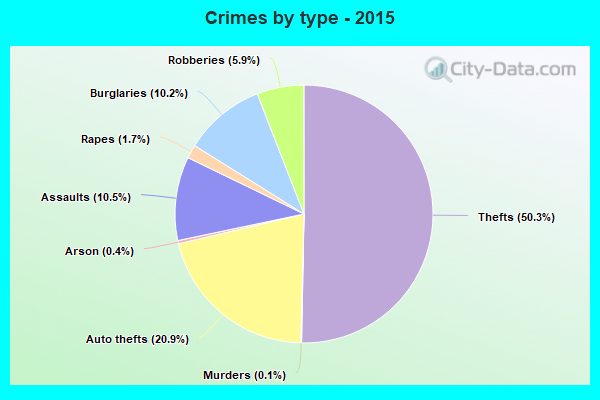
Violent crime rate in 2015
| Santa Ana: | 269.2 |
| U.S. Average: | 219.3 |
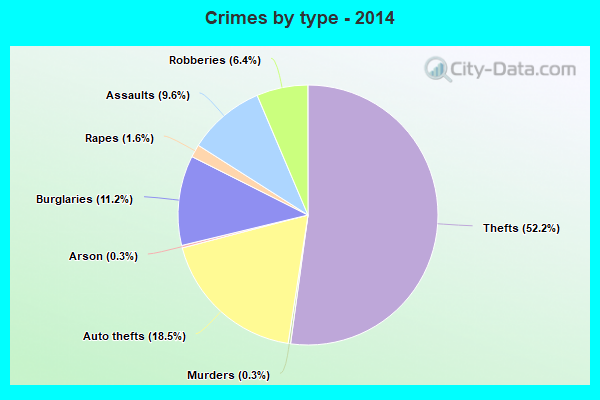
Violent crime rate in 2014
| Santa Ana: | 212.4 |
| U.S. Average: | 211.1 |
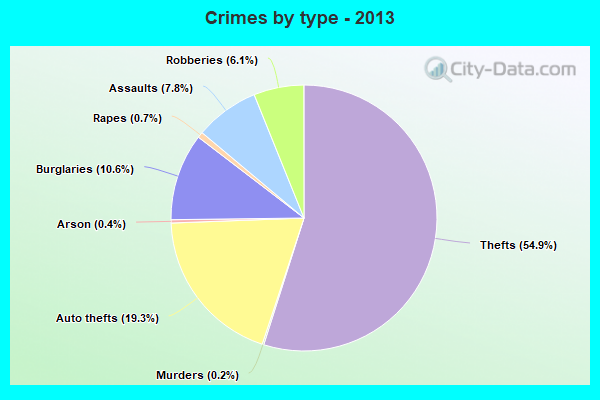
Violent crime rate in 2013
| Santa Ana: | 181.9 |
| U.S. Average: | 214.2 |
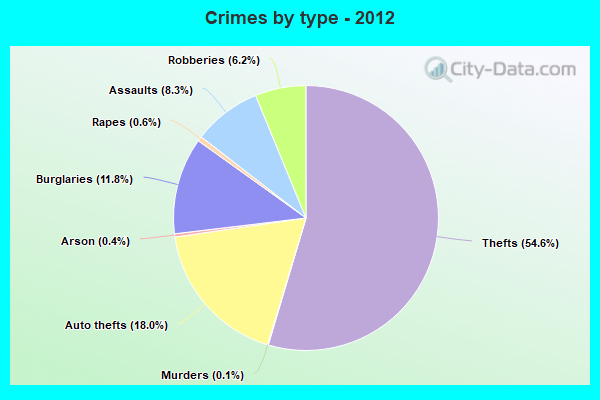
Violent crime rate in 2012
| Santa Ana: | 213.8 |
| U.S. Average: | 187.4 |
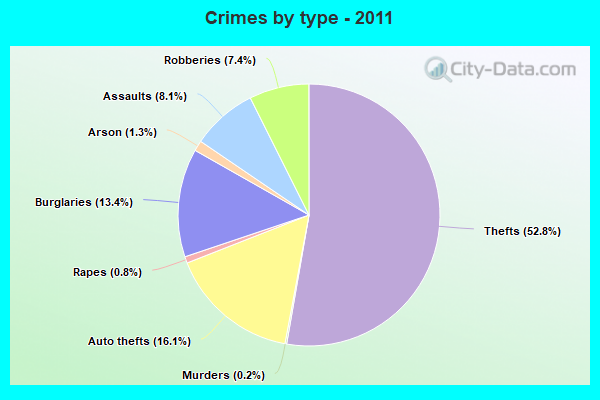
Violent crime rate in 2011
| Santa Ana: | 215.3 |
| U.S. Average: | 187.1 |
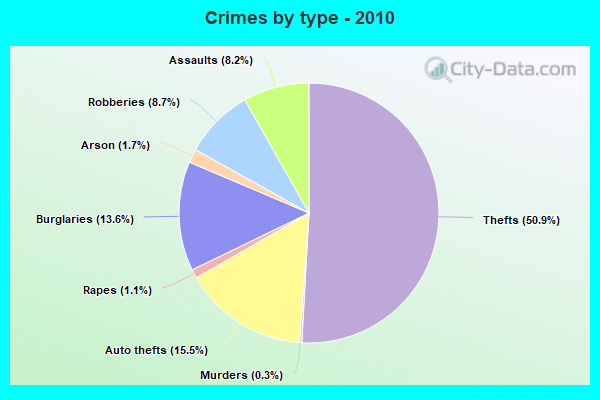
Violent crime rate in 2010
| Santa Ana: | 259.1 |
| U.S. Average: | 195.7 |
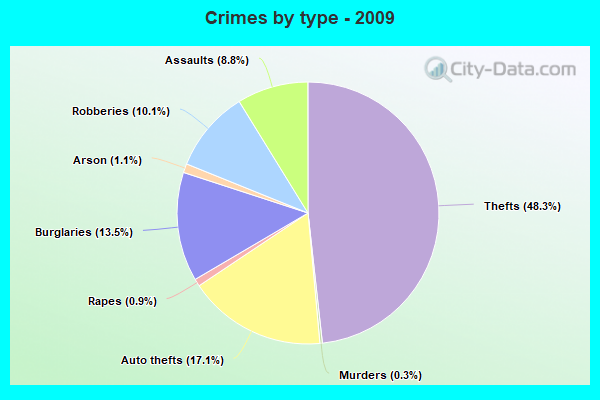
Violent crime rate in 2009
| Santa Ana: | 276.8 |
| U.S. Average: | 208.9 |
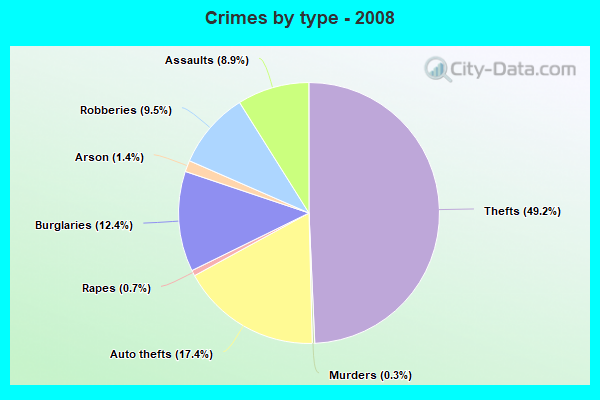
Violent crime rate in 2008
| Santa Ana: | 277.0 |
| U.S. Average: | 222.5 |
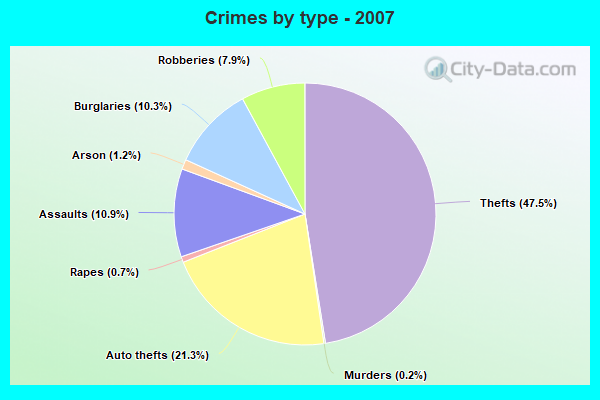
Violent crime rate in 2007
| Santa Ana: | 235.3 |
| U.S. Average: | 229.1 |
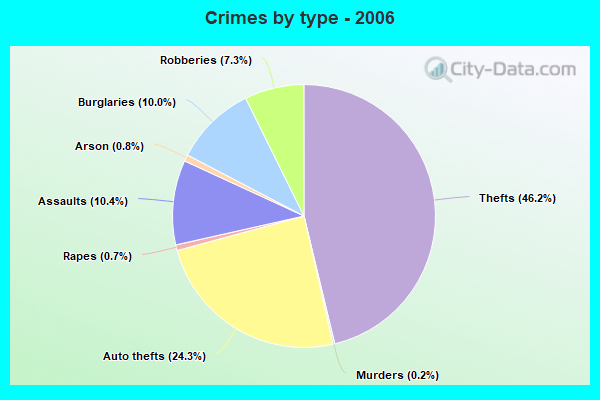
Violent crime rate in 2006
| Santa Ana: | 240.7 |
| U.S. Average: | 232.6 |
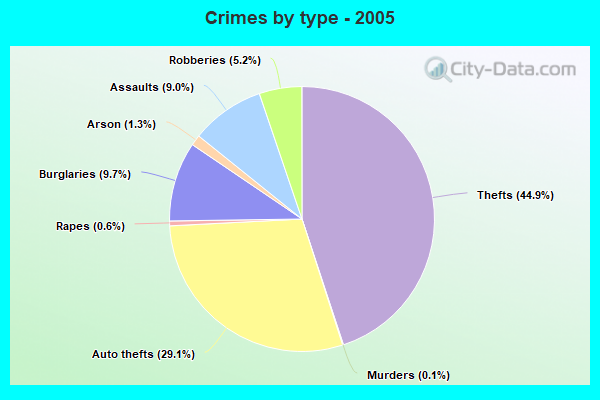
Violent crime rate in 2005
| Santa Ana: | 219.7 |
| U.S. Average: | 227.0 |
Property crime rate in 2022
| Santa Ana: | 78.2 |
| U.S. Average: | 166.5 |
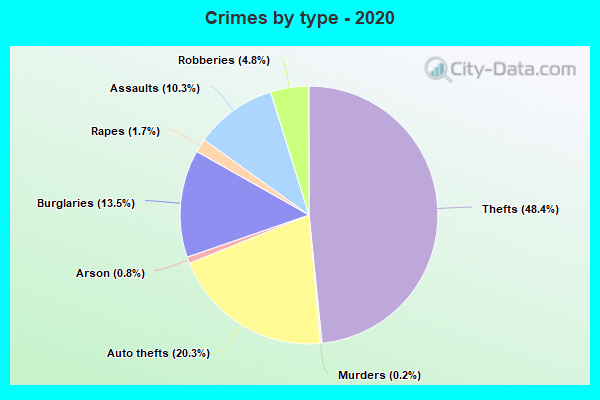
Property crime rate in 2020
| Santa Ana: | 206.5 |
| U.S. Average: | 169.6 |
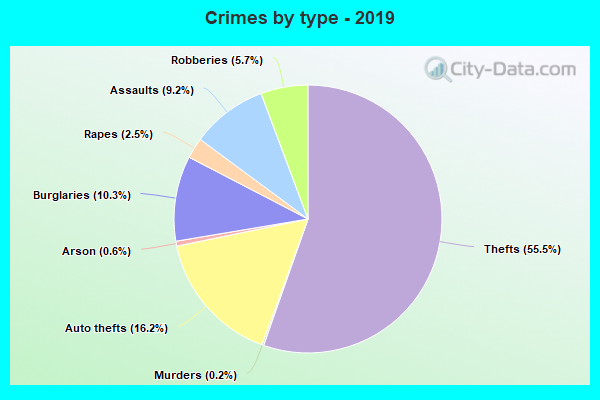
Property crime rate in 2019
| Santa Ana: | 180.7 |
| U.S. Average: | 179.7 |
Property crime rate in 2018
| Santa Ana: | 182.1 |
| U.S. Average: | 190.2 |
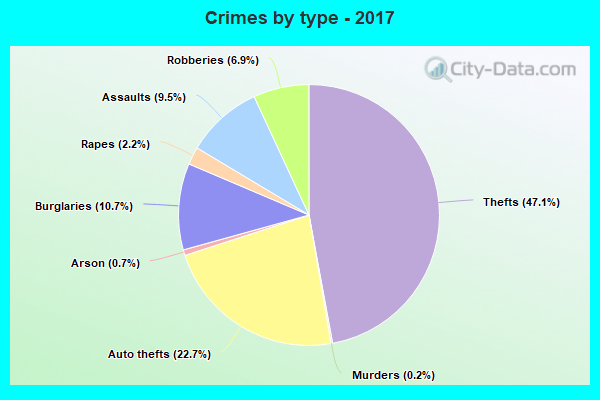
Property crime rate in 2017
| Santa Ana: | 205.0 |
| U.S. Average: | 206.4 |
Property crime rate in 2016
| Santa Ana: | 210.9 |
| U.S. Average: | 216.6 |
Property crime rate in 2015
| Santa Ana: | 203.5 |
| U.S. Average: | 221.5 |
Property crime rate in 2014
| Santa Ana: | 160.1 |
| U.S. Average: | 230.8 |
Property crime rate in 2013
| Santa Ana: | 176.5 |
| U.S. Average: | 250.4 |
Property crime rate in 2012
| Santa Ana: | 205.1 |
| U.S. Average: | 267.3 |
Property crime rate in 2011
| Santa Ana: | 188.0 |
| U.S. Average: | 273.5 |
Property crime rate in 2010
| Santa Ana: | 192.2 |
| U.S. Average: | 276.4 |
Property crime rate in 2009
| Santa Ana: | 194.9 |
| U.S. Average: | 285.6 |
Property crime rate in 2008
| Santa Ana: | 196.4 |
| U.S. Average: | 302.2 |
Property crime rate in 2007
| Santa Ana: | 170.0 |
| U.S. Average: | 309.2 |
Property crime rate in 2006
| Santa Ana: | 191.0 |
| U.S. Average: | 317.3 |
Property crime rate in 2005
| Santa Ana: | 234.6 |
| U.S. Average: | 322.3 |
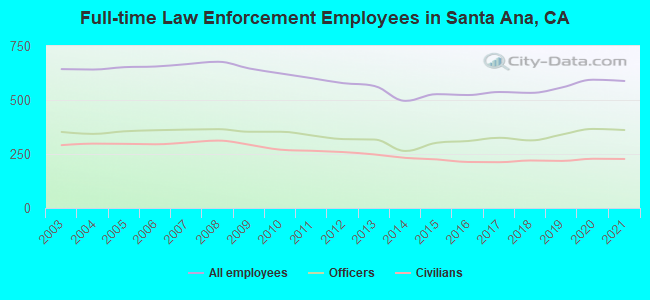
Full-time law enforcement employees in 2021, including police officers: 588 (361 officers - 326 male; 35 female).
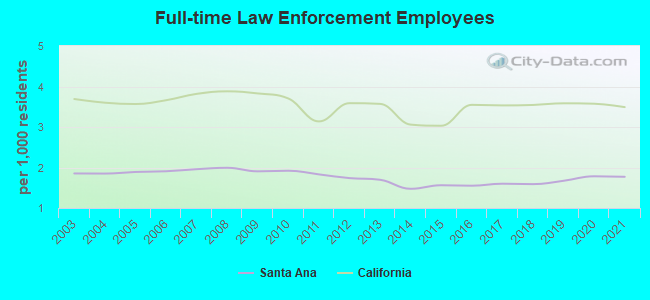
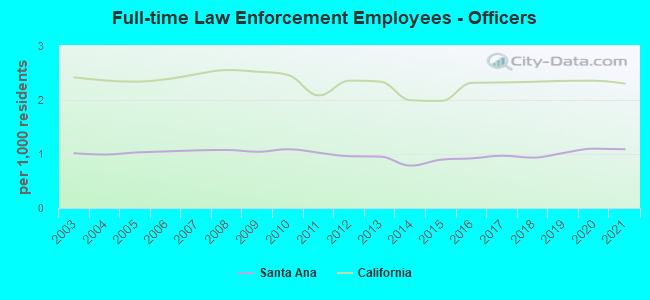
| Officers per 1,000 residents here: | 1.09 |
| California average: | 2.30 |
Full-time law enforcement employees in 2020, including police officers: 594 (366 officers - 332 male; 34 female).
| Officers per 1,000 residents here: | 1.10 |
| California average: | 2.36 |
Full-time law enforcement employees in 2019, including police officers: 558 (340 officers - 308 male; 32 female).
| Officers per 1,000 residents here: | 1.02 |
| California average: | 2.35 |
Full-time law enforcement employees in 2018, including police officers: 533 (313 officers - 285 male; 28 female).
| Officers per 1,000 residents here: | 0.93 |
| California average: | 2.34 |
Full-time law enforcement employees in 2017, including police officers: 537 (325 officers - 298 male; 27 female).
| Officers per 1,000 residents here: | 0.97 |
| California average: | 2.32 |
Full-time law enforcement employees in 2016, including police officers: 523 (310 officers - 284 male; 26 female).
| Officers per 1,000 residents here: | 0.92 |
| California average: | 2.32 |
Full-time law enforcement employees in 2015, including police officers: 527 (302 officers - 276 male; 26 female).
| Officers per 1,000 residents here: | 0.90 |
| California average: | 1.98 |
Full-time law enforcement employees in 2014, including police officers: 496 (264 officers - 241 male; 23 female).
| Officers per 1,000 residents here: | 0.78 |
| California average: | 2.00 |
Full-time law enforcement employees in 2013, including police officers: 565 (317 officers - 288 male; 29 female).
| Officers per 1,000 residents here: | 0.95 |
| California average: | 2.34 |
Full-time law enforcement employees in 2012, including police officers: 578 (319 officers - 289 male; 30 female).
| Officers per 1,000 residents here: | 0.96 |
| California average: | 2.36 |
Full-time law enforcement employees in 2011, including police officers: 601 (336 officers - 306 male; 30 female).
| Officers per 1,000 residents here: | 1.02 |
| California average: | 2.09 |
Full-time law enforcement employees in 2010, including police officers: 623 (353 officers - 322 male; 31 female).
| Officers per 1,000 residents here: | 1.09 |
| California average: | 2.46 |
Full-time law enforcement employees in 2009, including police officers: 646 (353 officers - 324 male; 29 female).
| Officers per 1,000 residents here: | 1.04 |
| California average: | 2.52 |
Full-time law enforcement employees in 2008, including police officers: 677 (365 officers - 335 male; 30 female).
| Officers per 1,000 residents here: | 1.07 |
| California average: | 2.55 |
Full-time law enforcement employees in 2007, including police officers: 666 (363 officers - 336 male; 27 female).
| Officers per 1,000 residents here: | 1.07 |
| California average: | 2.48 |
Full-time law enforcement employees in 2006, including police officers: 655 (360 officers - 334 male; 26 female).
| Officers per 1,000 residents here: | 1.05 |
| California average: | 2.38 |
Full-time law enforcement employees in 2005, including police officers: 652 (355 officers - 331 male; 24 female).
| Officers per 1,000 residents here: | 1.03 |
| California average: | 2.34 |
Full-time law enforcement employees in 2004, including police officers: 641 (343 officers - 322 male; 21 female).
| Officers per 1,000 residents here: | 0.99 |
| California average: | 2.36 |
Full-time law enforcement employees in 2003, including police officers: 643 (352 officers - 330 male; 22 female).
| Officers per 1,000 residents here: | 1.01 |
| California average: | 2.42 |