Crime rate in Springfield, Missouri (MO): murders, rapes, robberies, assaults, burglaries, thefts, auto thefts, arson, law enforcement employees, police officers, crime map
Crime rate in Springfield, MO
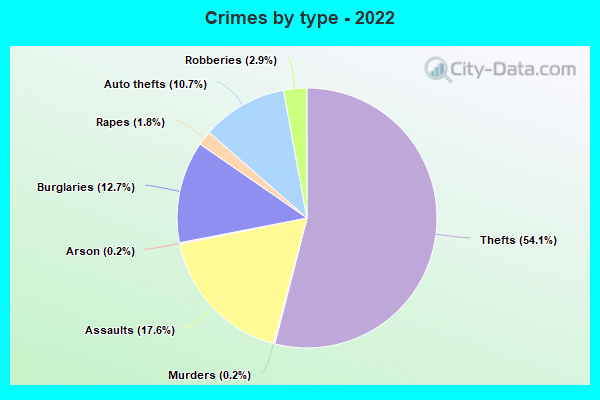
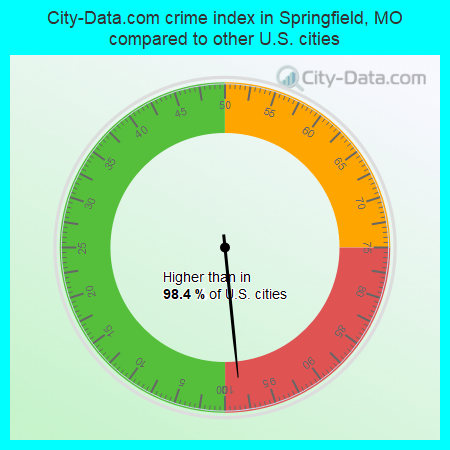
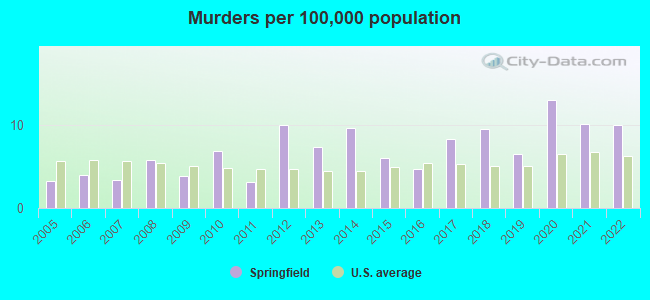
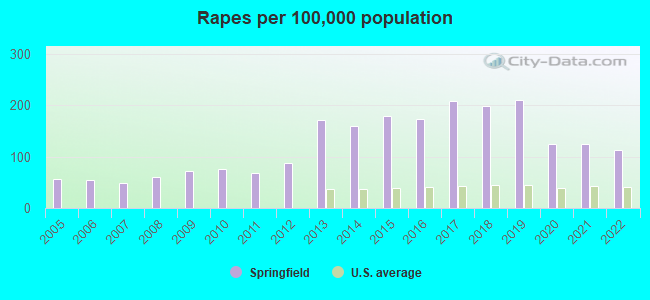
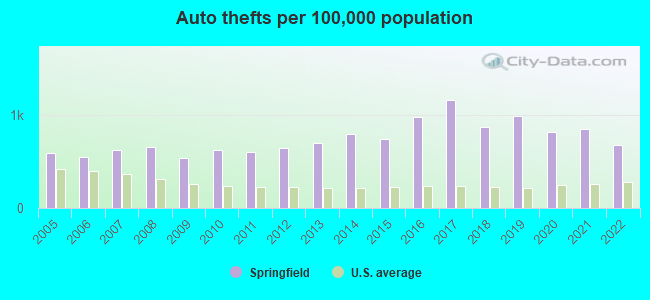
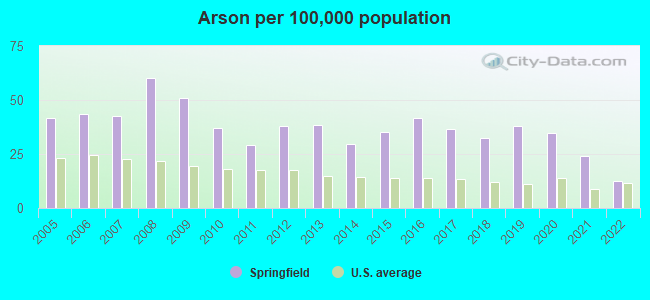
The 2022 crime rate in Springfield, MO is 635 (City-Data.com crime index), which is 2.6 times higher than the U.S. average. It was higher than in 98.4% U.S. cities. The 2022 Springfield crime rate fell by 15% compared to 2021. The number of homicides stood at 17. In the last 5 years Springfield has seen rise of violent crime and decreasing property crime.See how dangerous Springfield, MO is compared to the nearest cities:
(Note: Higher means more crime)
(Note: Higher means more crime)
| Springfield: | 634.5 |
| Battlefield: | 75.5 |
| Willard: | 91.9 |
| Nixa: | 66.3 |
| Strafford: | 180.4 |
| Republic: | 66.0 |
| Ozark: | 110.9 |
| Rogersville: | 136.2 |
| Fair Grove: | 4.3 |
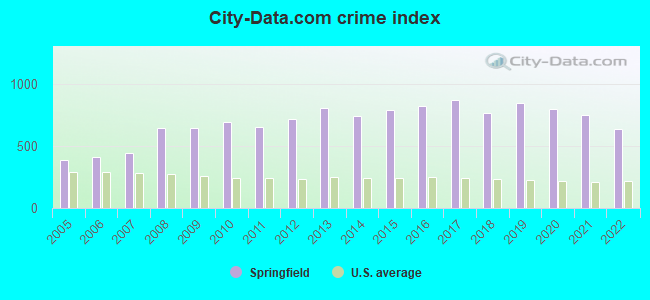
The City-Data.com crime index weighs serious crimes and violent crimes more heavily. Higher means more crime, U.S. average is 246.1. It adjusts for the number of visitors and daily workers commuting into cities.
- means the value is smaller than the state average.- means the value is about the same as the state average.
- means the value is bigger than the state average.
- means the value is much bigger than the state average.
According to our research of Missouri and other state lists, there were 857 registered sex offenders living in Springfield, Missouri as of April 26, 2024.
The ratio of all residents to sex offenders in Springfield is 195 to 1.
Violent crime rate in 2022
| Springfield: | 779.9 |
| U.S. Average: | 219.8 |
Violent crime rate in 2021
| Springfield: | 866.9 |
| U.S. Average: | 224.8 |
Violent crime rate in 2020
| Springfield: | 873.2 |
| U.S. Average: | 228.2 |
Violent crime rate in 2019
| Springfield: | 874.5 |
| U.S. Average: | 219.9 |
Violent crime rate in 2018
| Springfield: | 771.0 |
| U.S. Average: | 221.2 |
Violent crime rate in 2017
| Springfield: | 786.2 |
| U.S. Average: | 226.2 |
Violent crime rate in 2016
| Springfield: | 762.9 |
| U.S. Average: | 227.3 |
Violent crime rate in 2015
| Springfield: | 776.1 |
| U.S. Average: | 219.3 |
Violent crime rate in 2014
| Springfield: | 687.9 |
| U.S. Average: | 211.1 |
Violent crime rate in 2013
| Springfield: | 678.0 |
| U.S. Average: | 214.2 |
Violent crime rate in 2012
| Springfield: | 554.5 |
| U.S. Average: | 187.4 |
Violent crime rate in 2011
| Springfield: | 447.0 |
| U.S. Average: | 187.1 |
Violent crime rate in 2010
| Springfield: | 464.3 |
| U.S. Average: | 195.7 |
Violent crime rate in 2009
| Springfield: | 423.5 |
| U.S. Average: | 208.9 |
Violent crime rate in 2008
| Springfield: | 383.6 |
| U.S. Average: | 222.5 |
Violent crime rate in 2007
| Springfield: | 260.6 |
| U.S. Average: | 229.1 |
Violent crime rate in 2006
| Springfield: | 250.6 |
| U.S. Average: | 232.6 |
Violent crime rate in 2005
| Springfield: | 225.1 |
| U.S. Average: | 227.0 |
Property crime rate in 2022
| Springfield: | 433.9 |
| U.S. Average: | 166.5 |
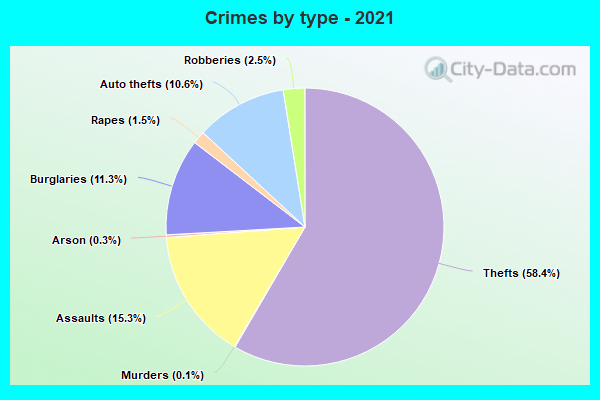
Property crime rate in 2021
| Springfield: | 547.9 |
| U.S. Average: | 157.8 |
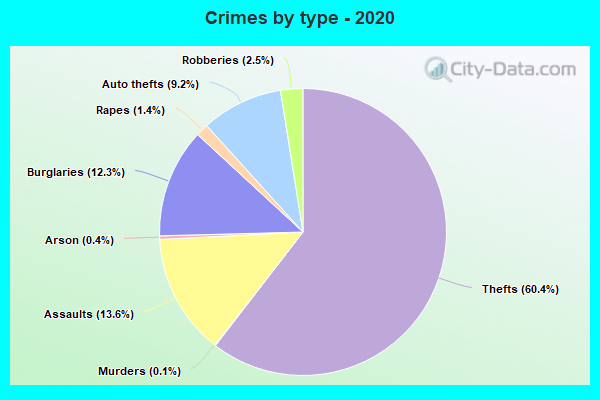
Property crime rate in 2020
| Springfield: | 614.5 |
| U.S. Average: | 169.6 |
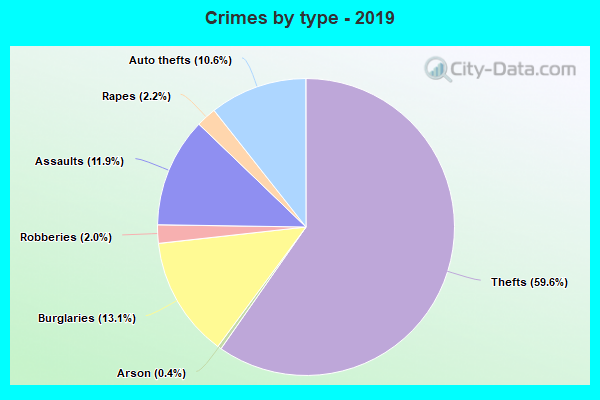
Property crime rate in 2019
| Springfield: | 672.4 |
| U.S. Average: | 179.7 |
Property crime rate in 2018
| Springfield: | 614.0 |
| U.S. Average: | 190.2 |
Property crime rate in 2017
| Springfield: | 758.3 |
| U.S. Average: | 206.4 |
Property crime rate in 2016
| Springfield: | 710.2 |
| U.S. Average: | 216.6 |
Property crime rate in 2015
| Springfield: | 640.6 |
| U.S. Average: | 221.5 |
Property crime rate in 2014
| Springfield: | 626.5 |
| U.S. Average: | 230.8 |
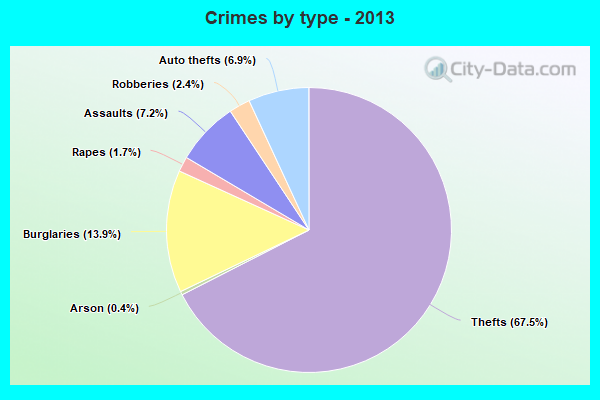
Property crime rate in 2013
| Springfield: | 733.5 |
| U.S. Average: | 250.4 |
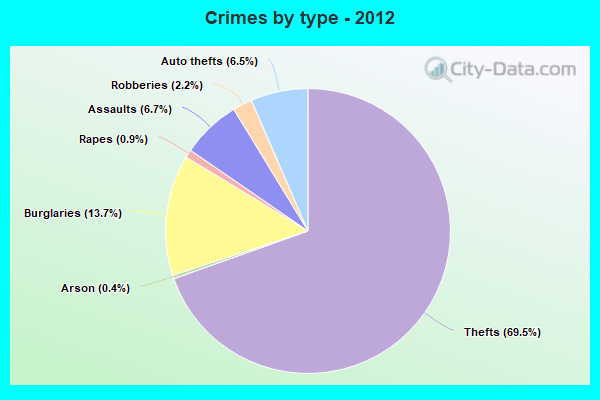
Property crime rate in 2012
| Springfield: | 722.3 |
| U.S. Average: | 267.3 |
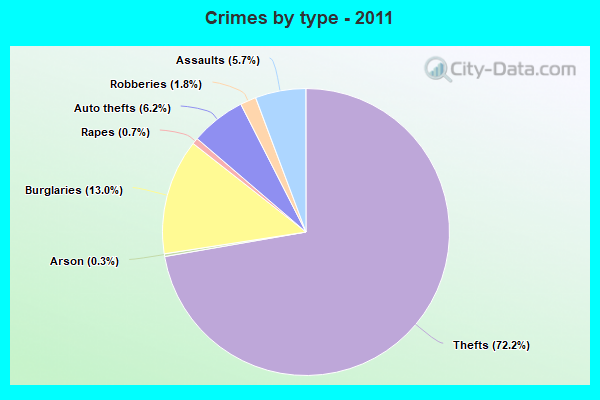
Property crime rate in 2011
| Springfield: | 703.6 |
| U.S. Average: | 273.5 |
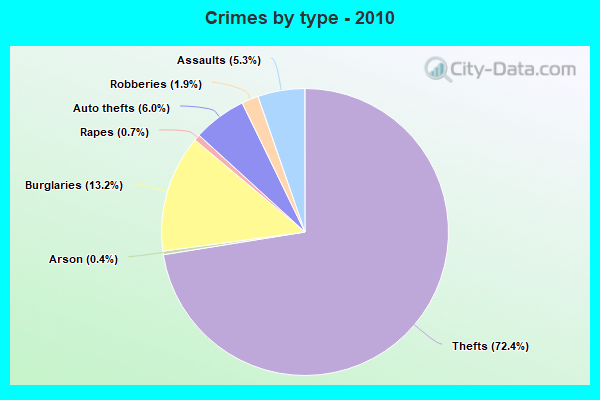
Property crime rate in 2010
| Springfield: | 745.7 |
| U.S. Average: | 276.4 |
Property crime rate in 2009
| Springfield: | 722.3 |
| U.S. Average: | 285.6 |
Property crime rate in 2008
| Springfield: | 740.0 |
| U.S. Average: | 302.2 |
Property crime rate in 2007
| Springfield: | 518.1 |
| U.S. Average: | 309.2 |
Property crime rate in 2006
| Springfield: | 472.1 |
| U.S. Average: | 317.3 |
Property crime rate in 2005
| Springfield: | 449.4 |
| U.S. Average: | 322.3 |
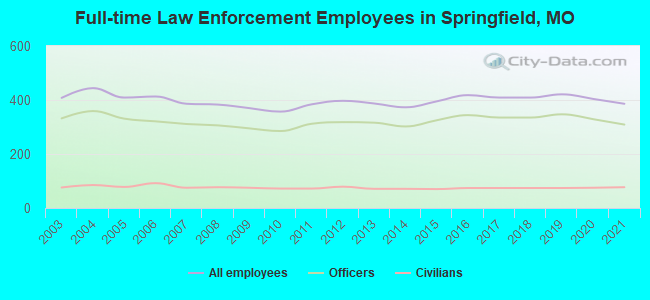
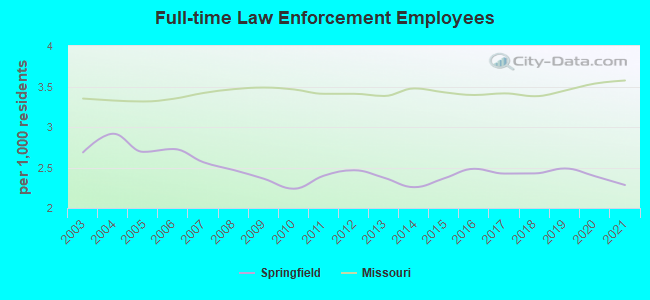
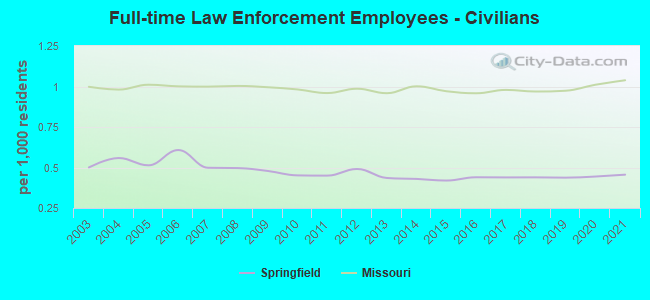
Full-time law enforcement employees in 2021, including police officers: 386 (309 officers - 269 male; 40 female).
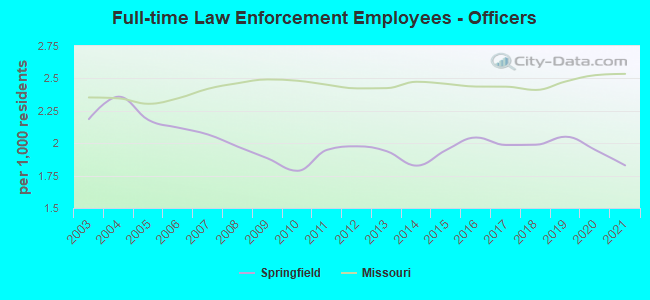
| Officers per 1,000 residents here: | 1.83 |
| Missouri average: | 2.54 |
Full-time law enforcement employees in 2020, including police officers: 404 (329 officers - 291 male; 38 female).
| Officers per 1,000 residents here: | 1.95 |
| Missouri average: | 2.53 |
Full-time law enforcement employees in 2019, including police officers: 421 (347 officers - 312 male; 35 female).
| Officers per 1,000 residents here: | 2.05 |
| Missouri average: | 2.48 |
Full-time law enforcement employees in 2018, including police officers: 409 (335 officers - 303 male; 32 female).
| Officers per 1,000 residents here: | 1.99 |
| Missouri average: | 2.41 |
Full-time law enforcement employees in 2017, including police officers: 409 (335 officers - 304 male; 31 female).
| Officers per 1,000 residents here: | 1.99 |
| Missouri average: | 2.44 |
Full-time law enforcement employees in 2016, including police officers: 418 (344 officers - 313 male; 31 female).
| Officers per 1,000 residents here: | 2.04 |
| Missouri average: | 2.44 |
Full-time law enforcement employees in 2015, including police officers: 395 (325 officers - 298 male; 27 female).
| Officers per 1,000 residents here: | 1.95 |
| Missouri average: | 2.46 |
Full-time law enforcement employees in 2014, including police officers: 373 (302 officers - 282 male; 20 female).
| Officers per 1,000 residents here: | 1.83 |
| Missouri average: | 2.47 |
Full-time law enforcement employees in 2013, including police officers: 387 (316 officers - 295 male; 21 female).
| Officers per 1,000 residents here: | 1.94 |
| Missouri average: | 2.42 |
Full-time law enforcement employees in 2012, including police officers: 397 (318 officers - 297 male; 21 female).
| Officers per 1,000 residents here: | 1.98 |
| Missouri average: | 2.42 |
Full-time law enforcement employees in 2011, including police officers: 384 (312 officers - 295 male; 17 female).
| Officers per 1,000 residents here: | 1.95 |
| Missouri average: | 2.45 |
Full-time law enforcement employees in 2010, including police officers: 357 (285 officers - 267 male; 18 female).
| Officers per 1,000 residents here: | 1.79 |
| Missouri average: | 2.48 |
Full-time law enforcement employees in 2009, including police officers: 370 (295 officers - 275 male; 20 female).
| Officers per 1,000 residents here: | 1.88 |
| Missouri average: | 2.49 |
Full-time law enforcement employees in 2008, including police officers: 383 (306 officers - 287 male; 19 female).
| Officers per 1,000 residents here: | 1.97 |
| Missouri average: | 2.46 |
Full-time law enforcement employees in 2007, including police officers: 386 (311 officers - 290 male; 21 female).
| Officers per 1,000 residents here: | 2.07 |
| Missouri average: | 2.42 |
Full-time law enforcement employees in 2006, including police officers: 413 (321 officers - 299 male; 22 female).
| Officers per 1,000 residents here: | 2.12 |
| Missouri average: | 2.35 |
Full-time law enforcement employees in 2005, including police officers: 409 (331 officers - 309 male; 22 female).
| Officers per 1,000 residents here: | 2.18 |
| Missouri average: | 2.30 |
Full-time law enforcement employees in 2004, including police officers: 444 (359 officers - 336 male; 23 female).
| Officers per 1,000 residents here: | 2.36 |
| Missouri average: | 2.35 |
Full-time law enforcement employees in 2003, including police officers: 408 (332 officers - 308 male; 24 female).
| Officers per 1,000 residents here: | 2.19 |
| Missouri average: | 2.35 |