| Fire incidents reported |
|---|
| Sreet name | Count |
|---|
| ADAMS ST | 8 | | WASHINGTON HWY | 8 | | 5TH AVE | 6 | | KENNINGTON BURTON LANE LA | 6 | | TWIN CLIFFS | 6 | | US HIGHWAY 89 HWY | 6 | | 245 N WASHINGTON ST | 4 | | CO. RD. 174 (BOWLES LN) RD | 4 | | DRY CREEK RD. | 4 | | HWY 238 | 4 | | LINCOLN ST | 4 | | STATE HIGHWAY 238 | 4 | | WASHINGTON ST | 4 | | 10062 HWY 238 | 2 | | 10788 HWY238 | 2 | | 1137 N WASHINGTON | 2 | | 1161 HWY 89 | 2 | | 1161 US 89 | 2 | | 120 EST AVE | 2 | | 123 TWIN CLIFFS | 2 | | 126 CHAPARREL DRIVE | 2 | | 134 COUNTY ROAD 191 | 2 | | 1371 SPRING CREEK ROAD | 2 | | 144 N WASHINGTON ST | 2 | | 144 SESSIONS LANE | 2 |
| | | Fire incidents reported |
|---|
| Sreet name | Count |
|---|
| 150 SWIFT CREEK LANE | 2 | | 160 ECLIPSE AFTON AIR PAR | 2 | | 173 CHAPPRO LN | 2 | | 1730 ALLRED ROAD | 2 | | 176 3RD STREET | 2 | | 195 9TH AVE | 2 | | 198 BURTON LANE | 2 | | 199 SECOND AVE | 2 | | 218 E 9TH STREET | 2 | | 236 HWY | 2 | | 238 HWY | 2 | | 241 HWY | 2 | | 255 E 7TH AFTON WY | 2 | | 255 KENNINGTON BURTON ROD | 2 | | 279 HWY 236 | 2 | | 2946 HWY 241 | 2 | | 303 BURTON LANE | 2 | | 3087 HWY 241 | 2 | | 316 JEFFERSON ST | 2 | | 333 TEMPLE BENCH | 2 | | 342 HWY 238 | 2 | | 345 LINCOLN ST | 2 | | 355 S WASHINGTON | 2 | | 3672 HWY 241 | 2 | | |
|
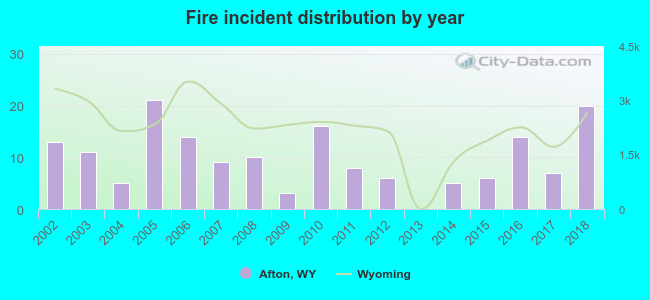 Based on the data from the years 2002 - 2018 the average number of fires per year is 10. The highest number of reported fire incidents - 21 took place in 2005, and the least - 0 in 2013. The data has a rising trend.
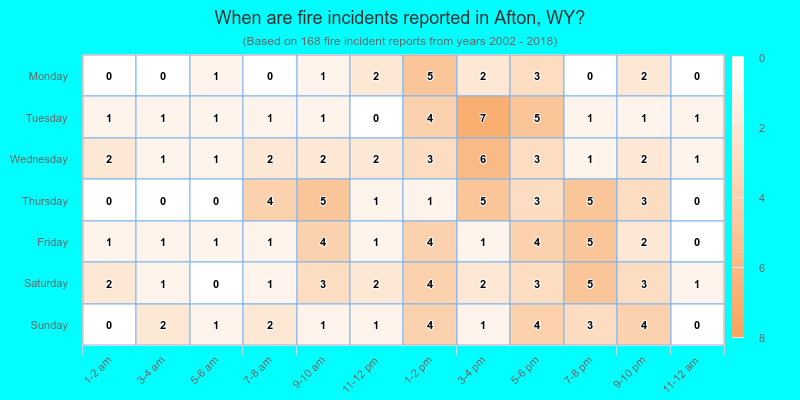
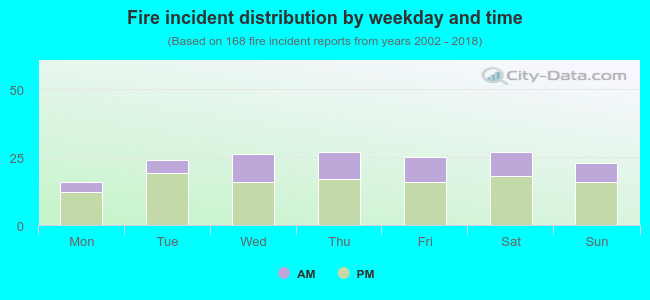 32.1% incidents where reported in the morning and 67.9% in the evening. The most fires (16.1%) took place on Thursday, and the least (9.5%) on Monday.
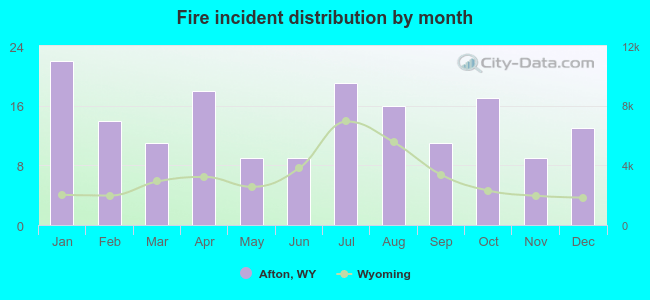 According to the 168 fire incident reports from years 2002 - 2018 most fires (13.1%) took place during January, and the least (5.4%) in May.
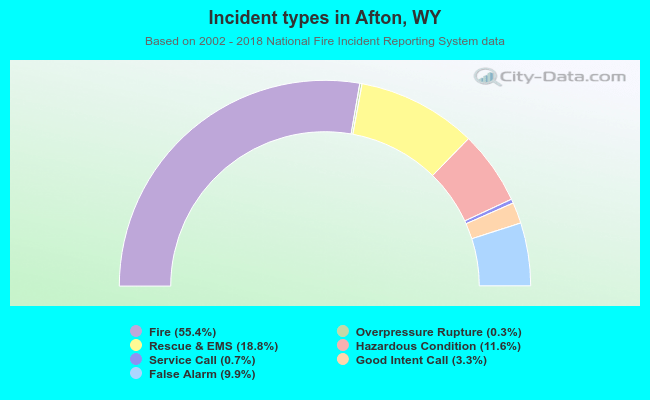 Out of all 303 cases reported during the years 2002 - 2018, the most belonged to the categories: Fire (55.4%), Rescue & EMS (18.8%), and Hazardous Condition (11.6%).
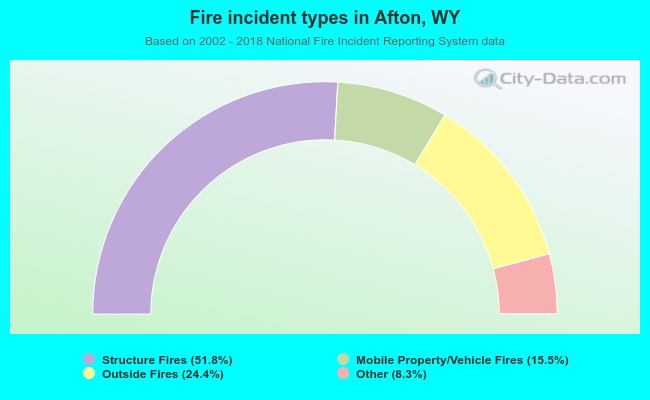 When looking into fire subcategories, the most incidents belonged to: Structure Fires (51.8%), and Outside Fires (24.4%).