Agua Dulce: Fire Incidents, California (CA)
Where are fire incidents reported in Agua Dulce, CA
Something went wrong! Please refresh the page.
|
| |||||||||||||||||||||||||||||||||||||||||||||||||||||||||||||||||||||||||||||||||||||||||||||||||||||||||||||
2005 - 2018 National Fire Incident Reporting System (NFIRS) incidents
- Incident types reported to NFIRS in Agua Dulce, CA
- 88745.6%Rescue & EMS
- 40320.7%Good Intent Call
- 37419.2%Fire
- 1176.0%False Alarm
- 884.5%Hazardous Condition
- 683.5%Service Call
- 50.3%Special Incident
- 30.2%Overpressure Rupture
- Fire incident types reported to NFIRS in Agua Dulce, CA
- 21156.4%Mobile Property/Vehicle Fires
- 13636.4%Outside Fires
- 184.8%Structure Fires
- 92.4%Other
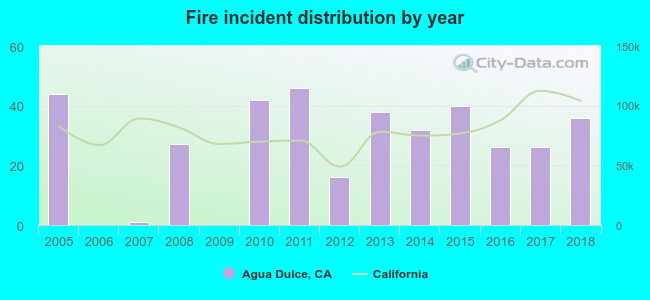 Based on the data from the years 2005 - 2018 the average number of fire incidents per year is 27. The highest number of reported fires - 46 took place in 2011, and the least - 0 in 2006. The data has a declining trend.
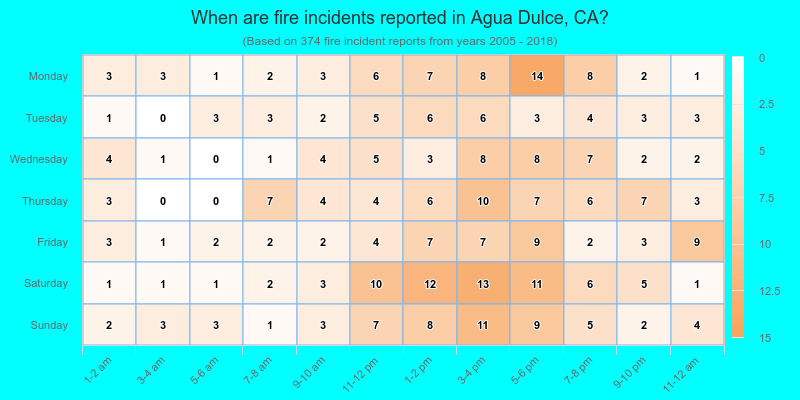
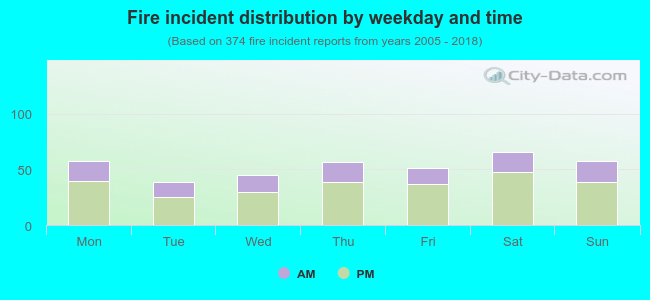 31.0% incidents where reported in the morning and 69.0% in the evening. The most fires (17.6%) took place on Saturday, and the least (10.4%) on Tuesday.
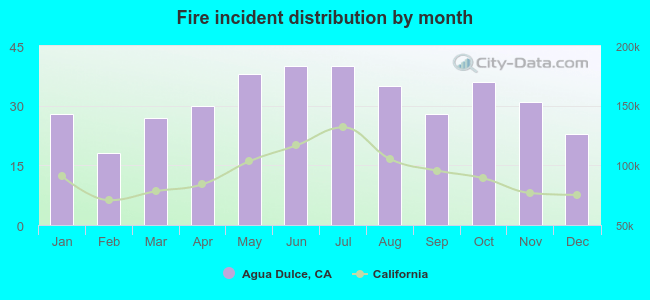 According to the 374 fires from years 2005 - 2018 most fires (10.7%) took place during June, and the least (4.8%) in February.
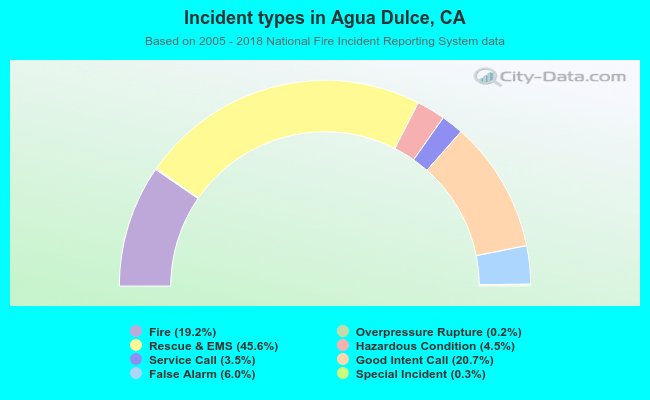 Out of all 1,945 cases reported during the years 2005 - 2018, the most belonged to the categories: Rescue & EMS (45.6%), Good Intent Call (20.7%), and Fire (19.2%).
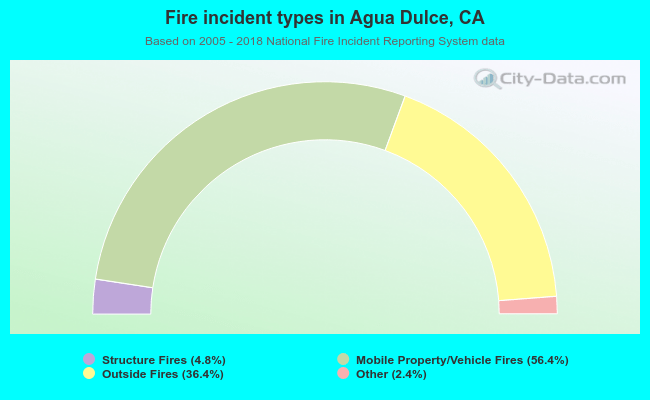 When looking into fire subcategories, the most incidents belonged to: Mobile Property/Vehicle Fires (56.4%), and Outside Fires (36.4%).