Albertville: Fire Incidents, Alabama (AL)
Where are fire incidents reported in Albertville, AL
Something went wrong! Please refresh the page.
| Fire incidents reported | |
|---|---|
| Sreet name | Count |
| ROSE RD | 387 |
| US HWY 431 | 371 |
| LAZY CREEK CIR | 281 |
| AL HWY | 280 |
| DOYLE DR | 270 |
| MATHIS MILL RD | 252 |
| MAIN ST | 240 |
| BALTIMORE AVE | 238 |
| HORTON RD | 199 |
| TURNPIKE RD | 193 |
| SECTION LINE RD | 182 |
| LAZY CREEK RD | 170 |
| HIGHPOINT RD | 160 |
| GEORGE WALLACE DR | 159 |
| KILPATRICK RD | 148 |
| BROAD ST | 141 |
| WHITESVILLE RD | 134 |
| MARTLING RD | 127 |
| HIGHLAND AVE | 107 |
| 431 HWY | 97 |
| SOLITUDE AVE | 88 |
| BRASHERS CHAPEL RD | 84 |
| FRAZIER RD | 79 |
| RAILROAD AVE | 79 |
| ONEONTA CUTOFF RD | 74 |
| HWY 431 | 71 |
| CAHILL RD | 69 |
| MCKINNEY AVE | 69 |
| DAVIS RD | 67 |
| DIXIE DALE CIR | 67 |
2003 - 2018 National Fire Incident Reporting System (NFIRS) incidents
- Incident types reported to NFIRS in Albertville, AL
- 8,15163.8%Rescue & EMS
- 3,00223.5%Fire
- 7135.6%Hazardous Condition
- 5504.3%False Alarm
- 2441.9%Good Intent Call
- 870.7%Service Call
- 130.1%Special Incident
- Fire incident types reported to NFIRS in Albertville, AL
- 1,55951.9%Outside Fires
- 84428.1%Structure Fires
- 34811.6%Mobile Property/Vehicle Fires
- 2518.4%Other
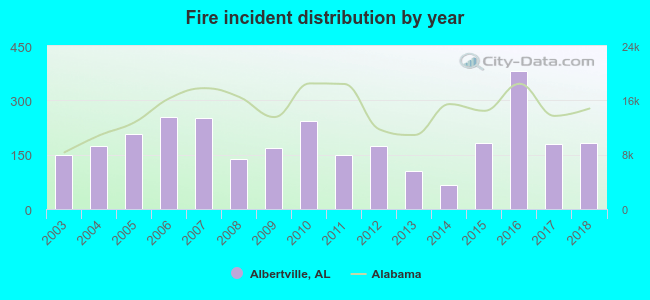 Based on the data from the years 2003 - 2018 the average number of fires per year is 188. The highest number of reported fire incidents - 380 took place in 2016, and the least - 67 in 2014. The data has a growing trend.
The average number of yearly fire incidents per 10k residents in Albertville, AL compared to nearest cities:
(Note: Based on data for the last 3 years, including only cities with population 5,000 and above)
| Albertville: | 115.0 |
| Boaz: | 86.4 |
| Guntersville: | 119.2 |
| Arab: | 62.0 |
| Attalla: | 42.6 |
| Gadsden: | 58.5 |
| Rainbow City: | 50.3 |
| Rainsville: | 89.8 |
| Glencoe: | 85.7 |
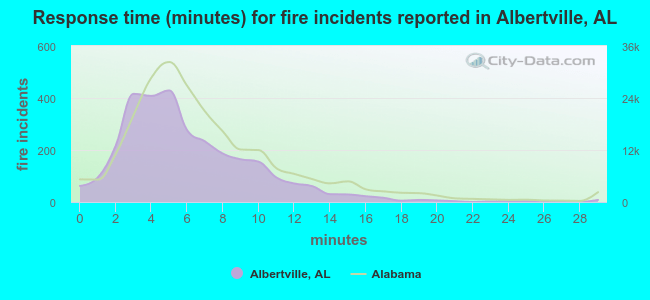 The median response time based on all reported fire incidents is 5 minutes. This is lower compared to the state median value.
The median response time in Albertville, AL compared to nearest cities:
(Note: Based on data for all years, including only cities with at least 500 fire incidents)
| Albertville: | 5 minutes |
| Boaz: | 6 minutes |
| Guntersville: | 6 minutes |
| Arab: | 7 minutes |
| Altoona: | 12 minutes |
| Gadsden: | 5 minutes |
| Blountsville: | 12 minutes |
| Oneonta: | 9 minutes |
| Scottsboro: | 5 minutes |
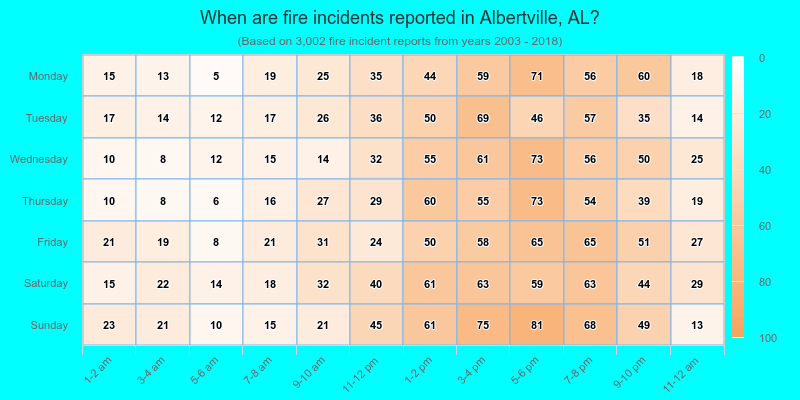
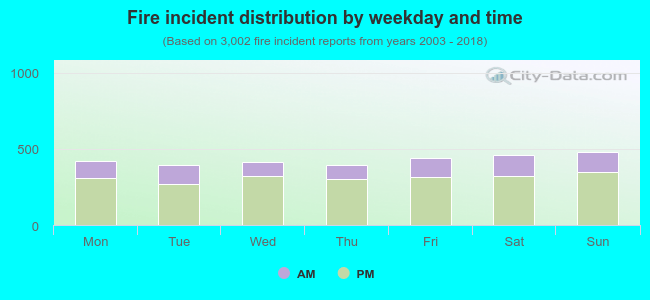 27.3% incidents where reported in the morning and 72.7% in the evening. The most fires (16.1%) took place on Sunday, and the least (13.1%) on Tuesday.
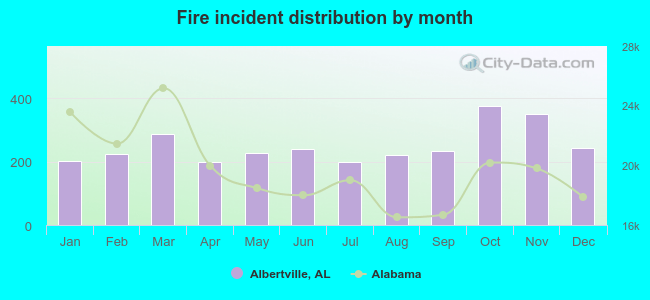 Based on the 3,002 fire incident reports from years 2003 - 2018 most fires (12.6%) took place during October, and the least (6.6%) in April.
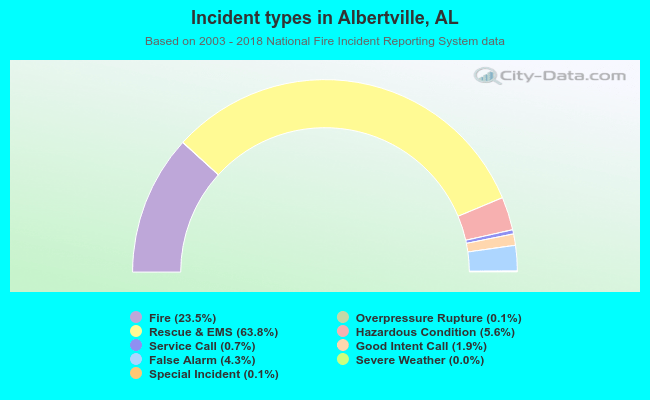 Out of all 12,772 cases reported during the years 2003 - 2018, the most belonged to the categories: Rescue & EMS (63.8%), Fire (23.5%), and Hazardous Condition (5.6%).
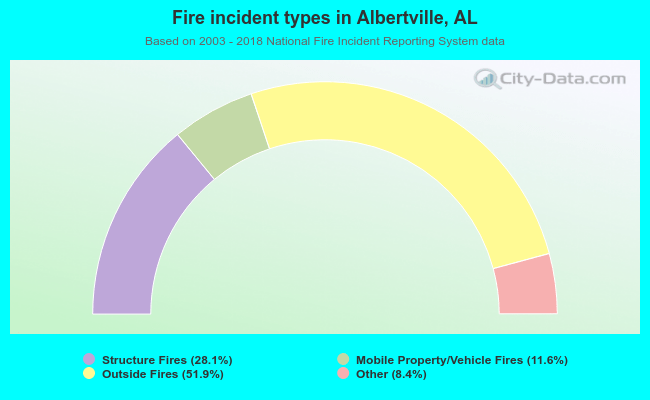 When looking into fire subcategories, the most incidents belonged to: Outside Fires (51.9%), and Structure Fires (28.1%).