Albertville: Fire Incidents, Minnesota (MN)
Where are fire incidents reported in Albertville, MN
Something went wrong! Please refresh the page.
|
| |||||||||||||||||||||||||||||||||||||||||||||||||||||||||||||||||||||||||||||||||||||||||||||||||||||||||||||
2003 - 2018 National Fire Incident Reporting System (NFIRS) incidents
- Incident types reported to NFIRS in Albertville, MN
- 55041.9%Rescue & EMS
- 27821.2%Fire
- 17313.2%Hazardous Condition
- 16412.5%Good Intent Call
- 1068.1%False Alarm
- 282.1%Service Call
- 151.1%Severe Weather
- Fire incident types reported to NFIRS in Albertville, MN
- 11742.1%Structure Fires
- 7928.4%Outside Fires
- 6523.4%Mobile Property/Vehicle Fires
- 176.1%Other
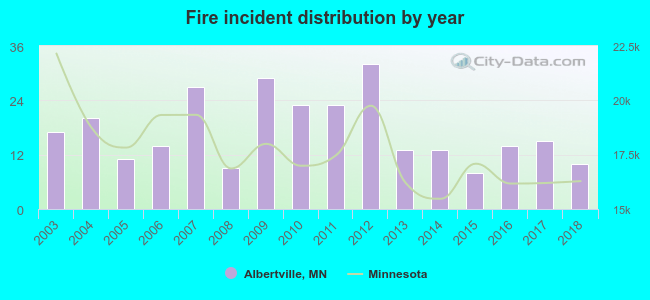 According to the data from the years 2003 - 2018 the average number of fires per year is 17. The highest number of fire incidents - 32 took place in 2012, and the least - 8 in 2015. The data has a declining trend.
The average number of yearly fire incidents per 10k residents in Albertville, MN compared to nearest cities:
(Note: Based on data for the last 3 years, including only cities with population 5,000 and above)
| Albertville: | 17.9 |
| Otsego: | 11.7 |
| Rogers: | 22.1 |
| Elk River: | 24.0 |
| Monticello: | 29.2 |
| Big Lake: | 31.9 |
| Corcoran: | 35.0 |
| Ramsey: | 15.8 |
| Buffalo: | 25.6 |
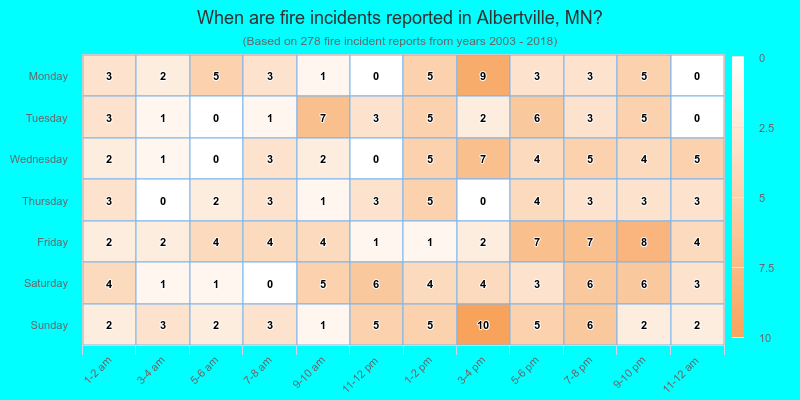
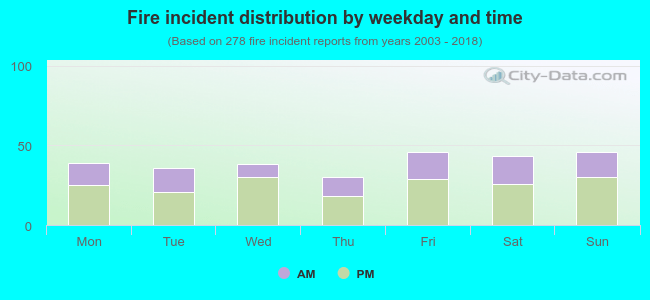 35.6% incidents where reported in the morning and 64.4% in the evening. The most fires (16.5%) took place on Friday, and the least (10.8%) on Thursday.
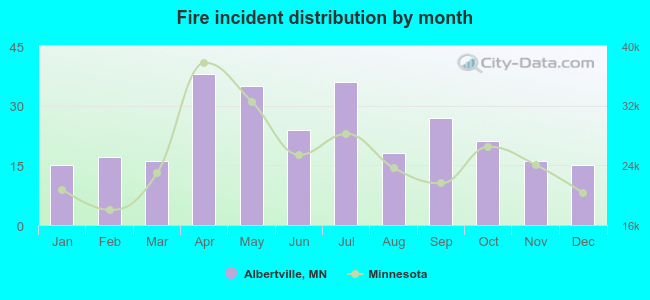 Based on the 278 fire incidents from years 2003 - 2018 most fires (13.7%) took place during April, and the least (5.4%) in January.
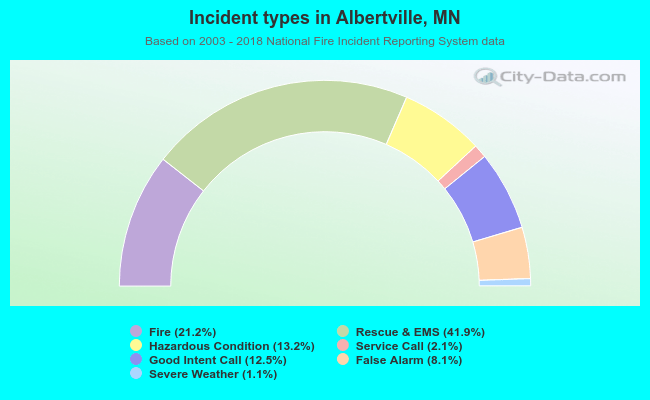 Out of all 1,314 cases reported during the years 2003 - 2018, the most belonged to the categories: Overpressure Rupture (41.9%), Fire (21.2%), and Rescue & EMS (13.2%).
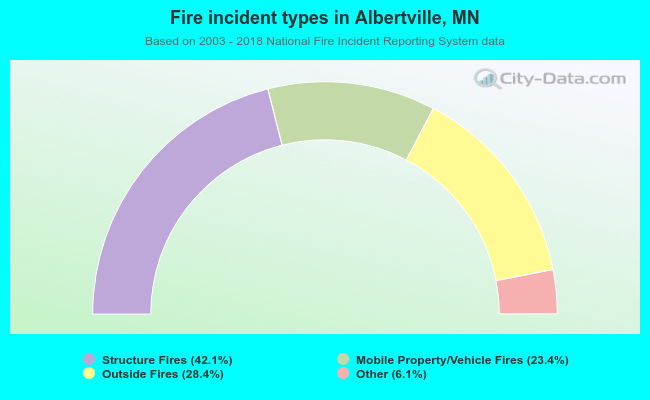 When looking into fire subcategories, the most reports belonged to: Structure Fires (42.1%), and Outside Fires (28.4%).