Anacortes: Fire Incidents, Washington (WA)
Where are fire incidents reported in Anacortes, WA
Something went wrong! Please refresh the page.
| Fire incidents reported | |
|---|---|
| Sreet name | Count |
| COMMERCIAL AVE | 238 |
| 11TH ST | 136 |
| Q AVE | 76 |
| STATE ROUTE 20 | 62 |
| R AVE | 58 |
| 20TH ST | 48 |
| 24TH ST | 46 |
| MT ERIE | 46 |
| 4TH ST | 44 |
| SUNSET AVE | 42 |
| CAP SANTE LOOKOUT | 40 |
| T AVE | 38 |
| O AVE | 36 |
| 6TH ST | 34 |
| HWY 20 | 34 |
| M AVE | 32 |
| SR 20 | 32 |
| 22ND ST | 30 |
| CASINO DRIVE | 30 |
| FIDALGO BAY RD | 30 |
| GIBRALTER RD | 30 |
| OAKES AVE | 30 |
| 29TH ST | 28 |
| HIGHWAY 20 | 28 |
| SKYLINE WAY | 28 |
| 12TH ST | 26 |
| I AVE | 26 |
| MARCHS POINT RD | 26 |
| CAMPBELL LAKE RD | 24 |
| D AVE | 24 |
| Other | 202 |
2002 - 2018 National Fire Incident Reporting System (NFIRS) incidents
- Incident types reported to NFIRS in Anacortes, WA
- 9,54864.3%Rescue & EMS
- 1,60410.8%Fire
- 1,3559.1%Service Call
- 1,2388.3%Hazardous Condition
- 6274.2%False Alarm
- 3812.6%Good Intent Call
- 600.4%Special Incident
- Fire incident types reported to NFIRS in Anacortes, WA
- 68242.5%Structure Fires
- 59837.3%Outside Fires
- 22514.0%Mobile Property/Vehicle Fires
- 996.2%Other
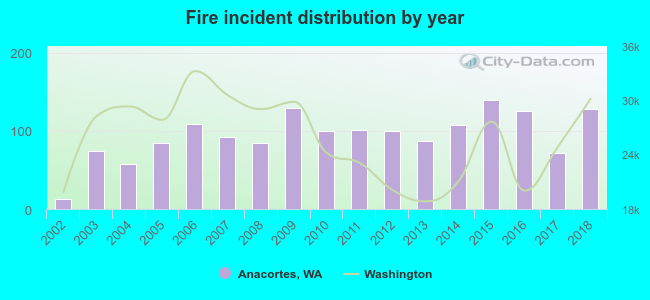 According to the data from the years 2002 - 2018 the average number of fire incidents per year is 94. The highest number of reported fire incidents - 139 took place in 2015, and the least - 13 in 2002. The data has an increasing trend.
The average number of yearly fire incidents per 10k residents in Anacortes, WA compared to nearest cities:
(Note: Based on data for the last 3 years, including only cities with population 5,000 and above)
| Anacortes: | 66.5 |
| Bow: | 14.2 |
| Burlington: | 91.4 |
| Oak Harbor: | 43.0 |
| Mount Vernon: | 19.3 |
| Bellingham: | 23.1 |
| Sudden Valley: | 1.6 |
| Stanwood: | 41.5 |
| Ferndale: | 73.2 |
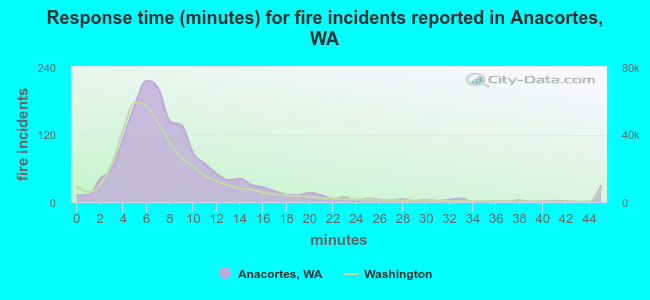 The median response time based on all reported fire incidents is 7 minutes. This is about the same as the Washington median value.
The median response time in Anacortes, WA compared to nearest cities:
(Note: Based on data for all years, including only cities with at least 500 fire incidents)
| Anacortes: | 7 minutes |
| Burlington: | 6 minutes |
| Oak Harbor: | 5 minutes |
| Mount Vernon: | 7 minutes |
| Bellingham: | 7 minutes |
| Stanwood: | 8 minutes |
| Ferndale: | 9 minutes |
| Port Townsend: | 7 minutes |
| Arlington: | 8 minutes |
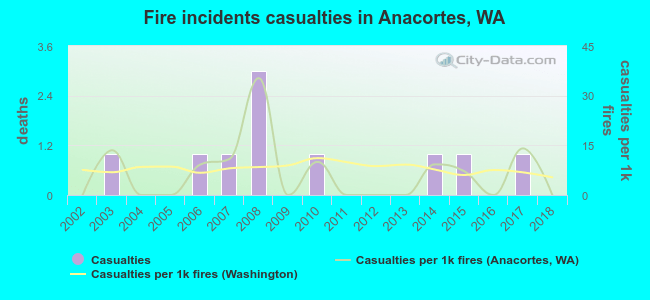 Based on the data from the years 2002 - 2018 the average number of fire-related casualties per year is 1. The highest number of injuries - 3 took place in 2008, and the lowest - 0 in 2002. The data has a constant trend.
The average number of casualties per 1,000 fire incidents is 6. This indicator was the highest - 35 in 2008, and the lowest 0 in 2002. The trend for casualties per 1,000 incidents is dropping. Compared to the state value the number of injuries per 1,000 fires is lower.
Based on the data from the years 2002 - 2018 the average number of fire-related casualties per year is 1. The highest number of injuries - 3 took place in 2008, and the lowest - 0 in 2002. The data has a constant trend.
The average number of casualties per 1,000 fire incidents is 6. This indicator was the highest - 35 in 2008, and the lowest 0 in 2002. The trend for casualties per 1,000 incidents is dropping. Compared to the state value the number of injuries per 1,000 fires is lower.Casualties per 1,000 incidents in Anacortes, WA compared to nearest cities:
(Note: Based on data for all years, including only cities with at least 500 fire incidents)
| Anacortes: | 6.2 |
| Burlington: | 2.5 |
| Oak Harbor: | 9.9 |
| Mount Vernon: | 4.3 |
| Bellingham: | 1.7 |
| Stanwood: | 0.5 |
| Ferndale: | 2.2 |
| Port Townsend: | 5.3 |
| Arlington: | 4.7 |
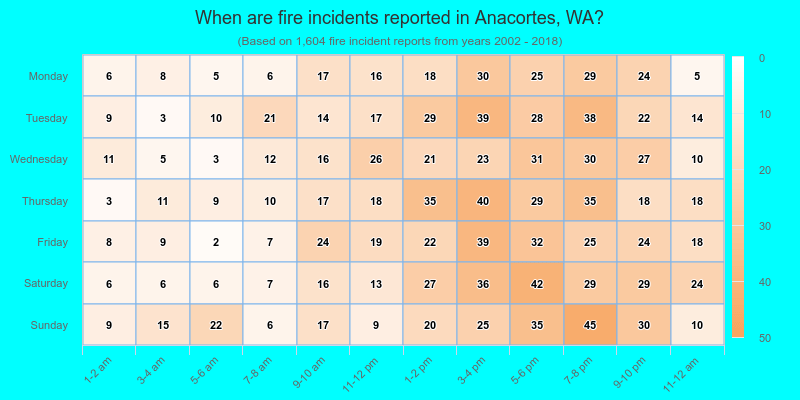
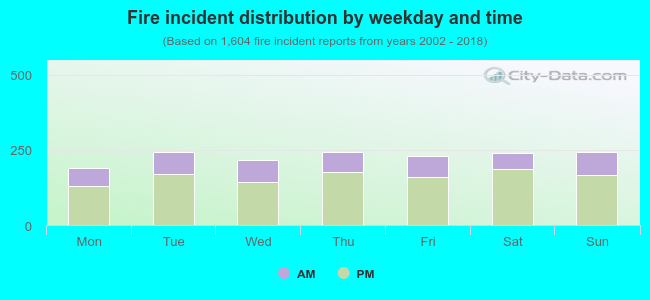 29.6% incidents where reported in the morning and 70.4% in the evening. The most fires (15.2%) took place on Tuesday, and the least (11.8%) on Monday.
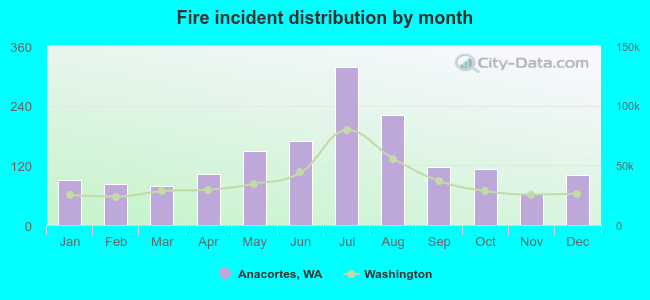 Based on the 1,604 reports from years 2002 - 2018 most fires (19.8%) took place during July, and the least (3.9%) in November.
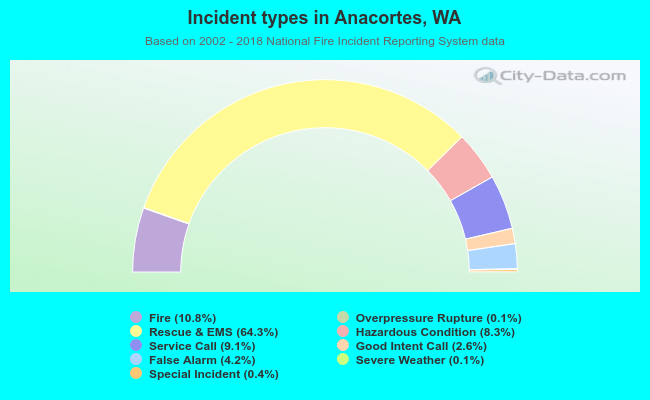 Out of all 14,840 cases reported during the years 2002 - 2018, the most belonged to the categories: Rescue & EMS (64.3%), Fire (10.8%), and Service Call (9.1%).
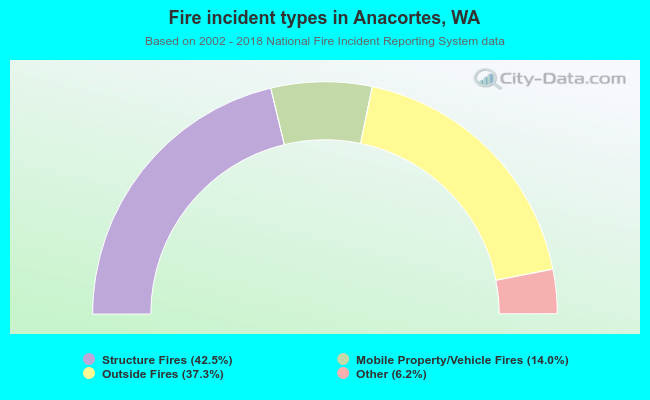 When looking into fire subcategories, the most reports belonged to: Structure Fires (42.5%), and Outside Fires (37.3%).