Ankeny: Fire Incidents, Iowa (IA)
Where are fire incidents reported in Ankeny, IA
Something went wrong! Please refresh the page.
| Fire incidents reported | |
|---|---|
| Sreet name | Count |
| DELAWARE AVE | 166 |
| 1ST ST | 96 |
| ANKENY BLVD | 90 |
| STATE ST | 64 |
| ORALABOR RD | 60 |
| I35 NB HWY | 44 |
| INTERSTATE 35 | 44 |
| 14TH ST | 34 |
| 2ND ST | 34 |
| 5TH ST | 30 |
| SUMMER PARK DR | 30 |
| 16TH ST | 28 |
| CREEKVIEW DR | 28 |
| I35 SB HWY | 28 |
| 4TH ST | 26 |
| POLK CITY DR | 24 |
| 29TH ST | 22 |
| 9TH ST | 22 |
| BELMONT DR | 22 |
| PRAIRIE RIDGE DR | 22 |
| 110TH AVE | 20 |
| 35TH ST | 20 |
| 3RD ST | 20 |
| 8TH ST | 20 |
| HICKORY LN | 20 |
| ORDNANCE RD | 20 |
| TRILEIN DR | 20 |
| 118TH AVE | 18 |
| 6TH DR | 18 |
| SCHOOL ST | 18 |
| Other | 170 |
2002 - 2016 National Fire Incident Reporting System (NFIRS) incidents
- Incident types reported to NFIRS in Ankeny, IA
- 2,65443.7%Rescue & EMS
- 1,27821.1%Fire
- 72712.0%False Alarm
- 70511.6%Hazardous Condition
- 4477.4%Good Intent Call
- 2393.9%Service Call
- 100.2%Overpressure Rupture
- Fire incident types reported to NFIRS in Ankeny, IA
- 55843.7%Structure Fires
- 43934.4%Outside Fires
- 21316.7%Mobile Property/Vehicle Fires
- 685.3%Other
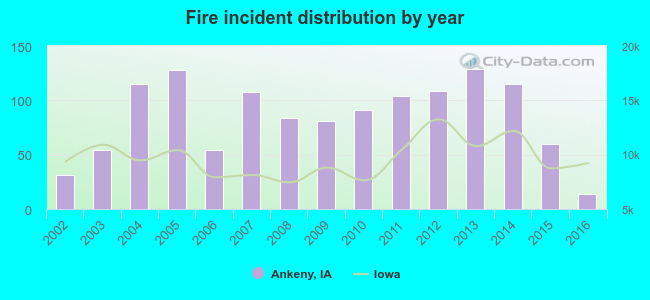 According to the data from the years 2002 - 2016 the average number of fire incidents per year is 85. The highest number of reported fires - 129 took place in 2013, and the least - 14 in 2016. The data has a declining trend.
The average number of yearly fire incidents per 10k residents in Ankeny, IA compared to nearest cities:
(Note: Based on data for the last 3 years, including only cities with population 5,000 and above)
| Ankeny: | 1.4 |
| Johnston: | 21.4 |
| Altoona: | 12.6 |
| Urbandale: | 10.8 |
| Des Moines: | 20.0 |
| Grimes: | 20.9 |
| Pleasant Hill: | 13.1 |
| Clive: | 16.4 |
| West Des Moines: | 13.6 |
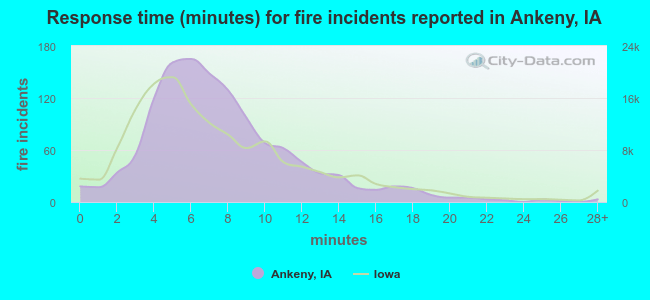 The median response time based on all reported fire incidents is 7 minutes. This is about the same as the state median value.
The median response time in Ankeny, IA compared to nearest cities:
(Note: Based on data for all years, including only cities with at least 500 fire incidents)
| Ankeny: | 7 minutes |
| Johnston: | 9 minutes |
| Altoona: | 7 minutes |
| Urbandale: | 7 minutes |
| Des Moines: | 5 minutes |
| Pleasant Hill: | 10 minutes |
| Clive: | 6 minutes |
| West Des Moines: | 6 minutes |
| Ames: | 5 minutes |
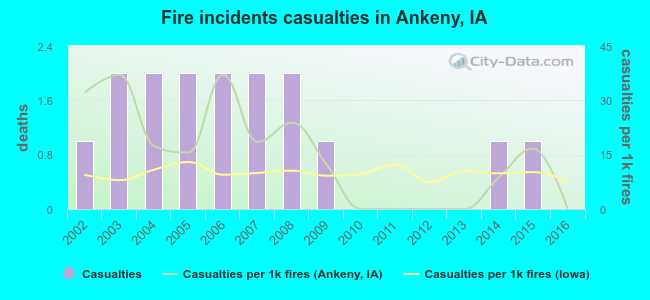 According to the reports from the years 2002 - 2016 the average number of fire-related yearly casualties is 1. The highest number of reported casualties - 2 took place in 2003, and the lowest - 0 in 2010. The data has a declining trend.
The average number of casualties per 1,000 fire incidents is 15. This indicator was the highest - 37 in 2003, and the lowest 0 in 2010. The trend for injuries per 1,000 fires is dropping. Compared to the state value the number of injuries per 1,000 fire incidents is higher.
According to the reports from the years 2002 - 2016 the average number of fire-related yearly casualties is 1. The highest number of reported casualties - 2 took place in 2003, and the lowest - 0 in 2010. The data has a declining trend.
The average number of casualties per 1,000 fire incidents is 15. This indicator was the highest - 37 in 2003, and the lowest 0 in 2010. The trend for injuries per 1,000 fires is dropping. Compared to the state value the number of injuries per 1,000 fire incidents is higher.Casualties per 1,000 incidents in Ankeny, IA compared to nearest cities:
(Note: Based on data for all years, including only cities with at least 500 fire incidents)
| Ankeny: | 12.5 |
| Johnston: | 0.0 |
| Altoona: | 14.5 |
| Urbandale: | 11.9 |
| Des Moines: | 22.7 |
| Pleasant Hill: | 3.2 |
| Clive: | 3.2 |
| West Des Moines: | 7.6 |
| Ames: | 8.5 |
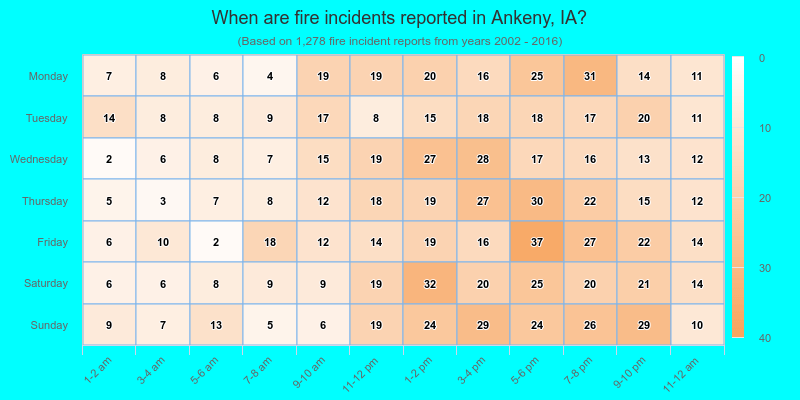
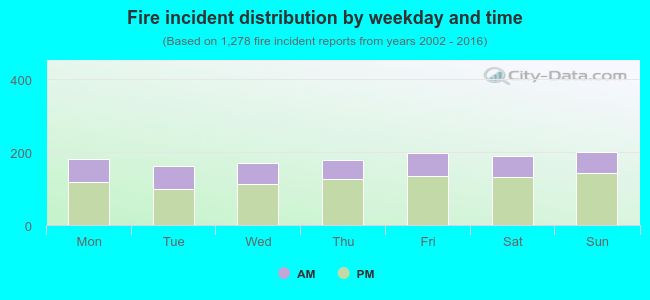 32.5% incidents where reported in the morning and 67.5% in the evening. The most fires (15.7%) took place on Sunday, and the least (12.8%) on Tuesday.
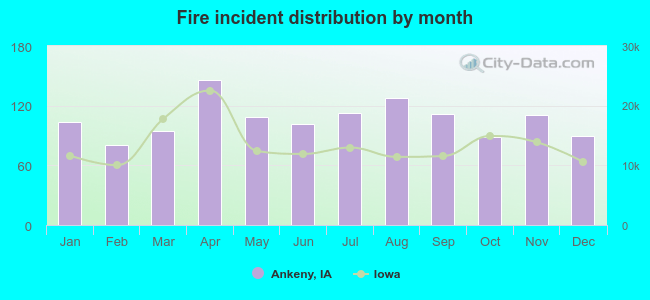 Based on the 1,278 reports from years 2002 - 2016 most fires (11.4%) took place during April, and the least (6.3%) in February.
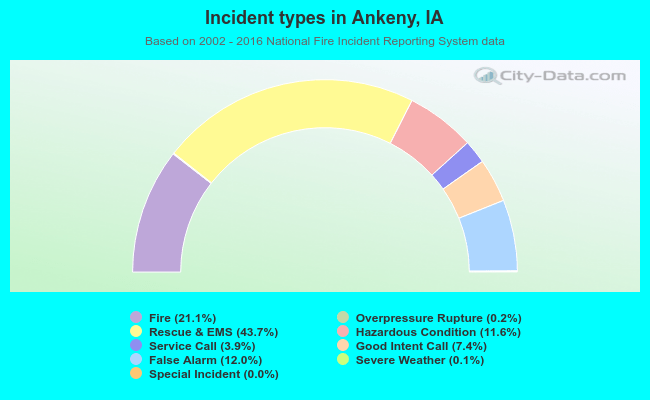 Out of all 6,069 cases reported during the years 2002 - 2016, the most belonged to the categories: Rescue & EMS (43.7%), Fire (21.1%), and False Alarm (12.0%).
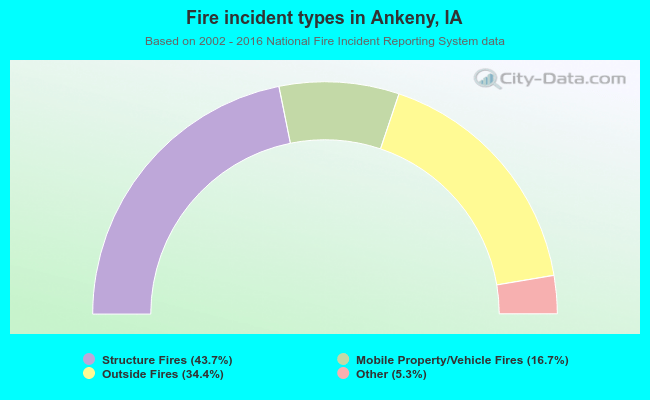 When looking into fire subcategories, the most incidents belonged to: Structure Fires (43.7%), and Outside Fires (34.4%).