Apple Valley: Fire Incidents, Minnesota (MN)
Where are fire incidents reported in Apple Valley, MN
Something went wrong! Please refresh the page.
| Fire incidents reported | |
|---|---|
| Sreet name | Count |
| CEDAR AVE | 94 |
| WHITNEY DR | 70 |
| GERMANE AVE | 68 |
| 150 ST | 66 |
| GALAXIE AVE | 64 |
| 157 ST | 62 |
| PENNOCK AVE | 46 |
| FLORENCE TRL | 40 |
| PILOT KNOB RD | 38 |
| GARRETT AVE | 36 |
| FOUNDERS LN | 34 |
| JOHNNY CAKE RIDGE RD | 34 |
| HAYES RD | 32 |
| WALNUT LN | 28 |
| 147 ST | 26 |
| 158 ST | 24 |
| 153 ST | 22 |
| ENDICOTT WAY | 22 |
| GLAZIER AVE | 22 |
| REDWOOD DR | 22 |
| 134 ST | 20 |
| FLORENCE TRL | 20 |
| GARDEN VIEW DR | 20 |
| ST | 20 |
| 140 ST | 18 |
| 145 ST | 18 |
| 149 ST | 18 |
| GENEVA WAY | 18 |
| 123 ST | 16 |
| 157TH ST | 16 |
| Other | 294 |
2002 - 2018 National Fire Incident Reporting System (NFIRS) incidents
- Incident types reported to NFIRS in Apple Valley, MN
- 5,60951.0%Rescue & EMS
- 1,40712.8%Hazardous Condition
- 1,32812.1%Fire
- 1,26811.5%False Alarm
- 1,0229.3%Good Intent Call
- 2932.7%Service Call
- 350.3%Overpressure Rupture
- 270.2%Severe Weather
- Fire incident types reported to NFIRS in Apple Valley, MN
- 68251.4%Structure Fires
- 35026.4%Outside Fires
- 23817.9%Mobile Property/Vehicle Fires
- 584.4%Other
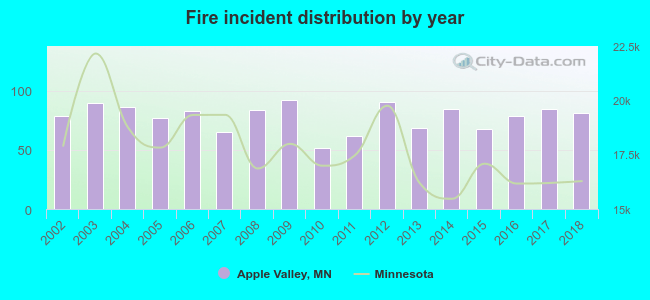 According to the data from the years 2002 - 2018 the average number of fires per year is 78. The highest number of reported fire incidents - 92 took place in 2009, and the least - 52 in 2010. The data has an increasing trend.
The average number of yearly fire incidents per 10k residents in Apple Valley, MN compared to nearest cities:
(Note: Based on data for the last 3 years, including only cities with population 5,000 and above)
| Apple Valley: | 16.2 |
| Burnsville: | 19.6 |
| Lakeville: | 13.6 |
| Rosemount: | 14.5 |
| Eagan: | 12.1 |
| Farmington: | 18.0 |
| Savage: | 9.7 |
| Bloomington: | 21.2 |
| Richfield: | 20.8 |
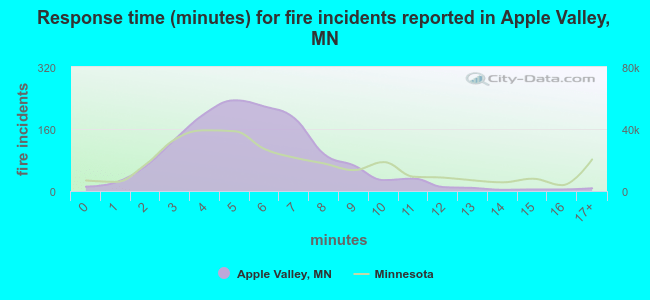 The median response time based on all reported fire incidents is 5 minutes. This is lower compared to the state median value.
The median response time in Apple Valley, MN compared to nearest cities:
(Note: Based on data for all years, including only cities with at least 500 fire incidents)
| Apple Valley: | 5 minutes |
| Burnsville: | 6 minutes |
| Lakeville: | 7 minutes |
| Eagan: | 6 minutes |
| Farmington: | 6 minutes |
| Savage: | 5 minutes |
| Bloomington: | 5 minutes |
| Richfield: | 4 minutes |
| Inver Grove Heights: | 7 minutes |
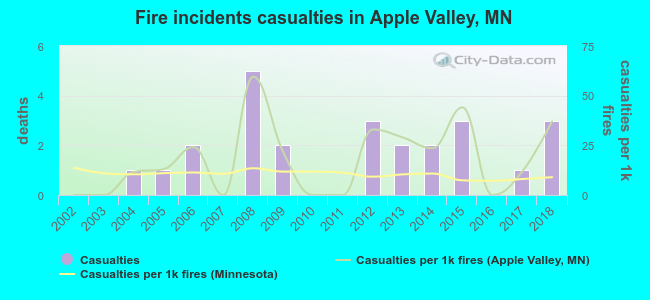 According to the reports from the years 2002 - 2018 the average number of fire-related casualties per year is 1. The highest number of reported casualties - 5 took place in 2008, and the lowest - 0 in 2002. The data has a growing trend.
The average number of casualties per 1,000 fire incidents is 18. This indicator was the highest - 60 in 2008, and the lowest 0 in 2002. The trend for casualties per 1,000 incidents is growing. Compared to the state value the number of injuries per 1,000 fires is higher.
According to the reports from the years 2002 - 2018 the average number of fire-related casualties per year is 1. The highest number of reported casualties - 5 took place in 2008, and the lowest - 0 in 2002. The data has a growing trend.
The average number of casualties per 1,000 fire incidents is 18. This indicator was the highest - 60 in 2008, and the lowest 0 in 2002. The trend for casualties per 1,000 incidents is growing. Compared to the state value the number of injuries per 1,000 fires is higher.Casualties per 1,000 incidents in Apple Valley, MN compared to nearest cities:
(Note: Based on data for all years, including only cities with at least 500 fire incidents)
| Apple Valley: | 18.8 |
| Burnsville: | 33.4 |
| Lakeville: | 10.2 |
| Eagan: | 7.3 |
| Farmington: | 7.8 |
| Savage: | 11.5 |
| Bloomington: | 10.0 |
| Richfield: | 20.5 |
| Inver Grove Heights: | 5.1 |
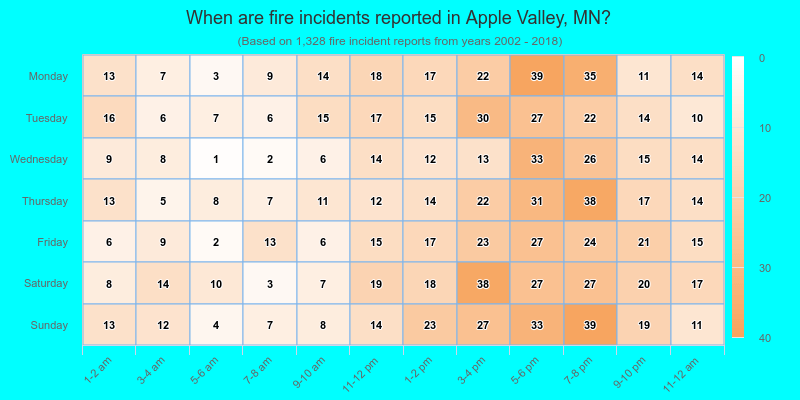
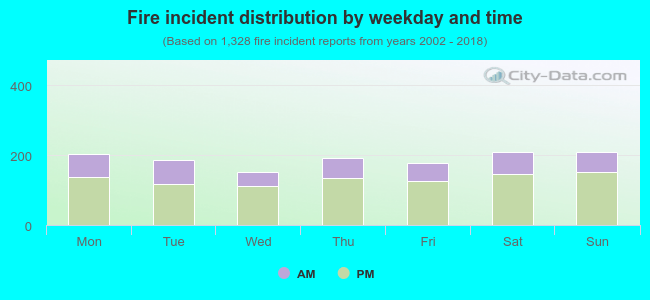 29.9% incidents where reported in the morning and 70.1% in the evening. The most fires (15.8%) took place on Sunday, and the least (11.5%) on Wednesday.
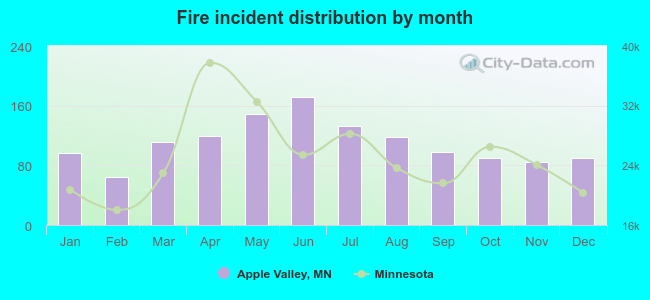 According to the 1,328 reports from years 2002 - 2018 most fires (13.0%) took place during June, and the least (4.9%) in February.
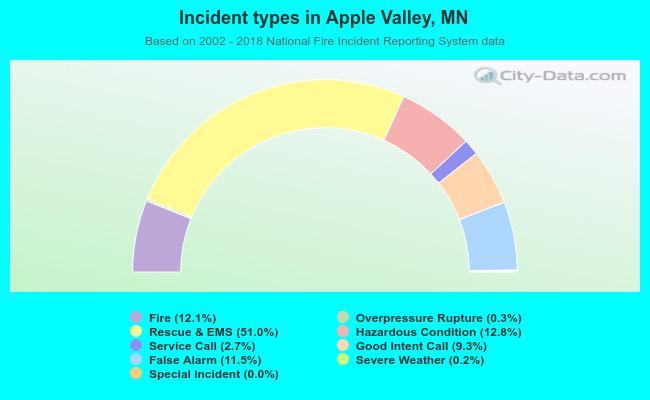 Out of all 10,994 cases reported during the years 2002 - 2018, the most belonged to the categories: Rescue & EMS (51.0%), Hazardous Condition (12.8%), and Fire (12.1%).
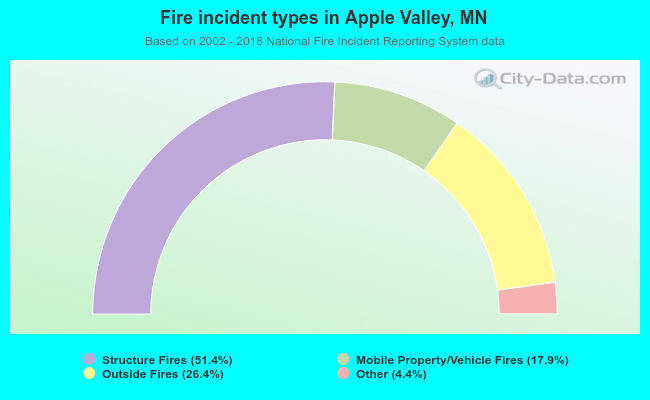 When looking into fire subcategories, the most incidents belonged to: Structure Fires (51.4%), and Outside Fires (26.4%).