Arma: Fire Incidents, Kansas (KS)
Where are fire incidents reported in Arma, KS
Something went wrong! Please refresh the page.
|
| |||||||||||||||||||||||||||||||||||||||||||||||||||||||||||||||||||||||||||||||||||||||||||||||||||||||||||||
2002 - 2018 National Fire Incident Reporting System (NFIRS) incidents
- Incident types reported to NFIRS in Arma, KS
- 43552.9%Fire
- 14317.4%Hazardous Condition
- 8810.7%Rescue & EMS
- 708.5%Good Intent Call
- 364.4%Severe Weather
- 263.2%False Alarm
- 222.7%Service Call
- 30.4%Overpressure Rupture
- Fire incident types reported to NFIRS in Arma, KS
- 28565.5%Outside Fires
- 9622.1%Structure Fires
- 419.4%Mobile Property/Vehicle Fires
- 133.0%Other
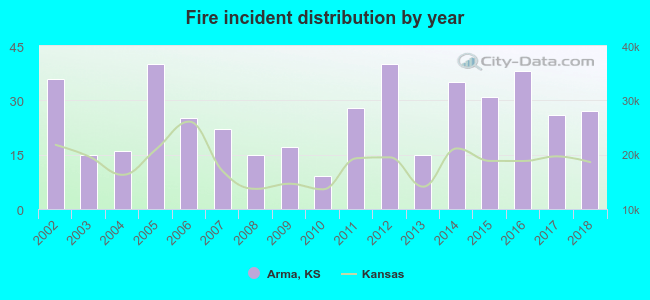 Based on the data from the years 2002 - 2018 the average number of fires per year is 26. The highest number of fire incidents - 40 took place in 2005, and the least - 9 in 2010. The data has a decreasing trend.
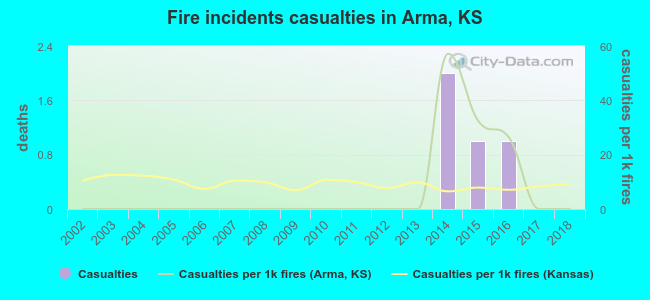 Based on the data from the years 2002 - 2018 the average number of fire-related casualties per year is 0. The highest number of injuries - 2 took place in 2014, and the lowest - 0 in 2002. The data has a constant trend.
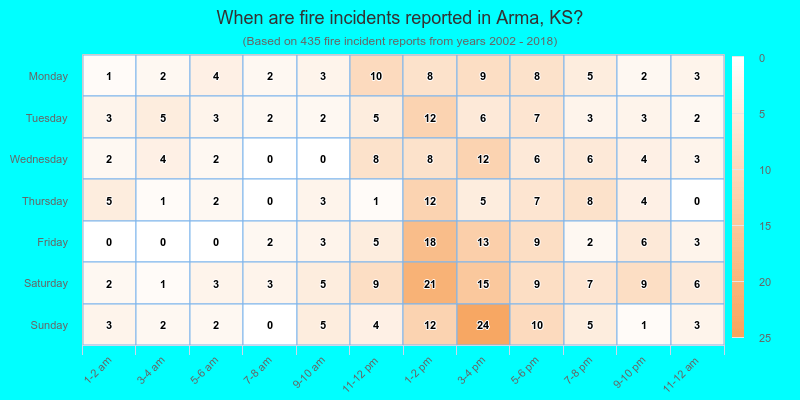
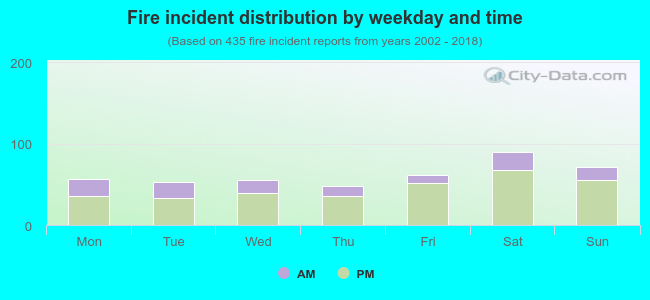 27.4% incidents where reported in the morning and 72.6% in the evening. The most fires (20.7%) took place on Saturday, and the least (11.0%) on Thursday.
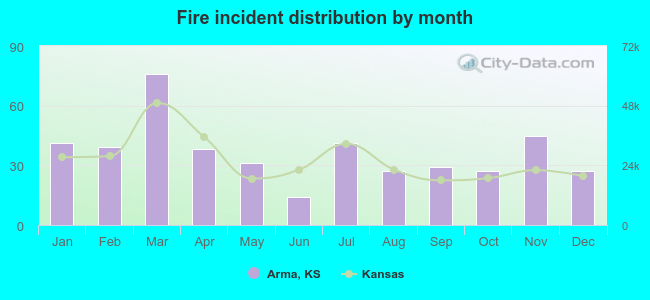 According to the 435 incident reports from years 2002 - 2018 most fires (17.5%) took place during March, and the least (3.2%) in June.
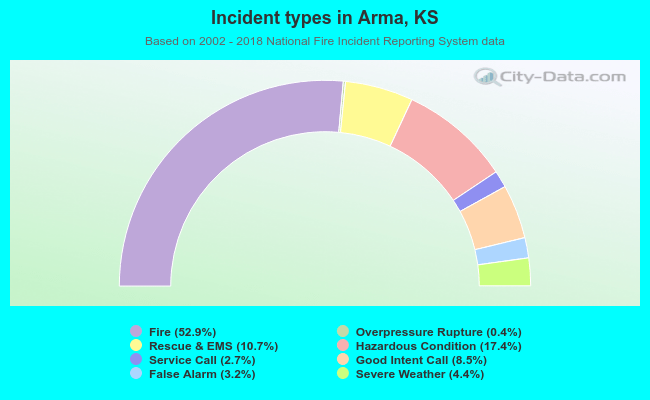 Out of all 823 cases reported during the years 2002 - 2018, the most belonged to the categories: Fire (52.9%), Hazardous Condition (17.4%), and Rescue & EMS (10.7%).
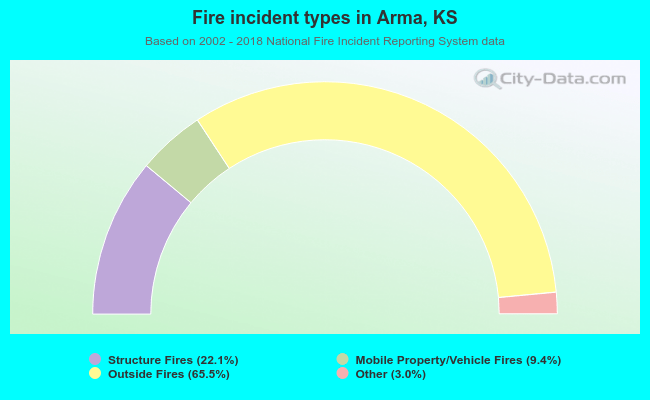 When looking into fire subcategories, the most reports belonged to: Outside Fires (65.5%), and Structure Fires (22.1%).